PYTHON CHARTS
Home
matplotlib
seaborn
plotly
pandas
colors
COLORS
COLOR PALETTES
Learn R
R CODER
R CHARTS
Contact
Español
Python chart gallery
Browse all the charts of the site and filter them by type or library
Facebook logo
Twitter logo
GitHub logo
matplotlib
seaborn
plotly
pandas
folium
Correlation
Distribution
Evolution
Part of a whole
Ranking
Spatial
Miscellaneous
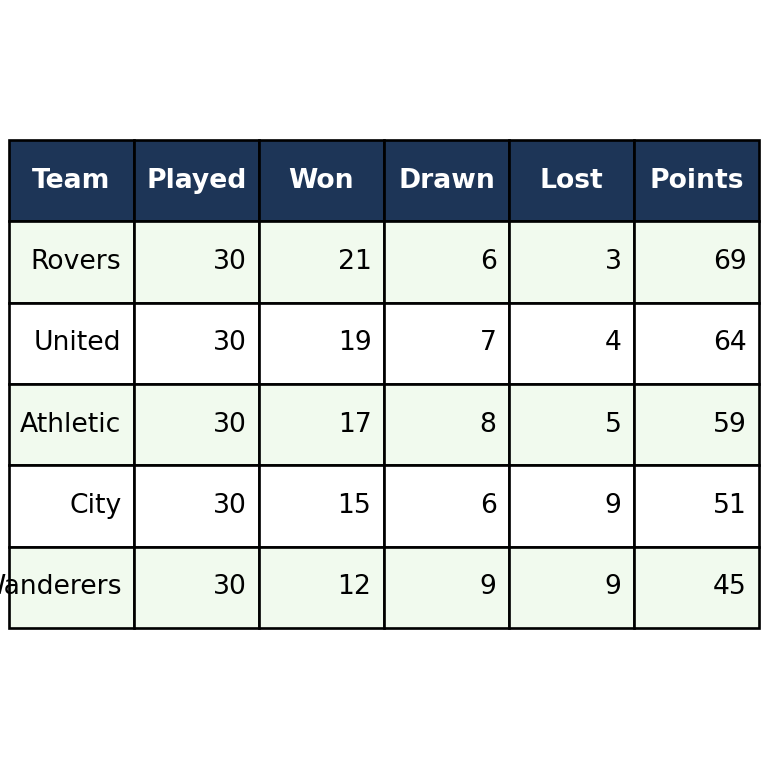
Tables in matplotlib
Streamgraph in matplotlib
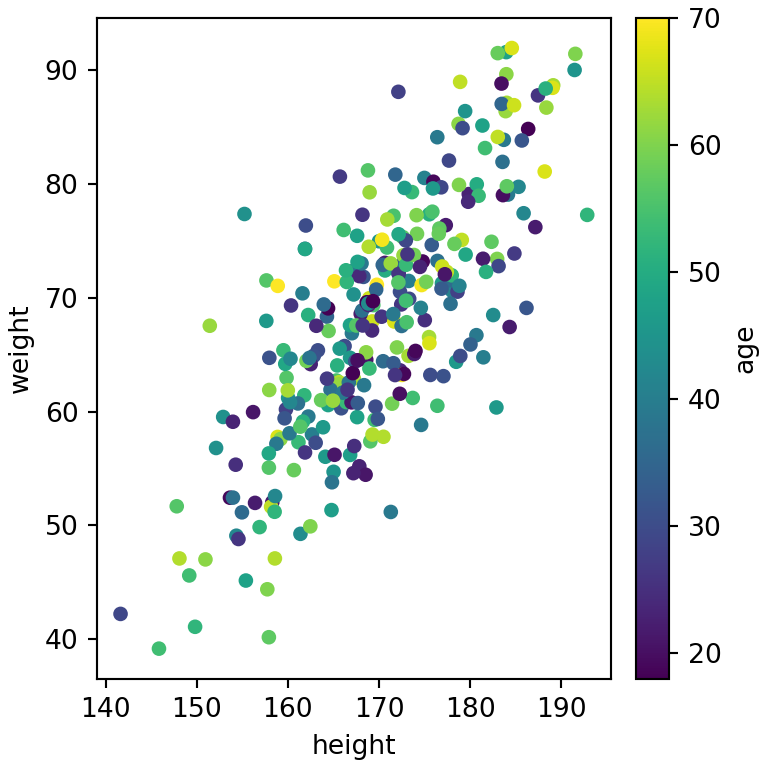
Scatter plot in pandas
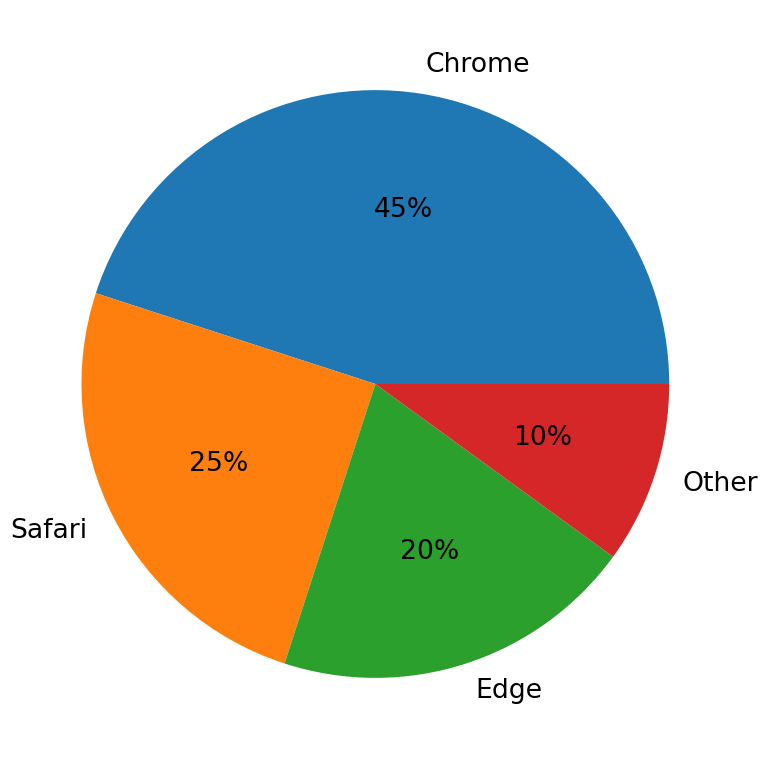
Pie chart in pandas
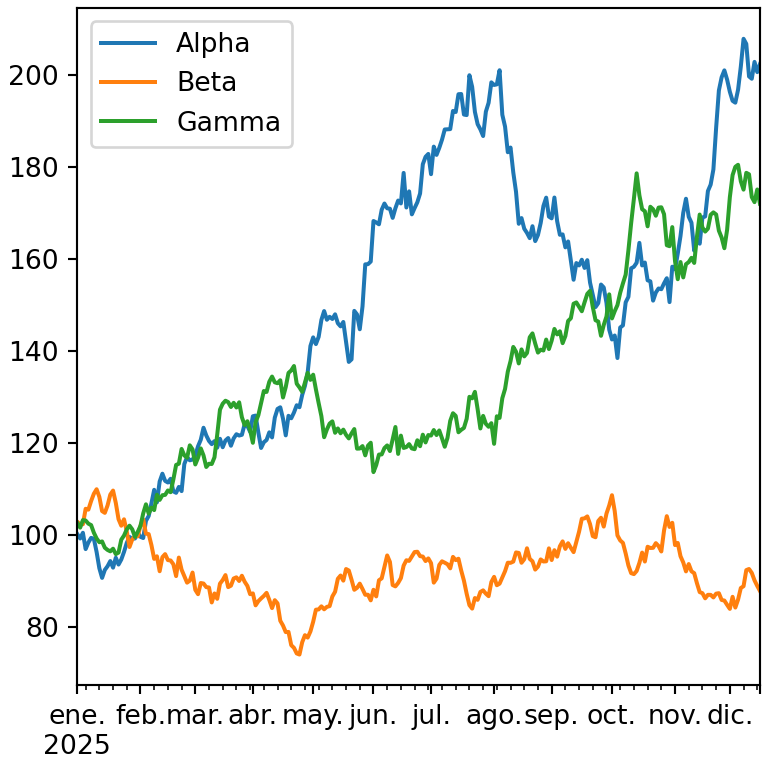
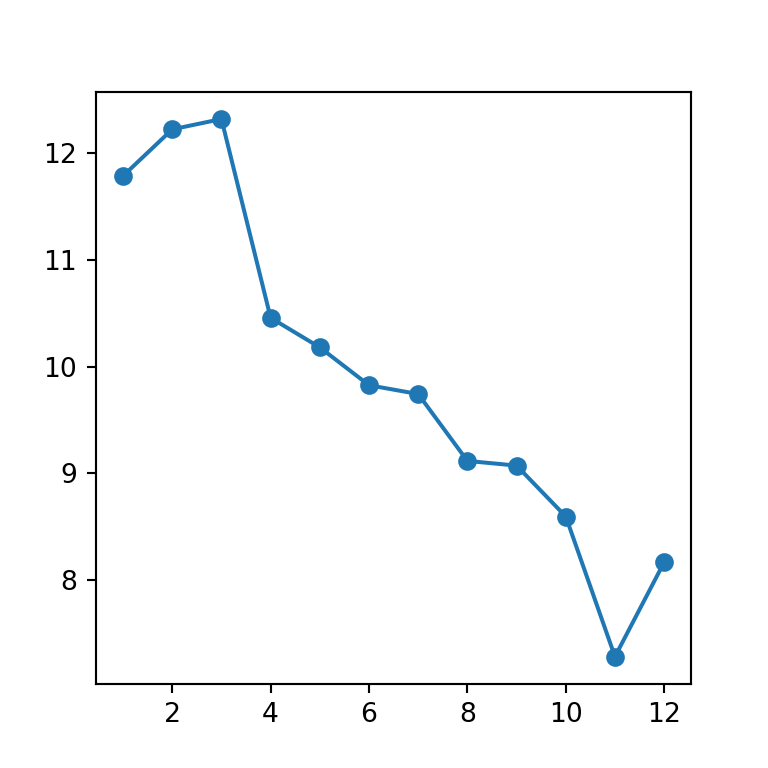
Line chart in pandas
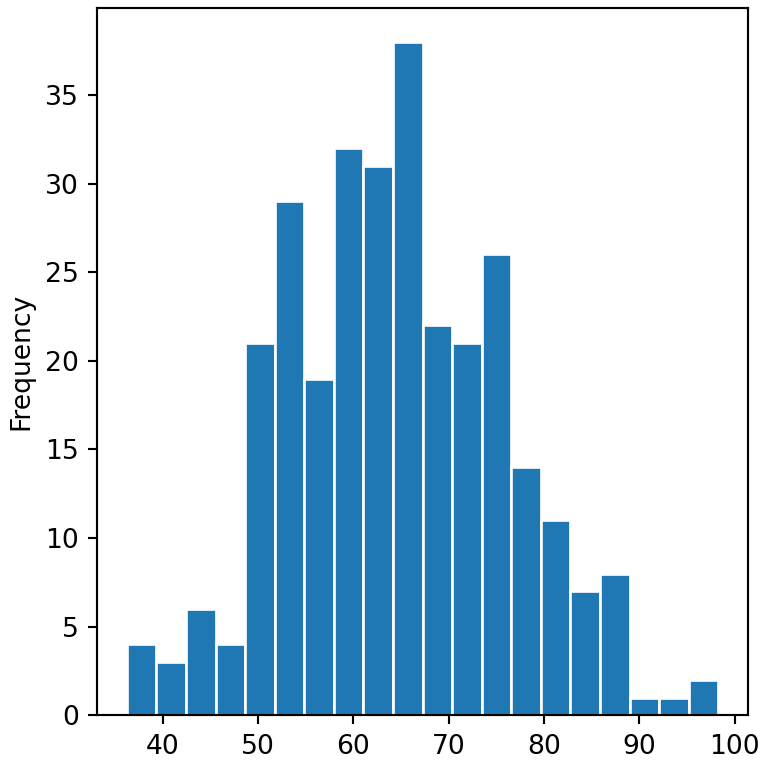
Histogram in pandas
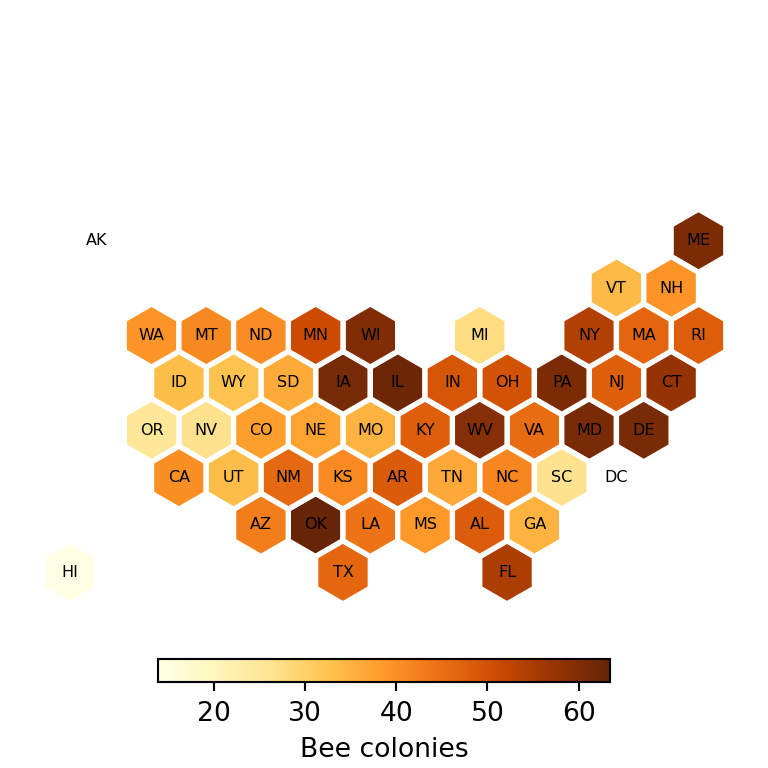
Hexbin map in Python with geopandas
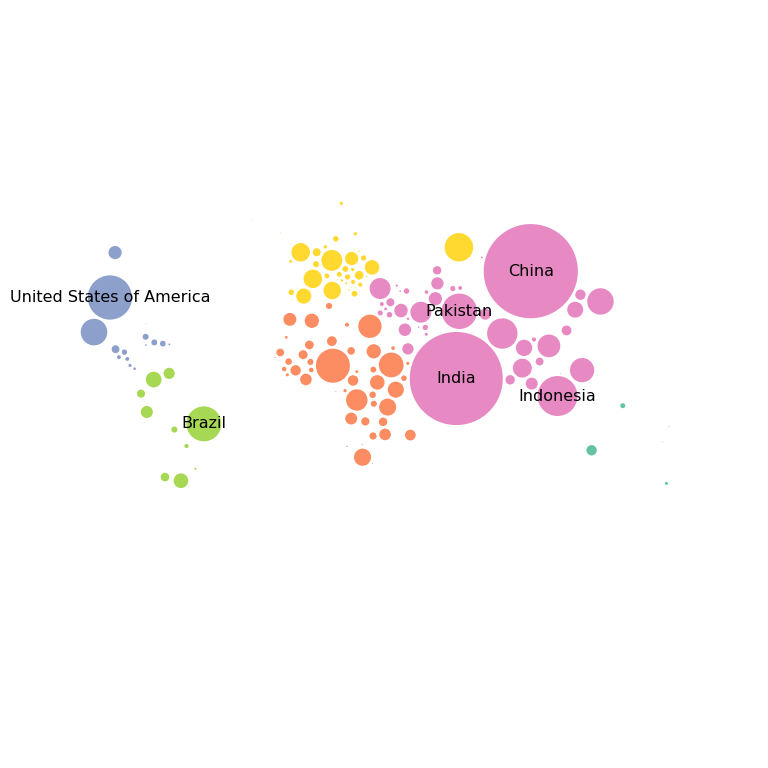
Dorling cartogram in Python with matplotlib
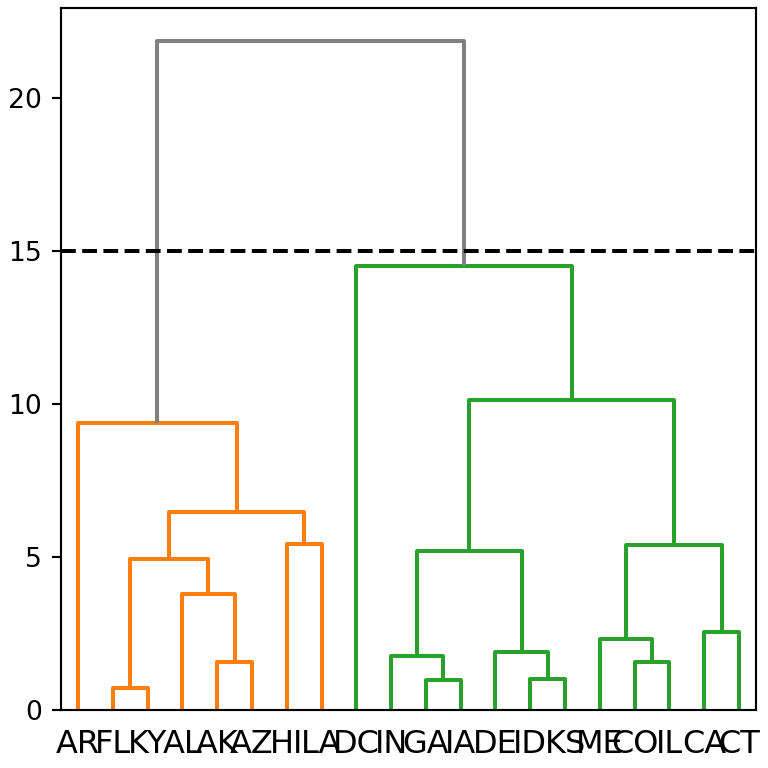
Dendrogram in Python with scipy and matplotlib
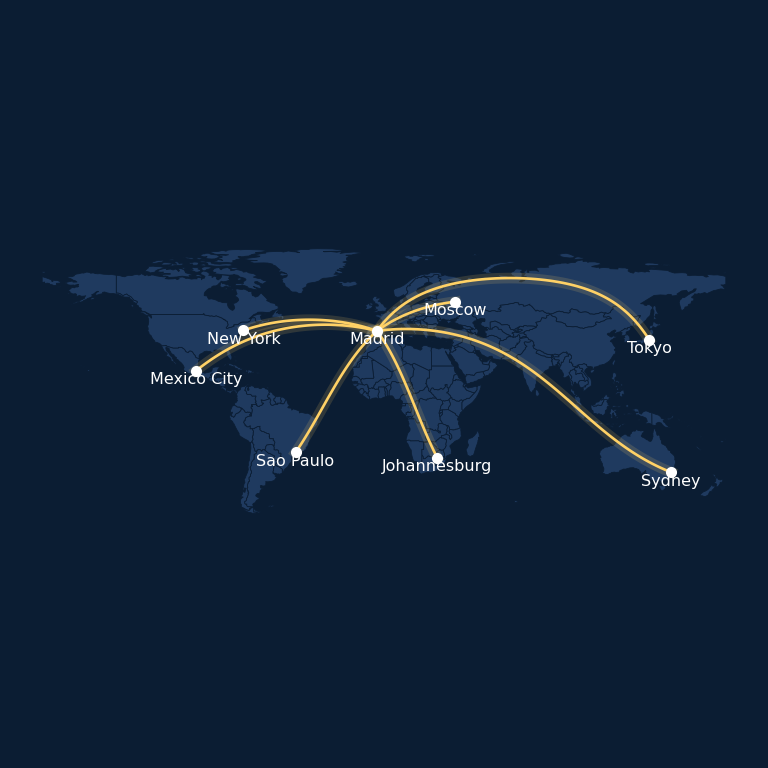
Connection map in Python with matplotlib
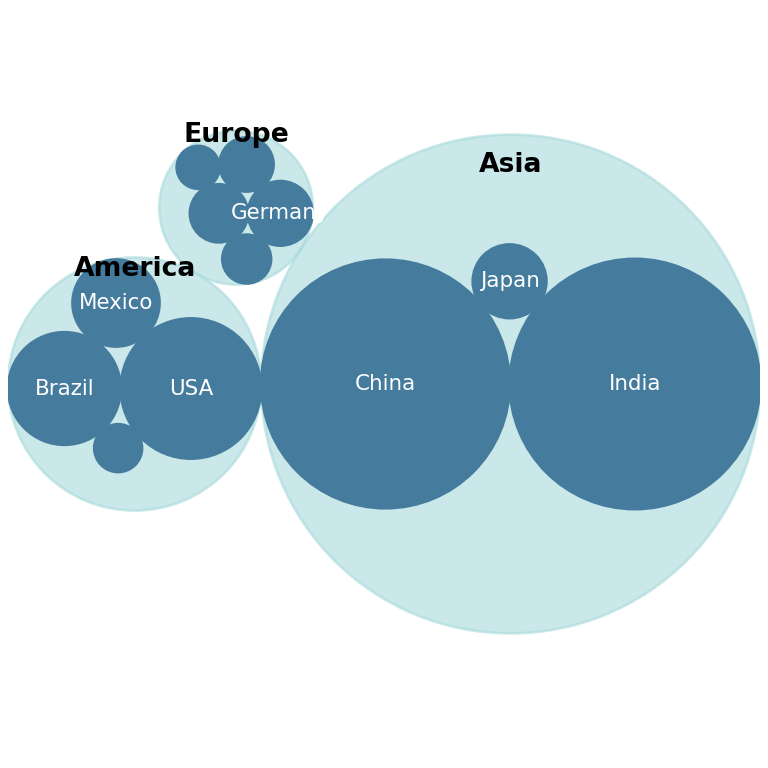
Circular packing in Python with circlify
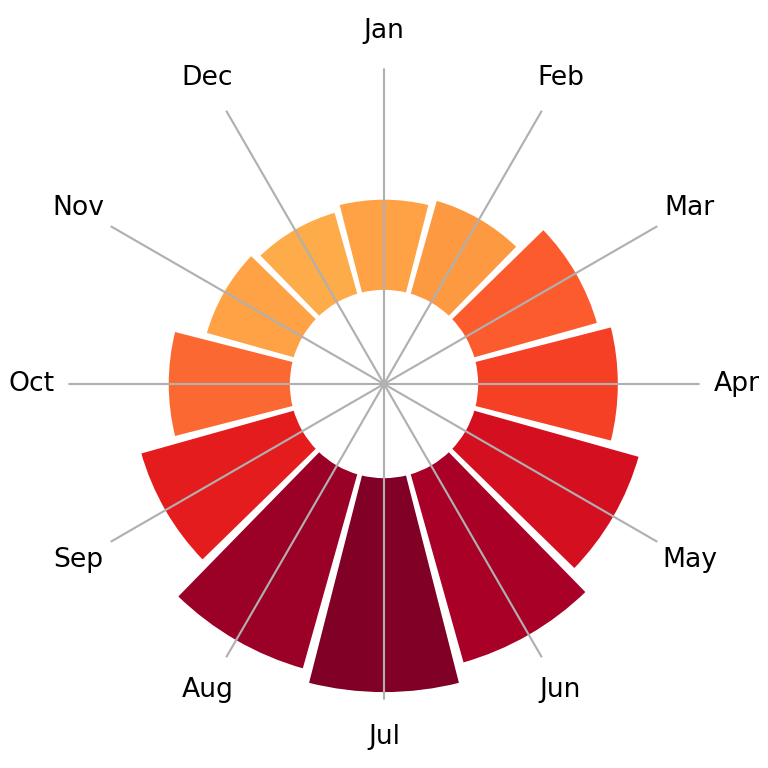
Circular barplot in matplotlib
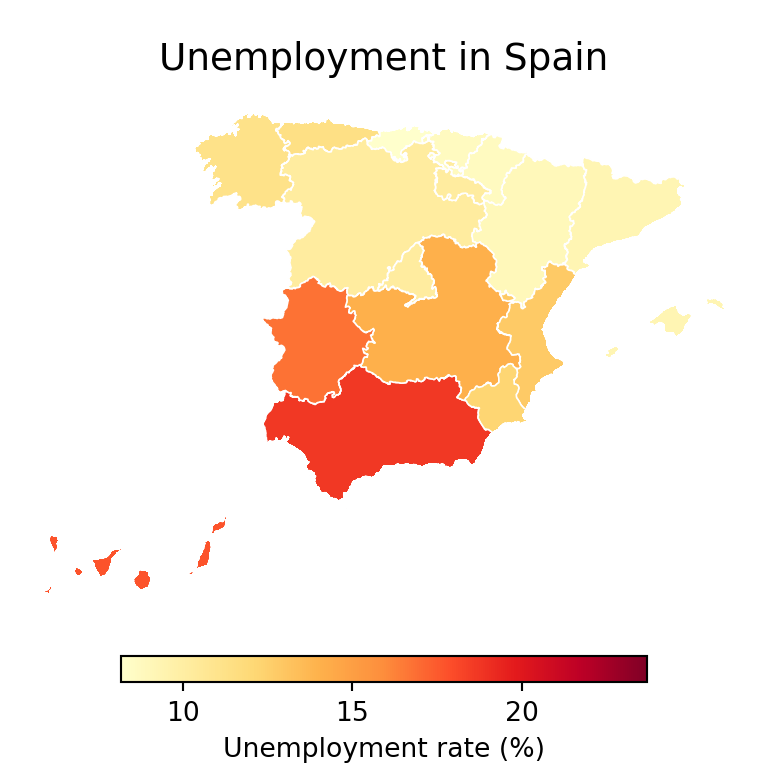
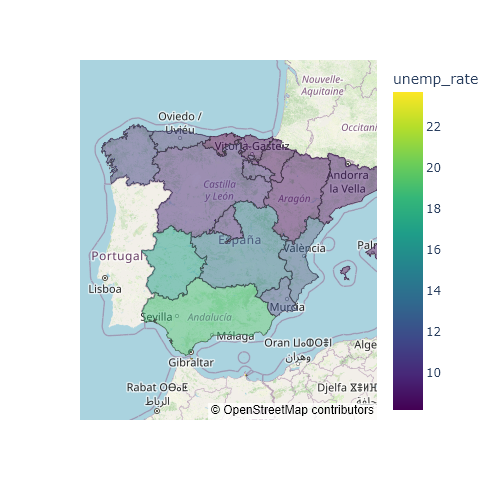
Choropleth map in Python with geopandas
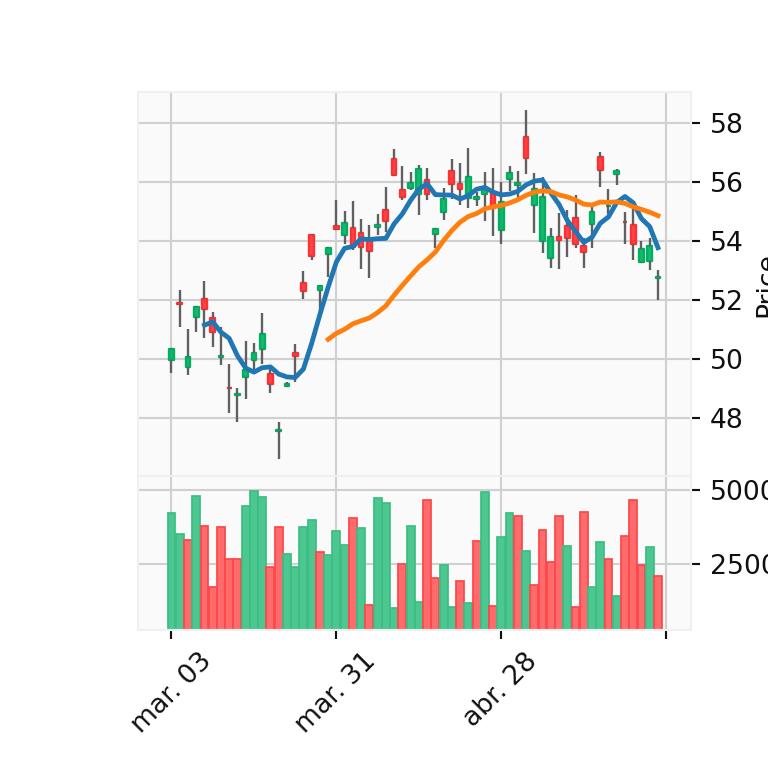
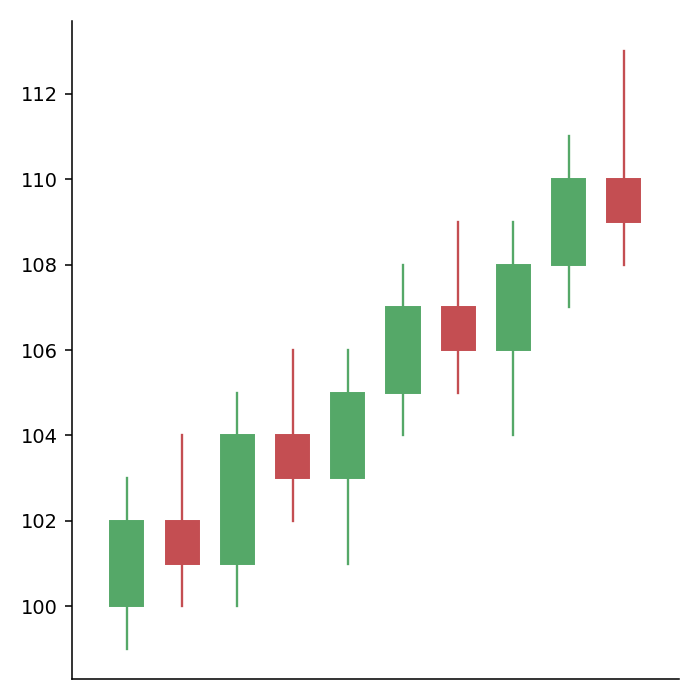
Candlestick chart in Python with mplfinance
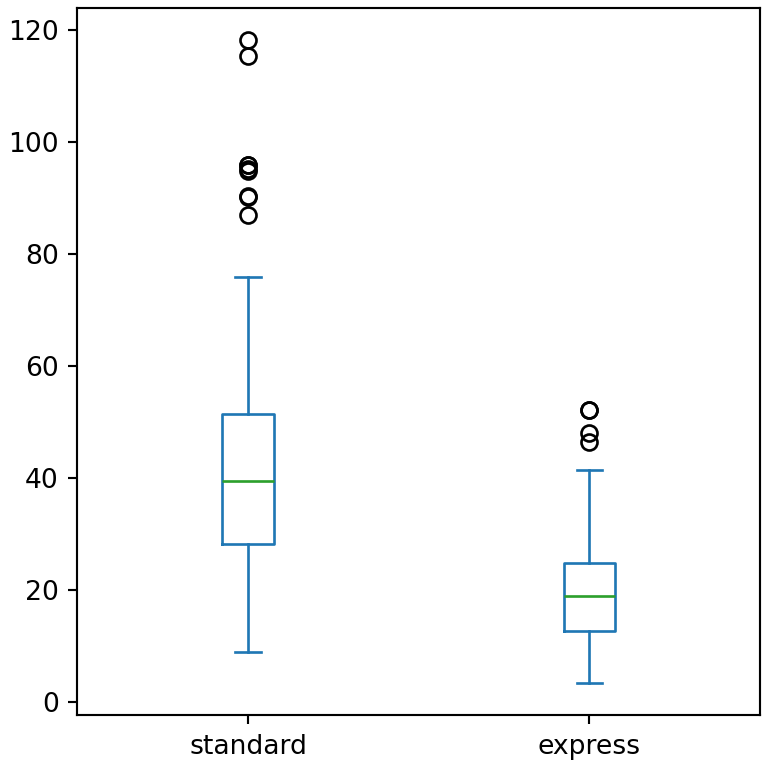
Box plot in pandas
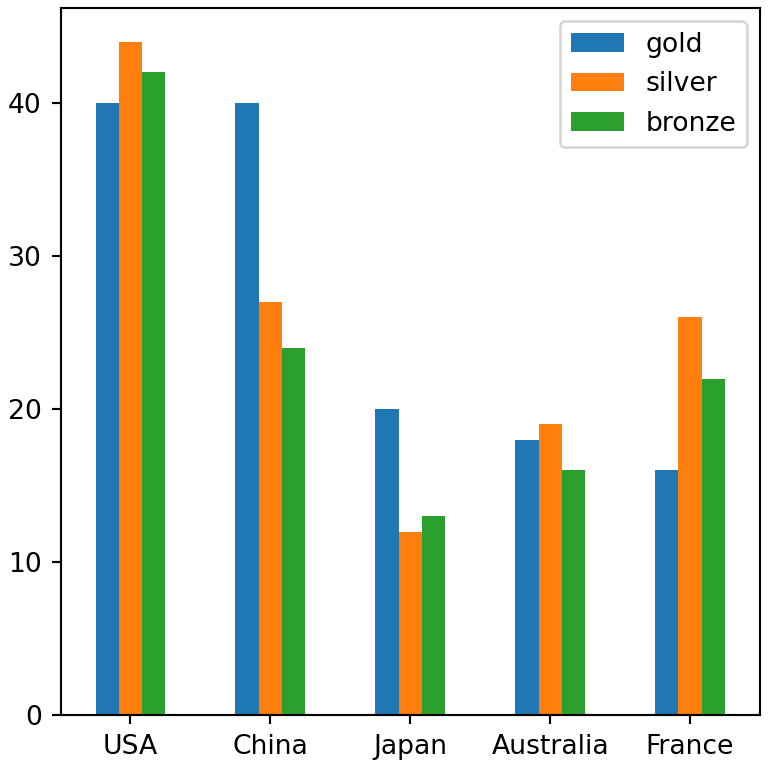
Bar chart in pandas
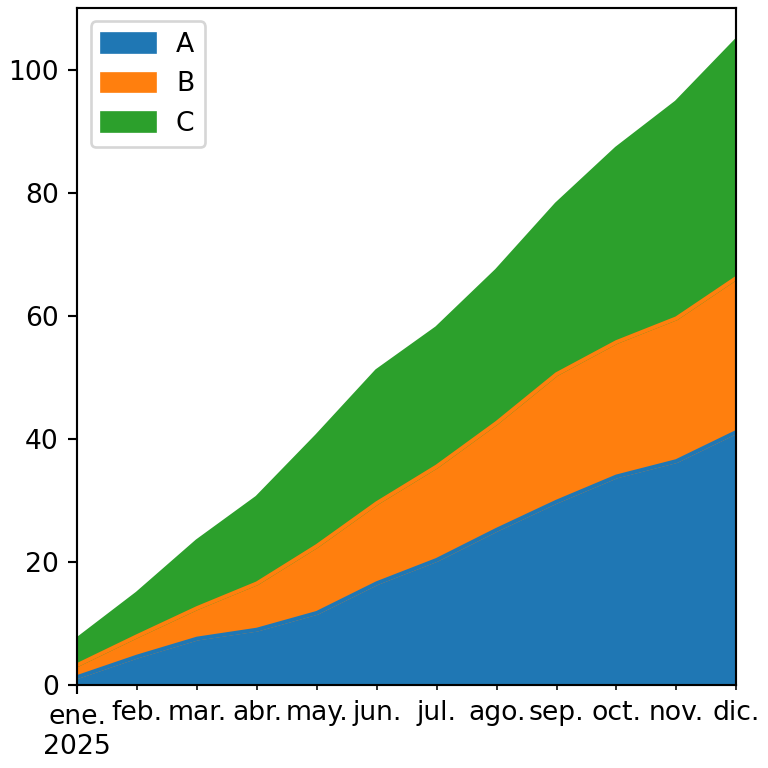
Area chart in pandas
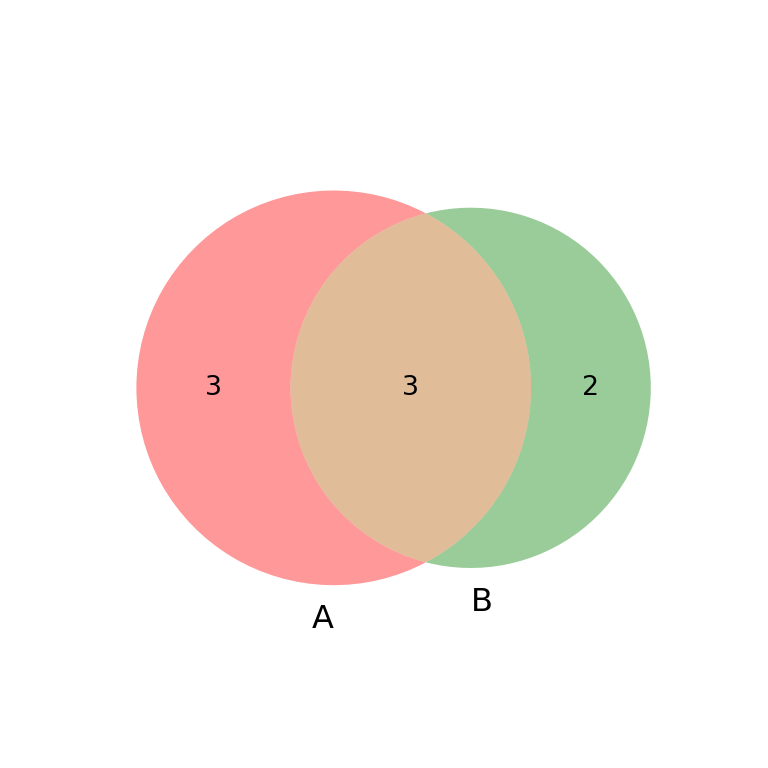
Venn diagram in Python with matplotlib-venn
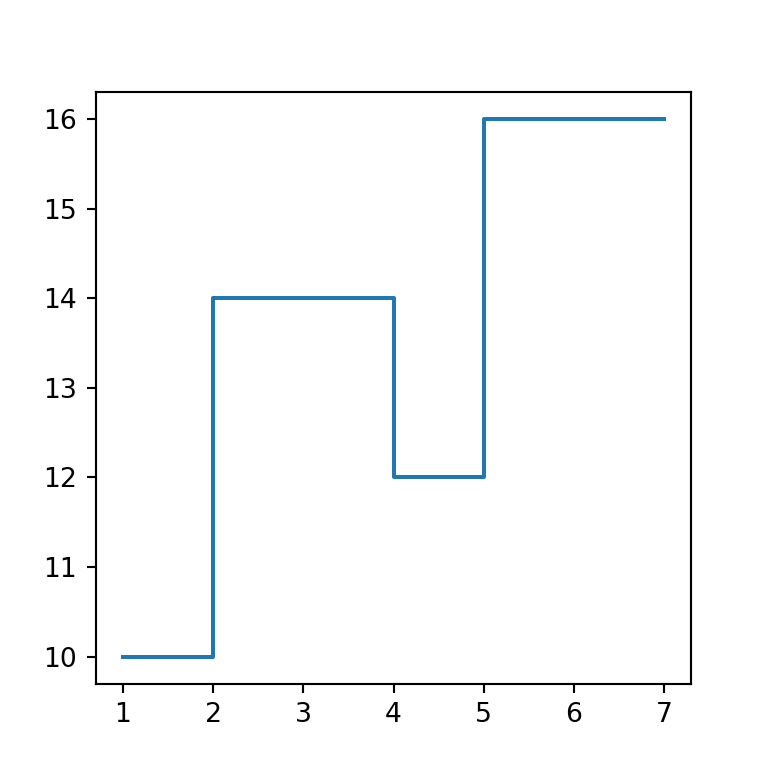
Step plot in matplotlib
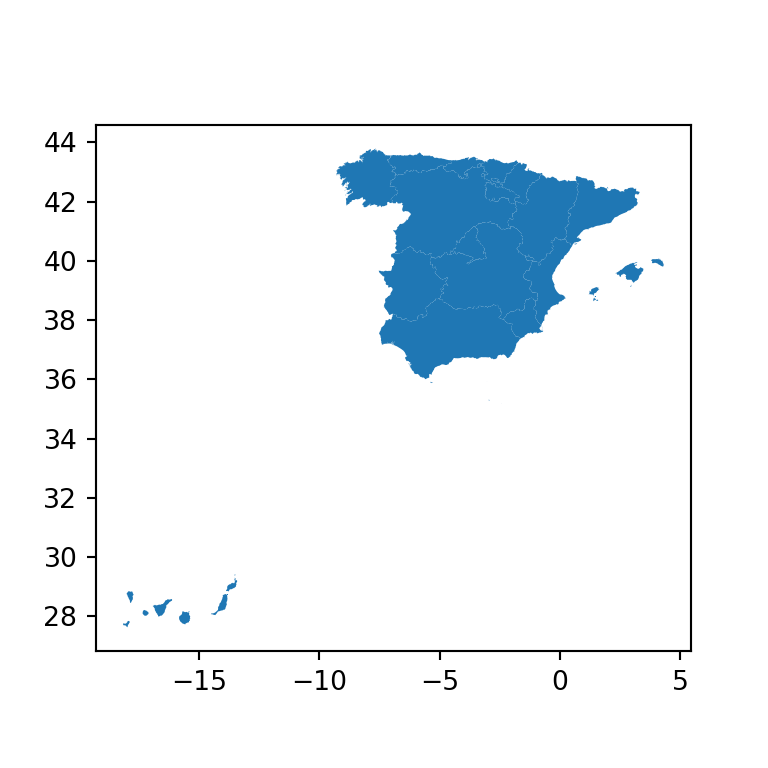
Static map in Python with geopandas
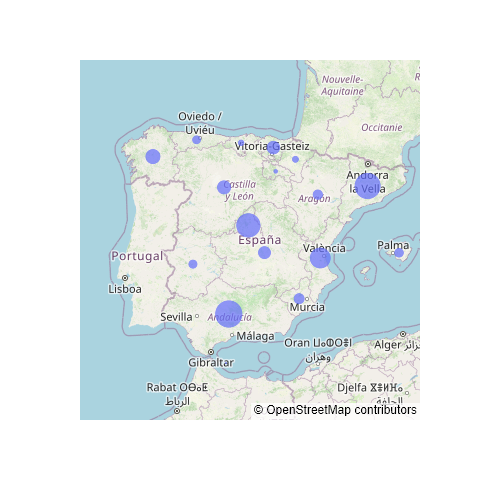
Scatter map in plotly with scatter_geo and scatter_map
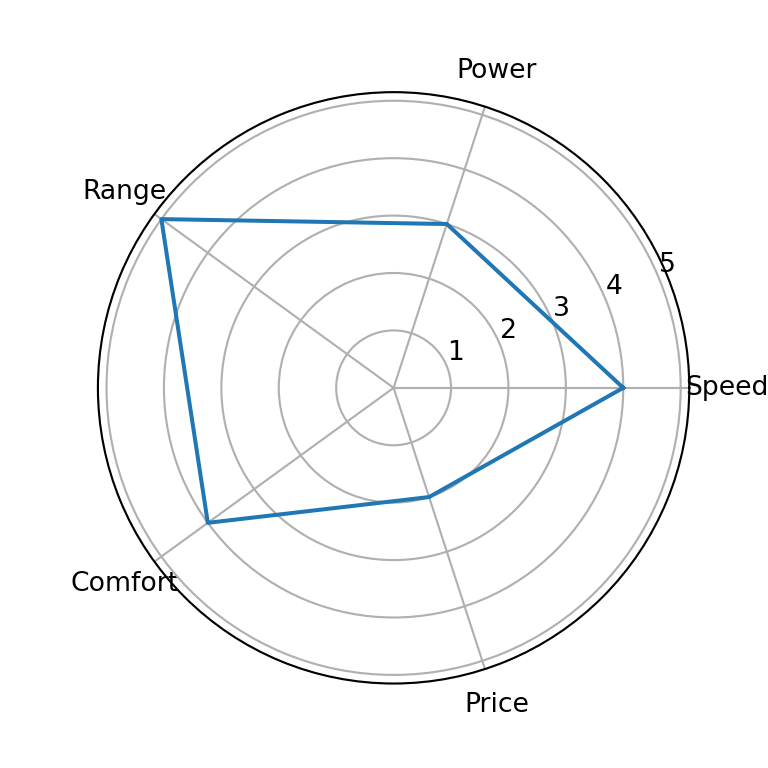
Radar chart in matplotlib
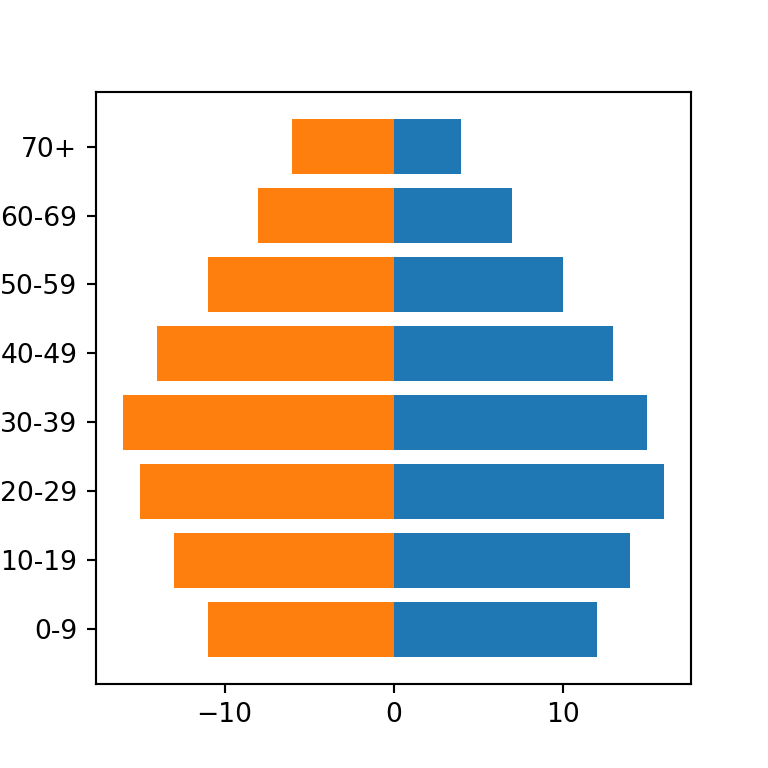
Population pyramid in matplotlib
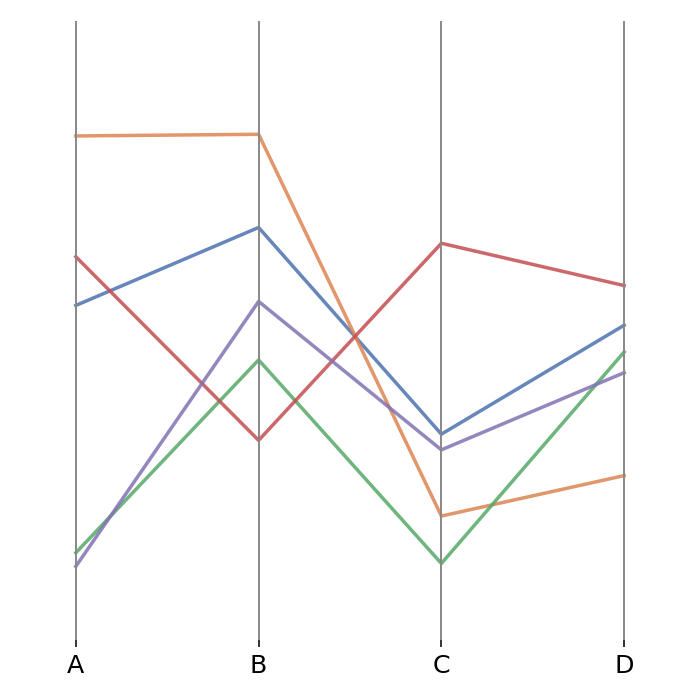
Parallel coordinates plot in plotly
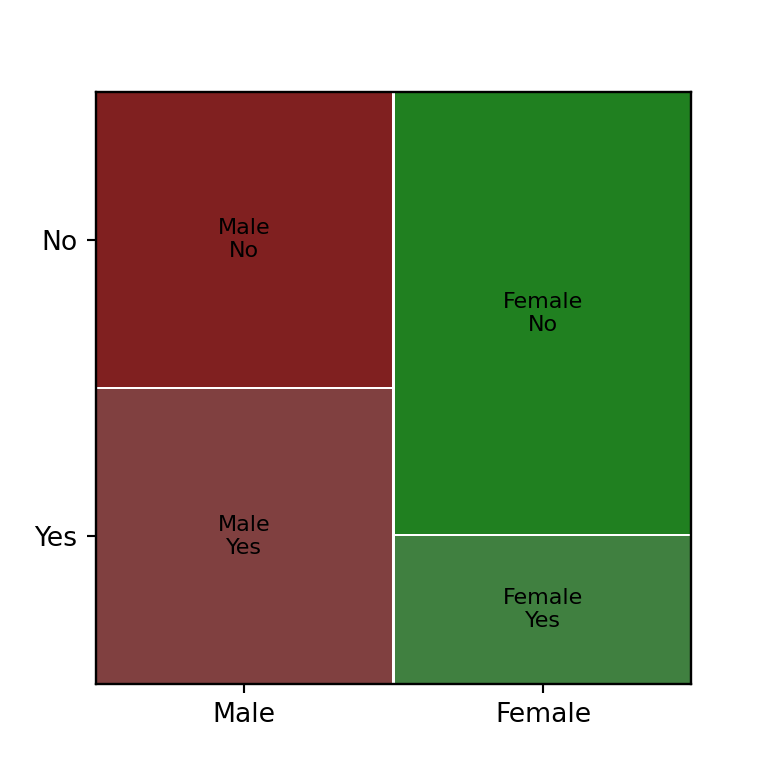
Mosaic plot in Python with statsmodels
Lollipop chart in plotly
Gauge chart in plotly
Donut chart in plotly
Donut chart in matplotlib
Connected scatter plot in matplotlib
Candlestick chart in plotly
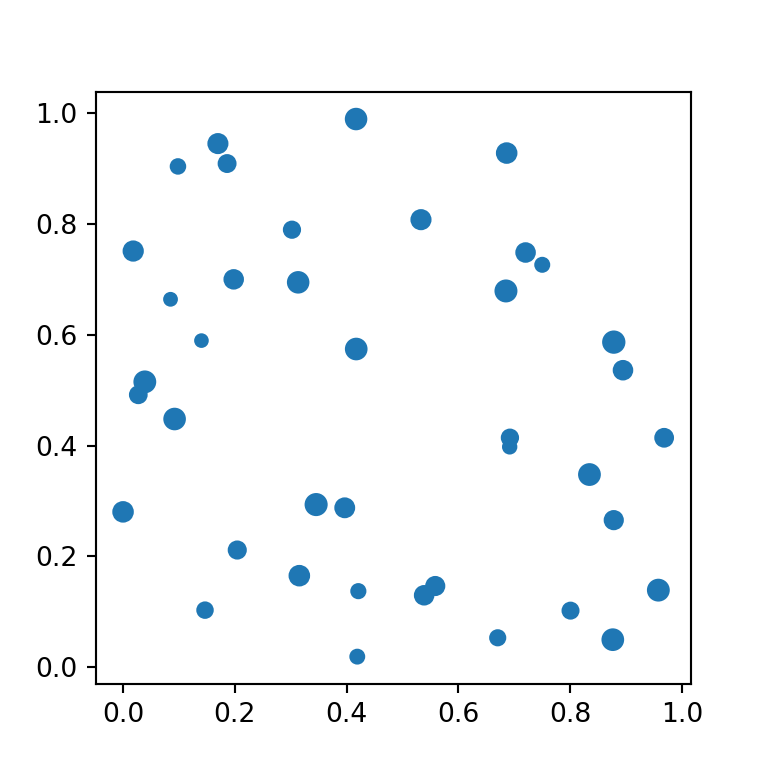
Bubble chart in matplotlib
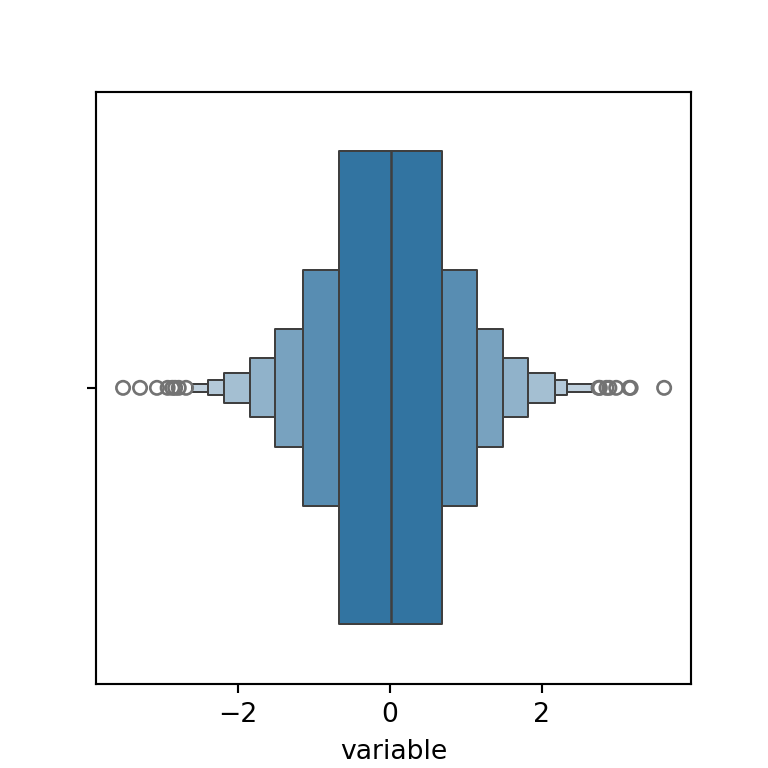
Boxenplot (letter-value plot) in seaborn
Area chart in seaborn
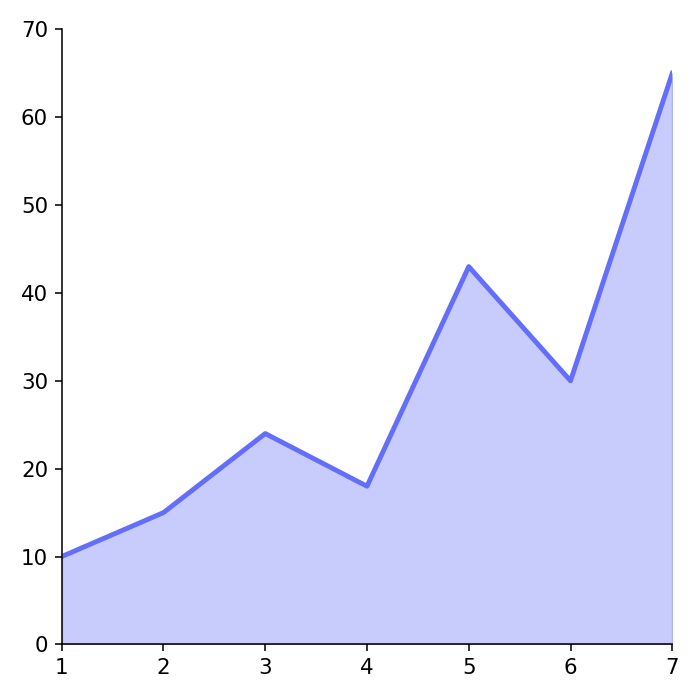
Area chart in plotly
3D surface plot in matplotlib
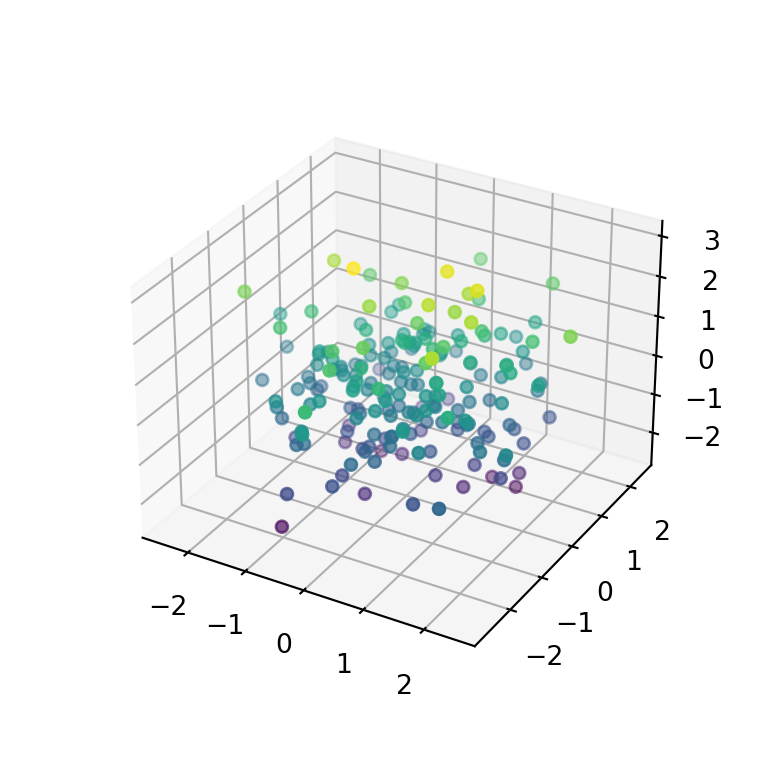
3D scatter plot in matplotlib
Calendar heatmap in matplotlib with calplot
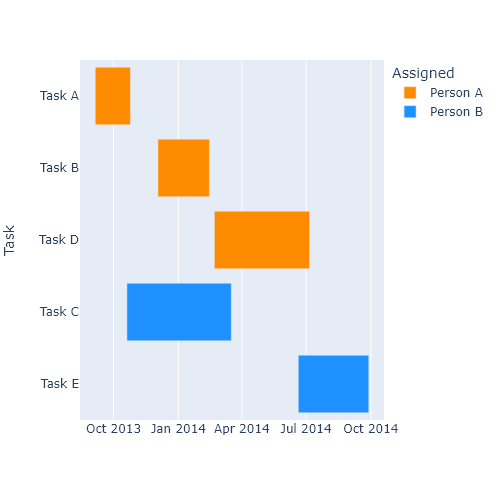
Gantt chart in plotly
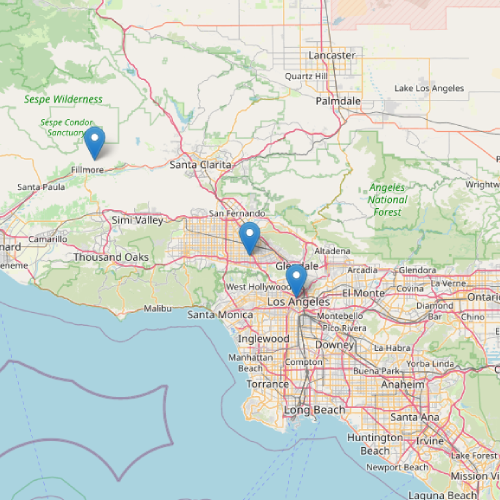
Interactive leaflet maps in Python with folium
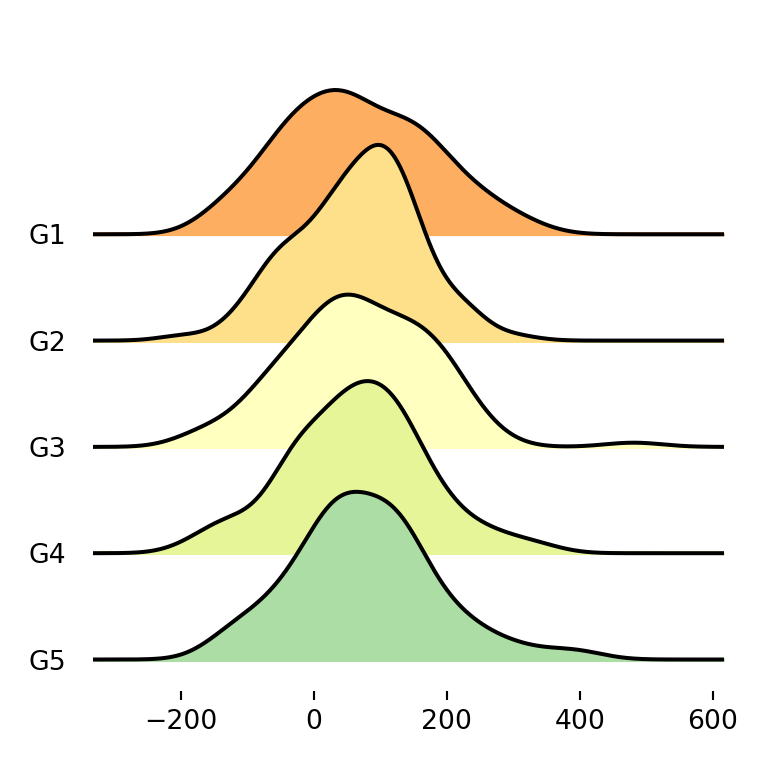
Ridgeline plots (joy plots) in matplotlib with joypy
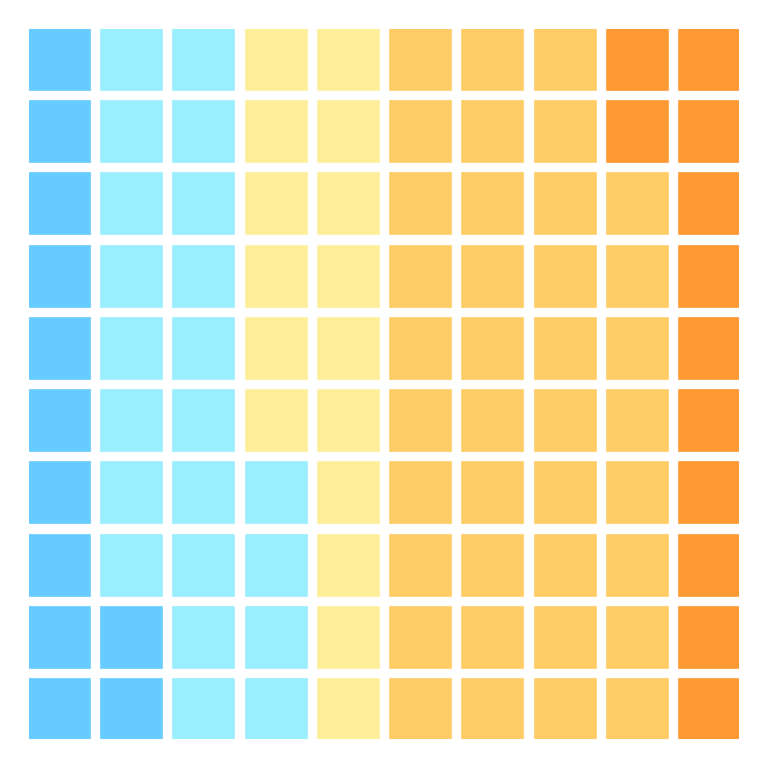
Waffle charts (square pie) in matplotlib with pywaffle
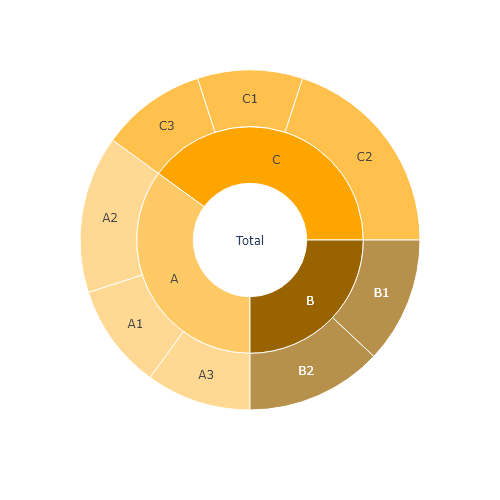
Sunburst charts in plotly
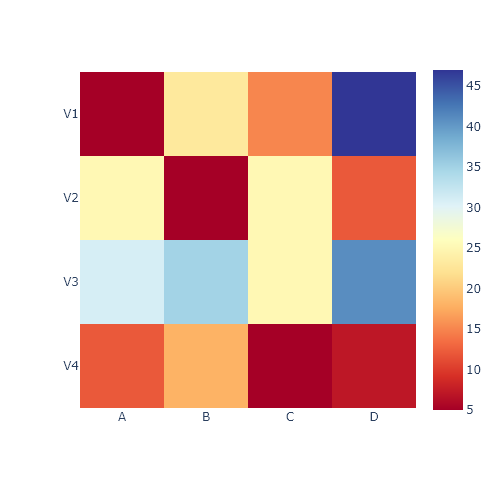
Heatmaps in plotly with imshow
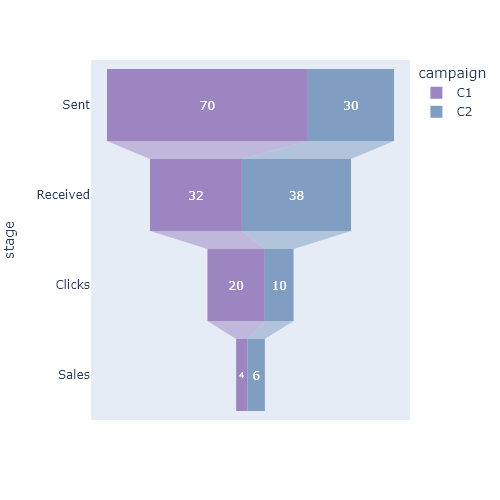
Funnel charts in plotly
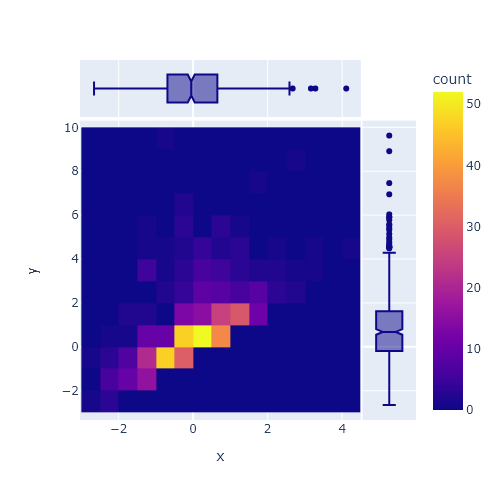
2D histograms in plotly
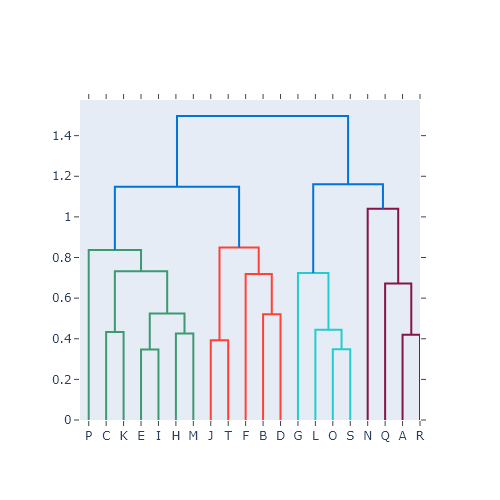
Dendrogram in plotly
Choropleth maps in plotly
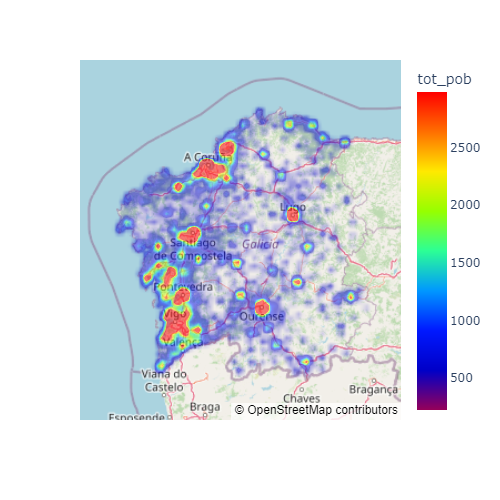
Heat map on a map (spatial heat map) in plotly
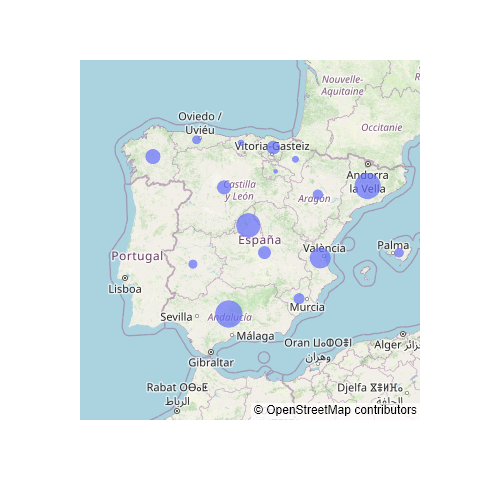
Bubble map in plotly
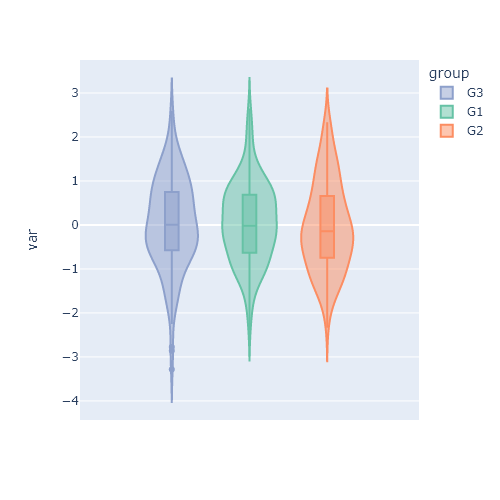
Violin plots in plotly
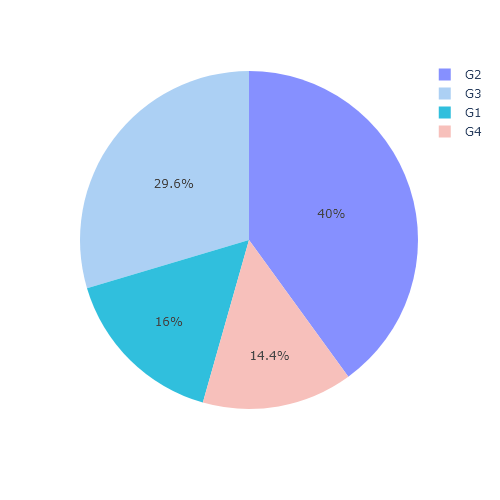
Pie charts in plotly
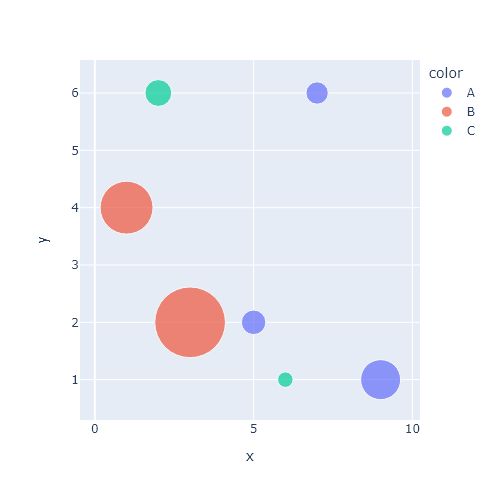
Bubble chart in plotly
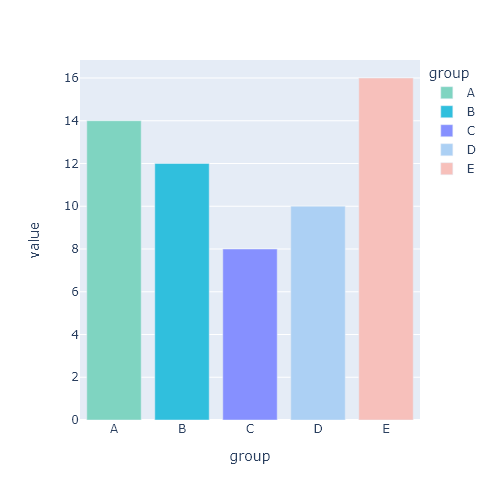
Bar chart in plotly
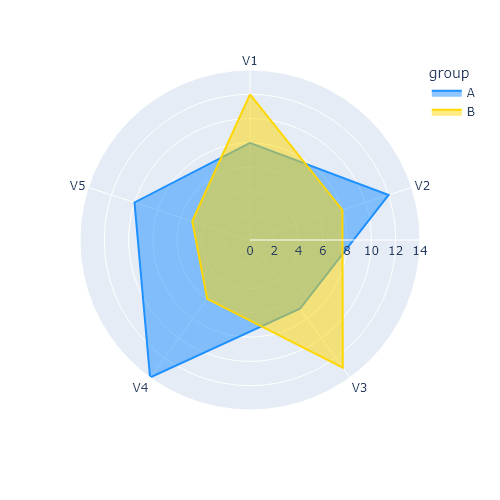
Radar chart in plotly
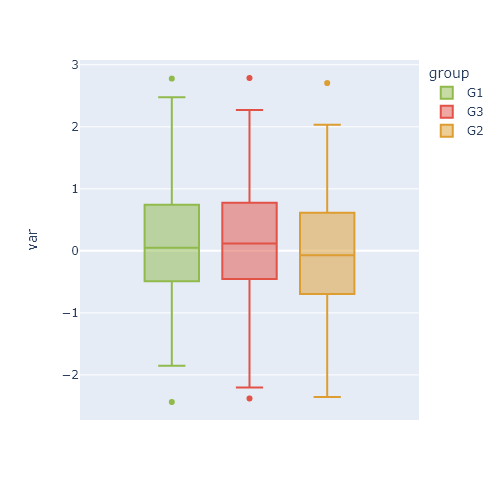
Box plot in plotly
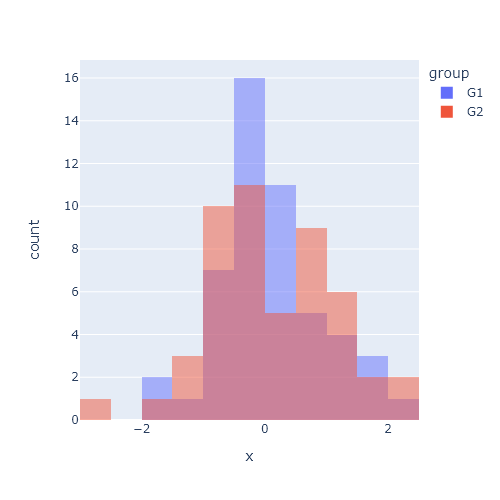
Histograms in plotly
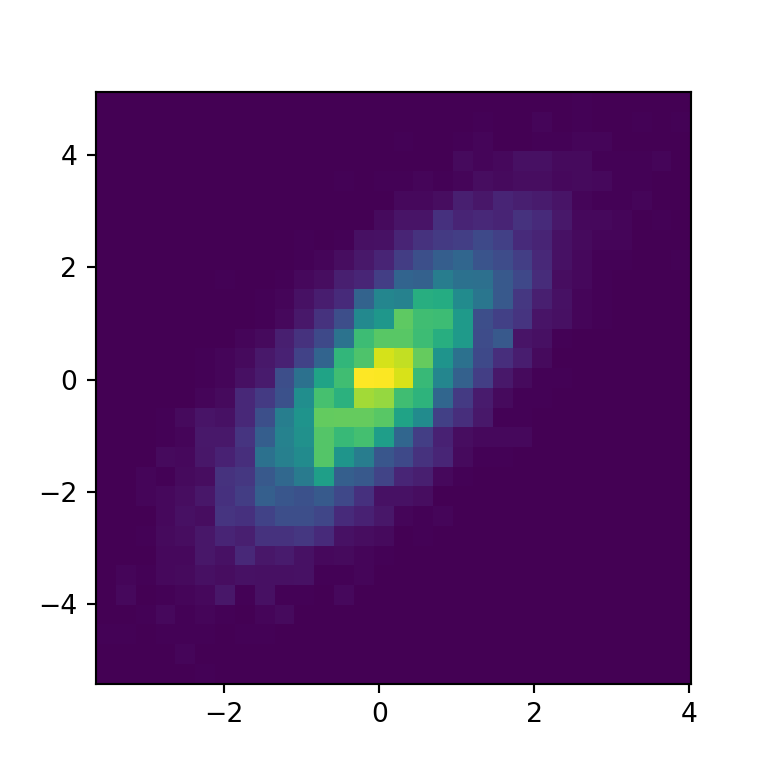
2D histogram in matplotlib
Line chart in plotly
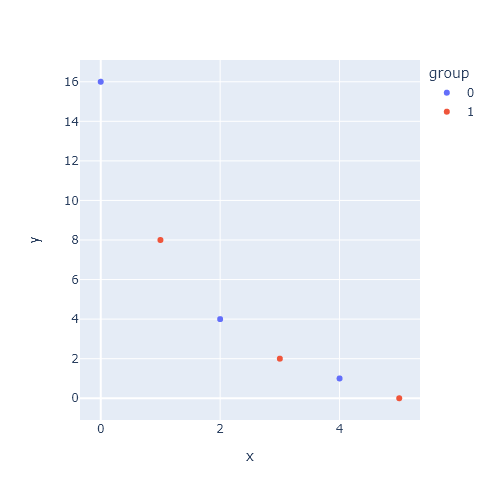
Scatter plot in plotly
Wordclouds in Python
Treemaps in matplotlib with squarify
Stacked area plot in matplotlib with stackplot
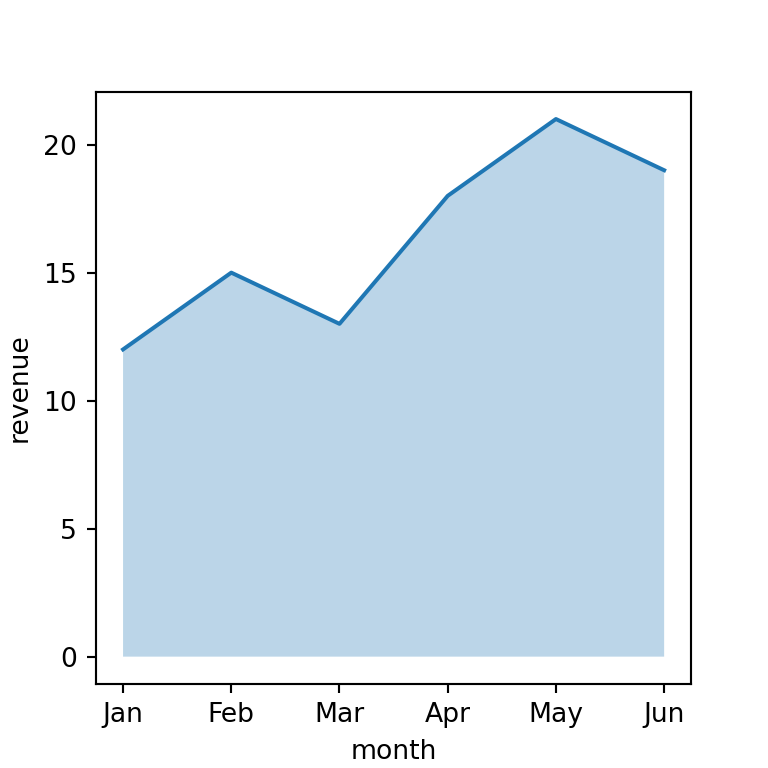
Area plot in matplotlib with fill_between
Stem plot (lollipop chart) in matplotlib
Stacked bar chart in matplotlib
Violin plot in matplotlib
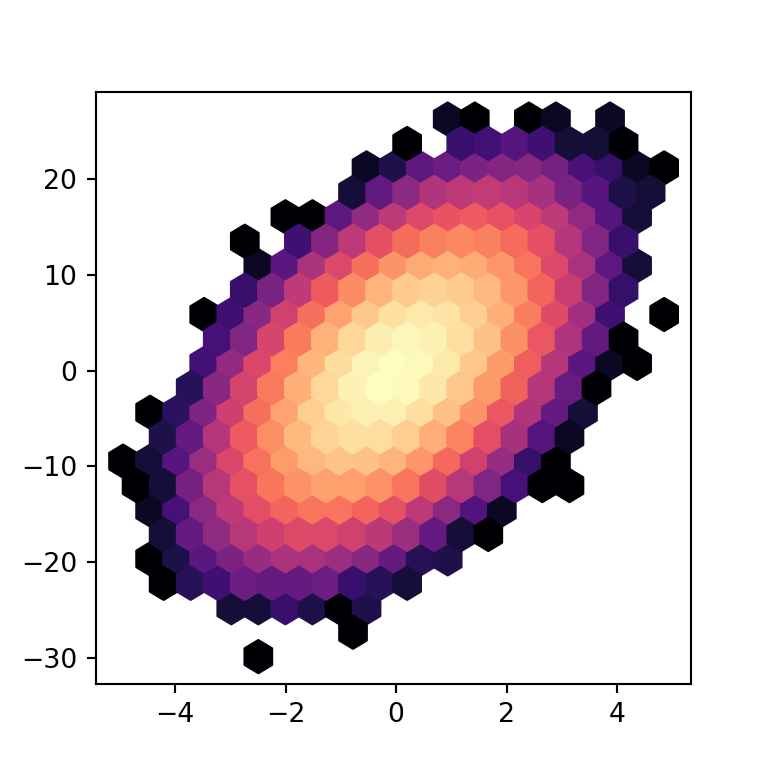
Hexbin chart in matplotlib
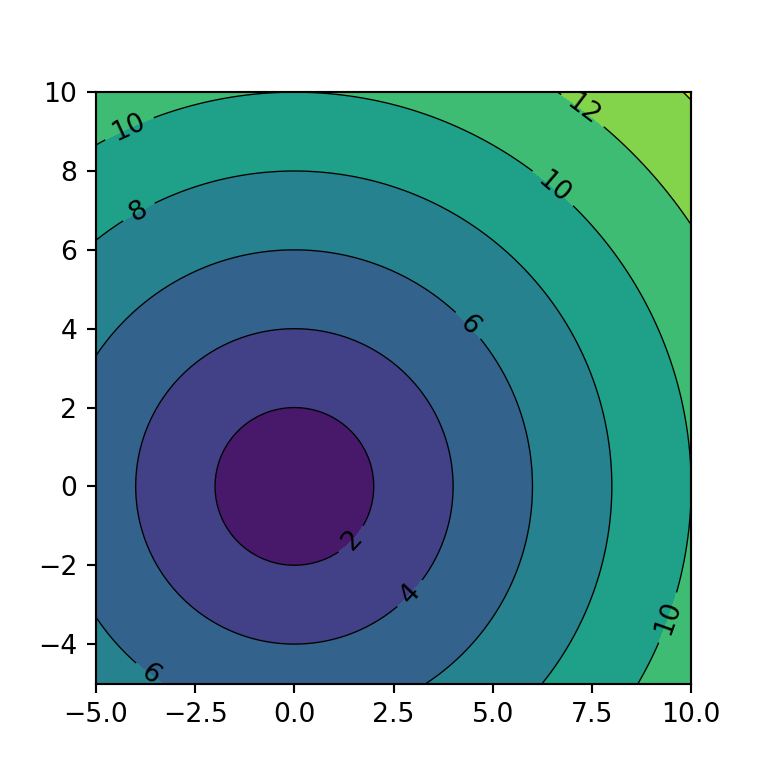
Contour in matplotlib
Line plot in matplotlib
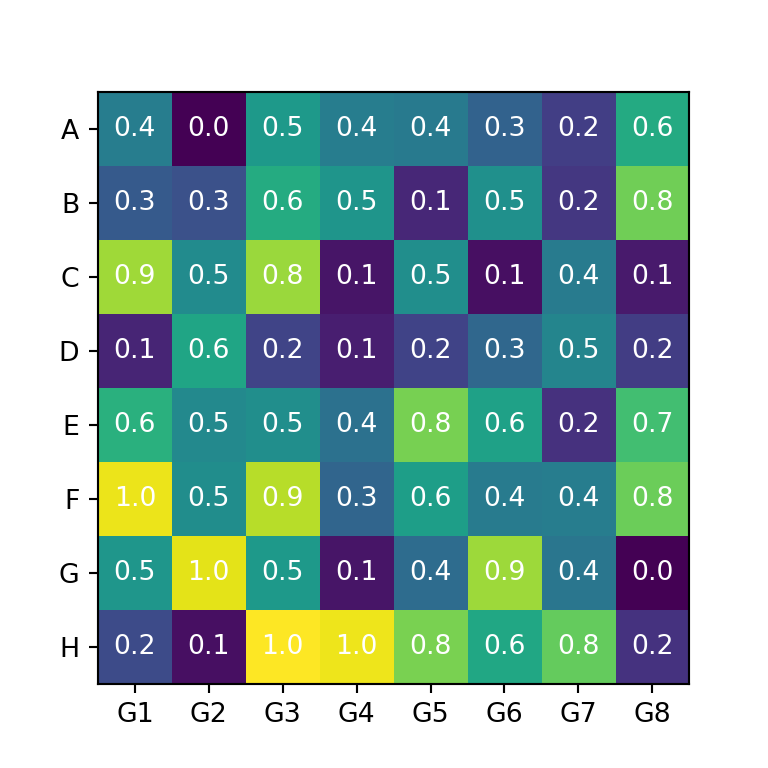
Heat map in matplotlib
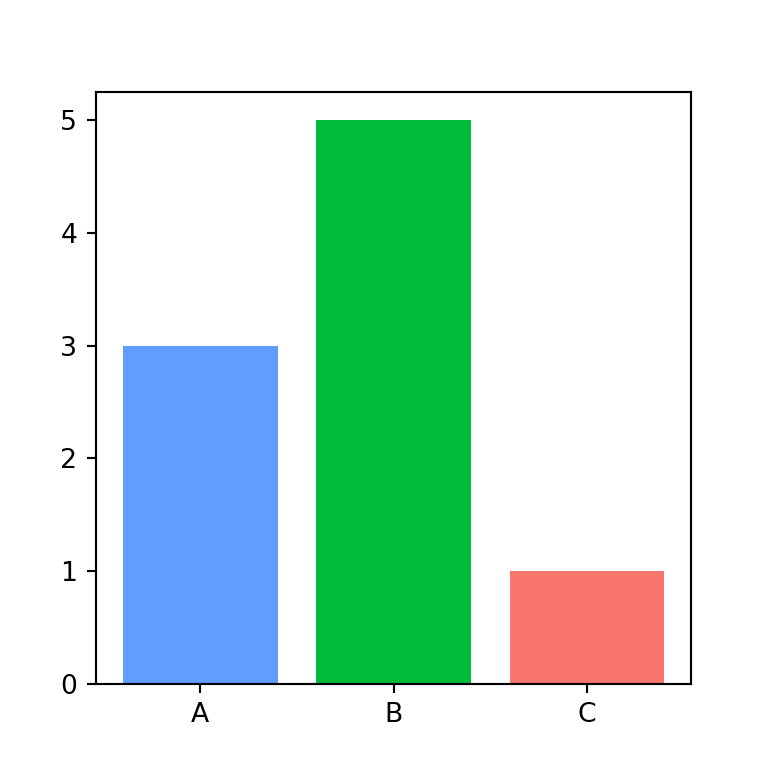
Bar plot in matplotlib
Pie chart in matplotlib
Histogram in matplotlib
Scatter plot in matplotlib
Box plot in matplotlib
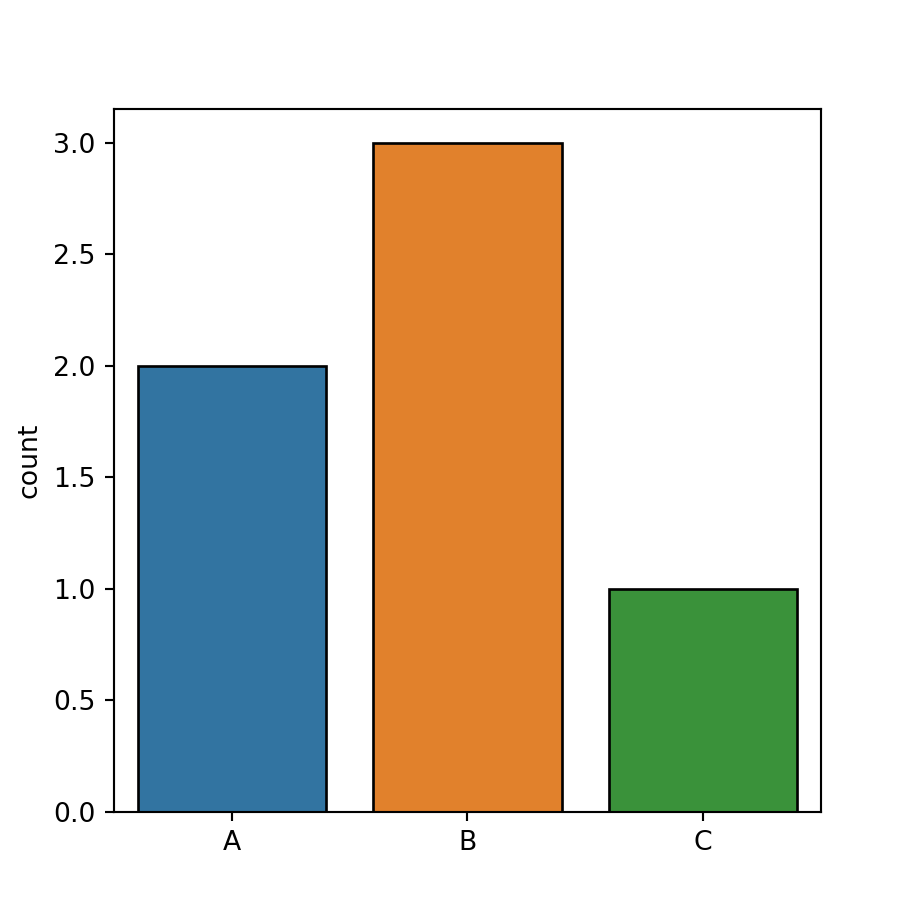
Count plot in seaborn
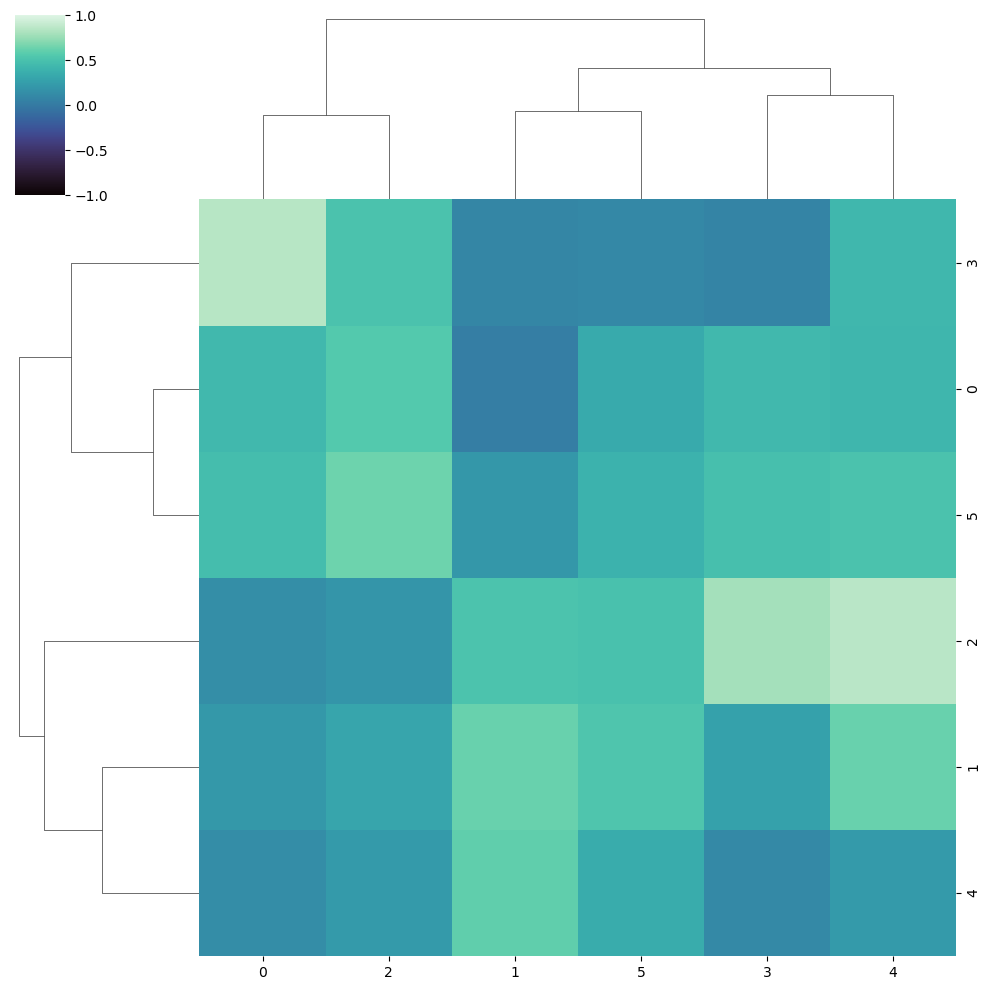
Heatmap clustering in seaborn with clustermap
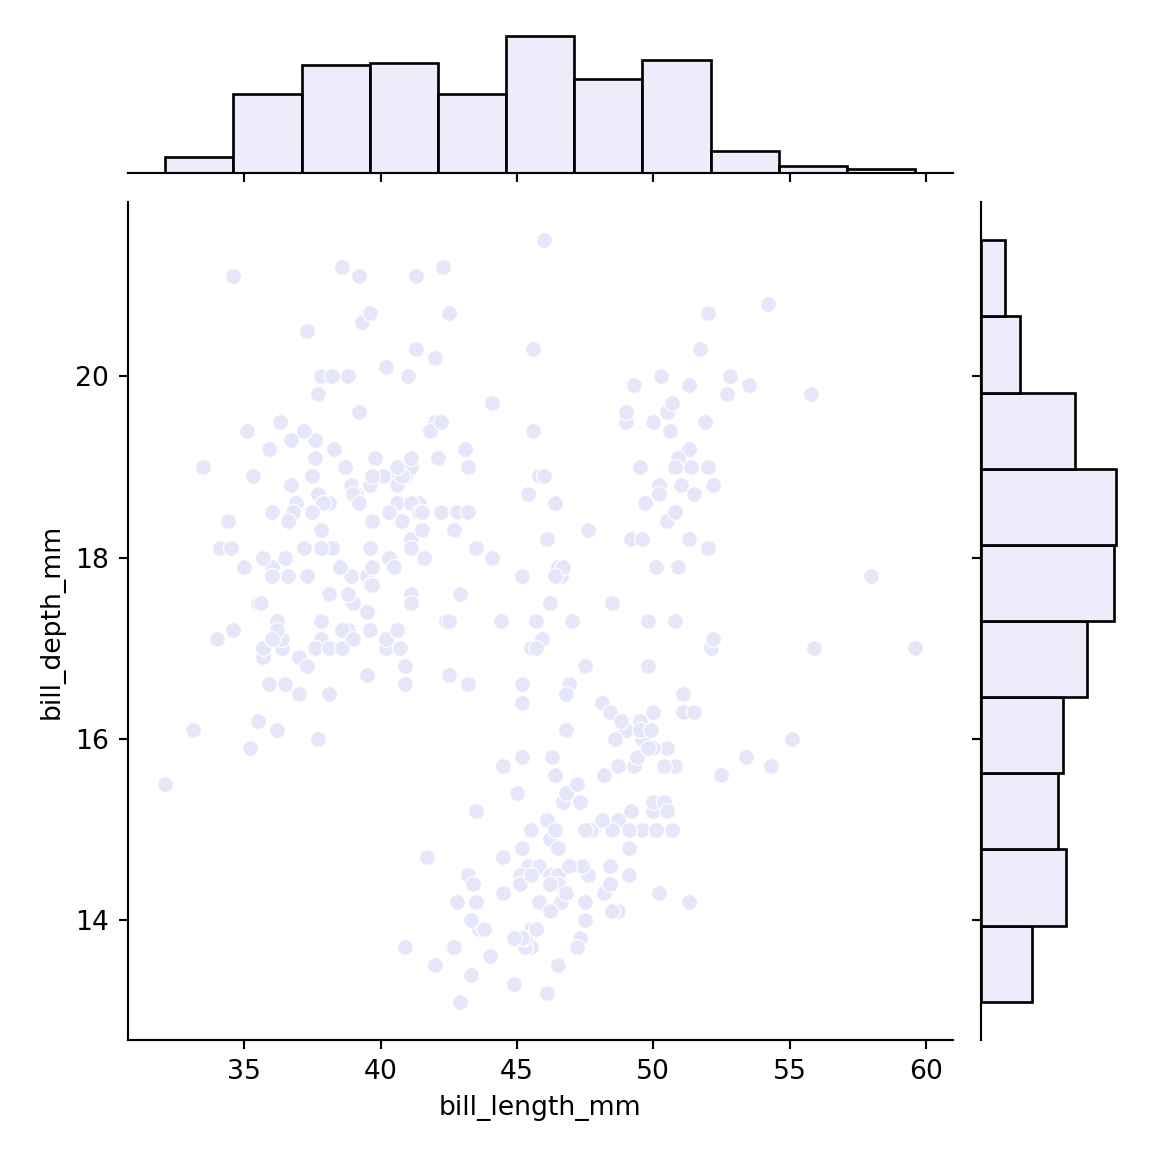
Scatter plot with marginal histograms in seaborn
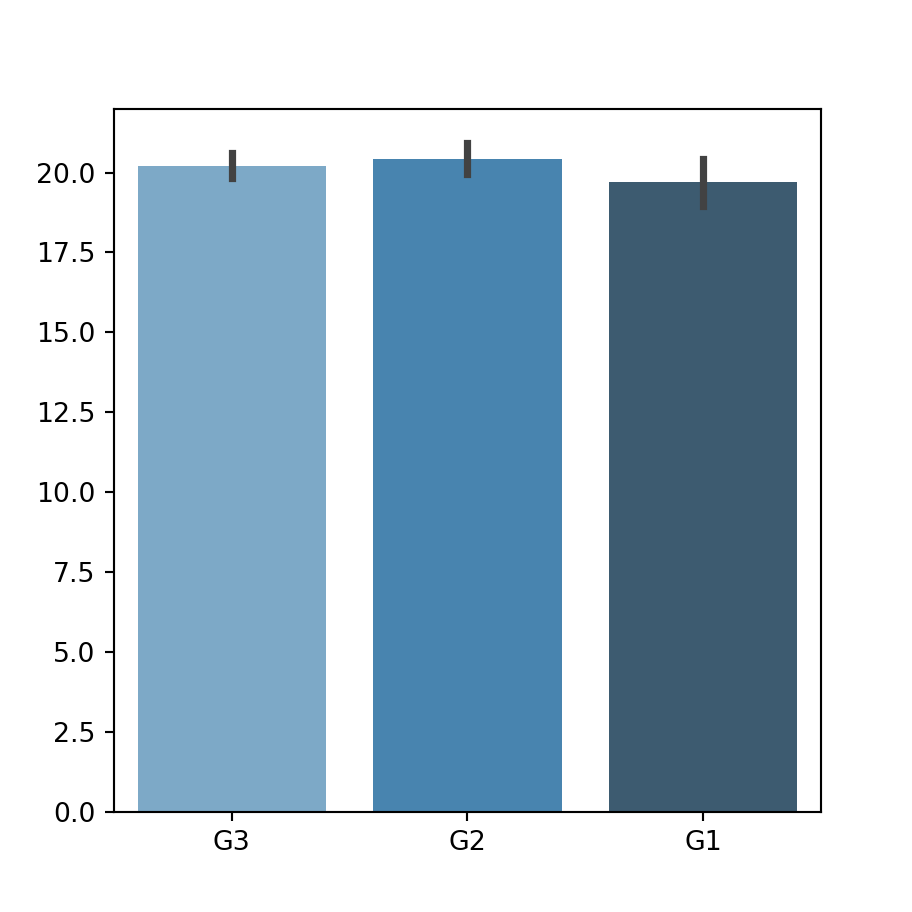
Bar plot in seaborn
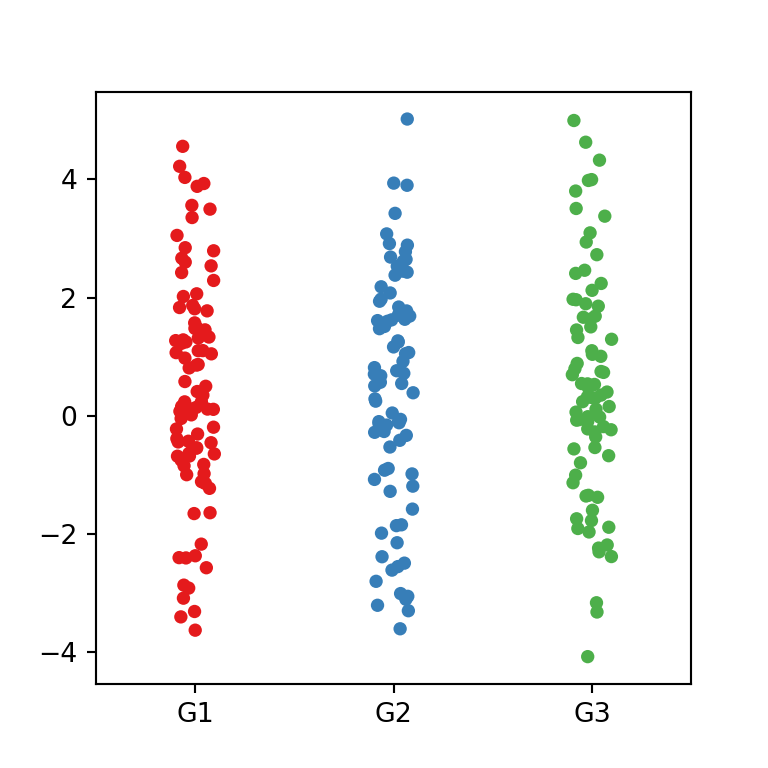
Strip plot in seaborn
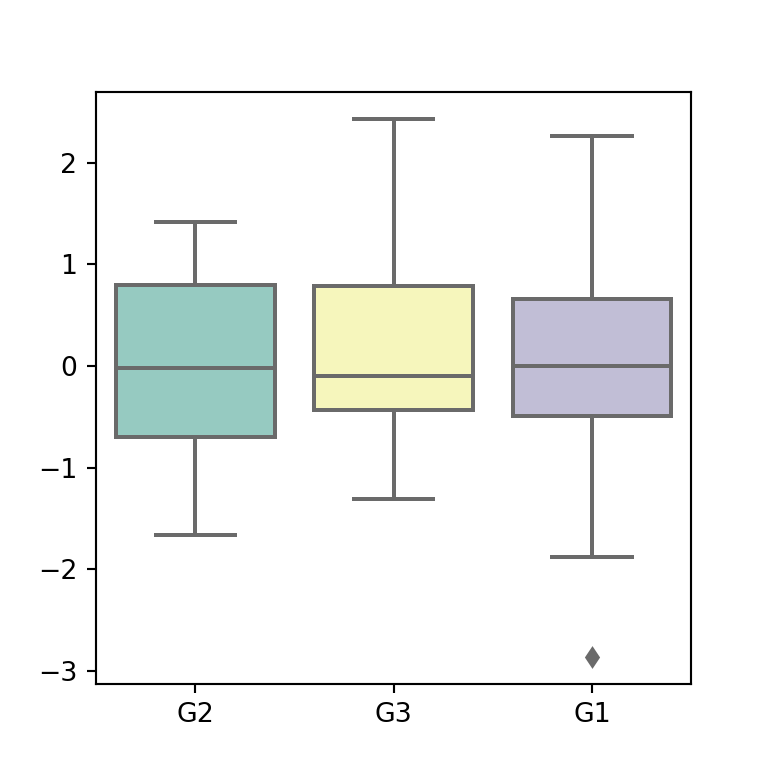
Box plot in seaborn
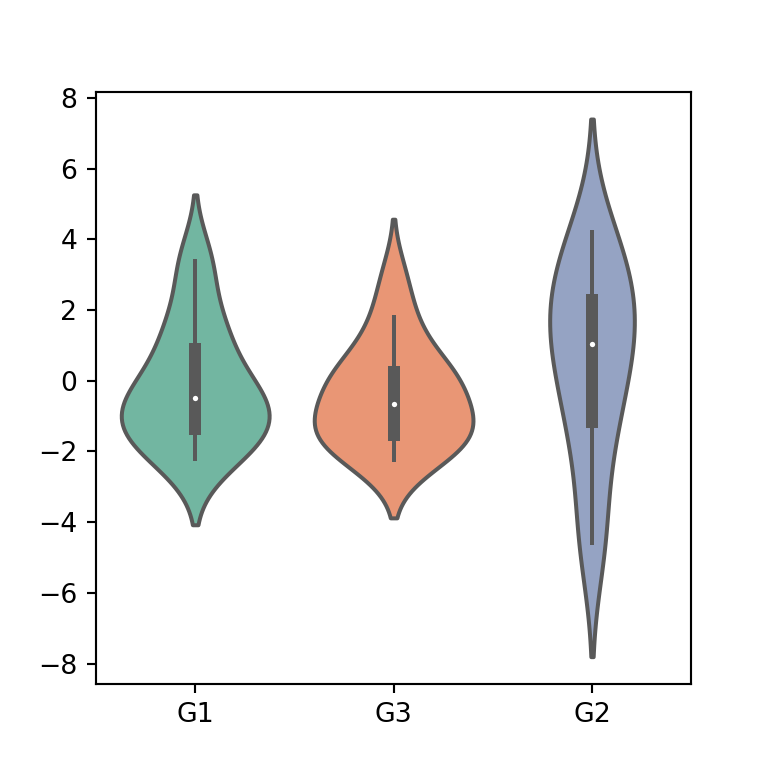
Violin plot in seaborn
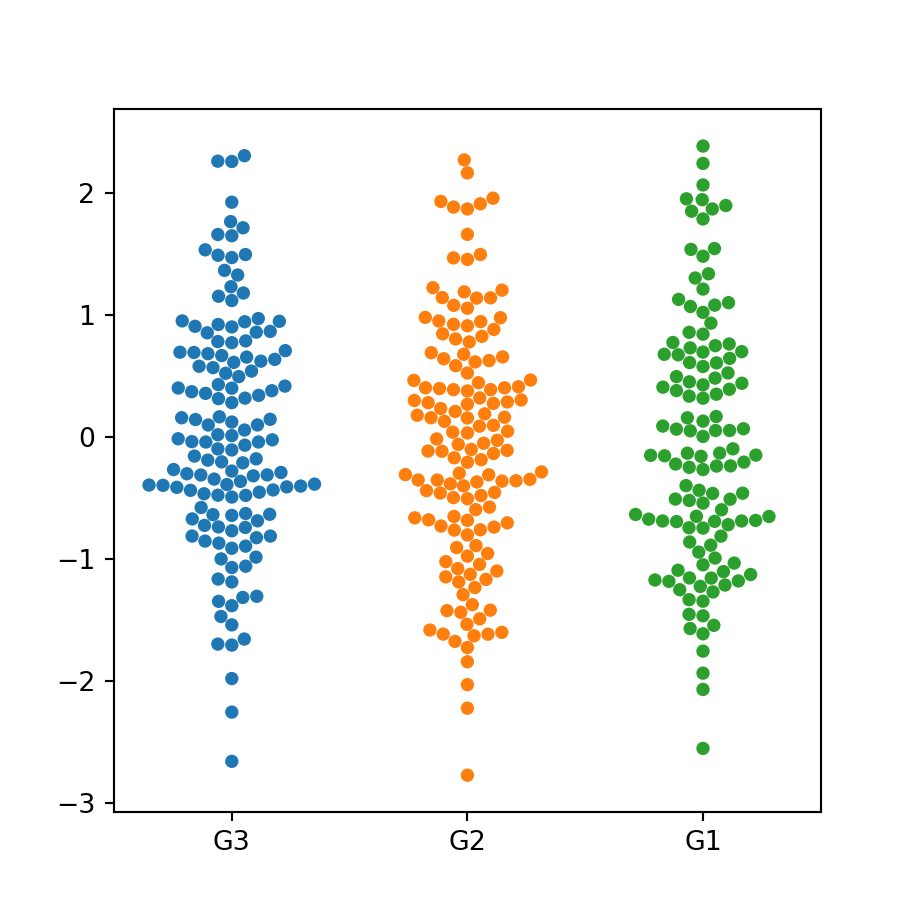
Swarm plot in seaborn
Heat map in seaborn with the heatmap function
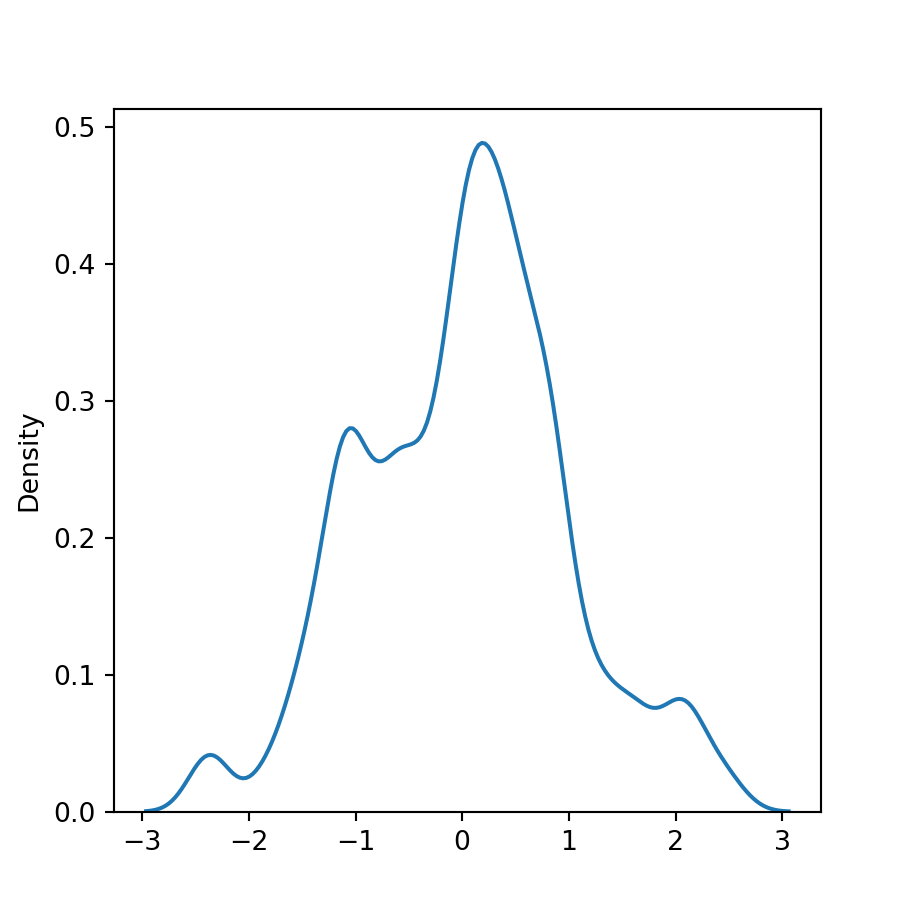
Kernel density plot in seaborn with kdeplot
Histogram by group in seaborn
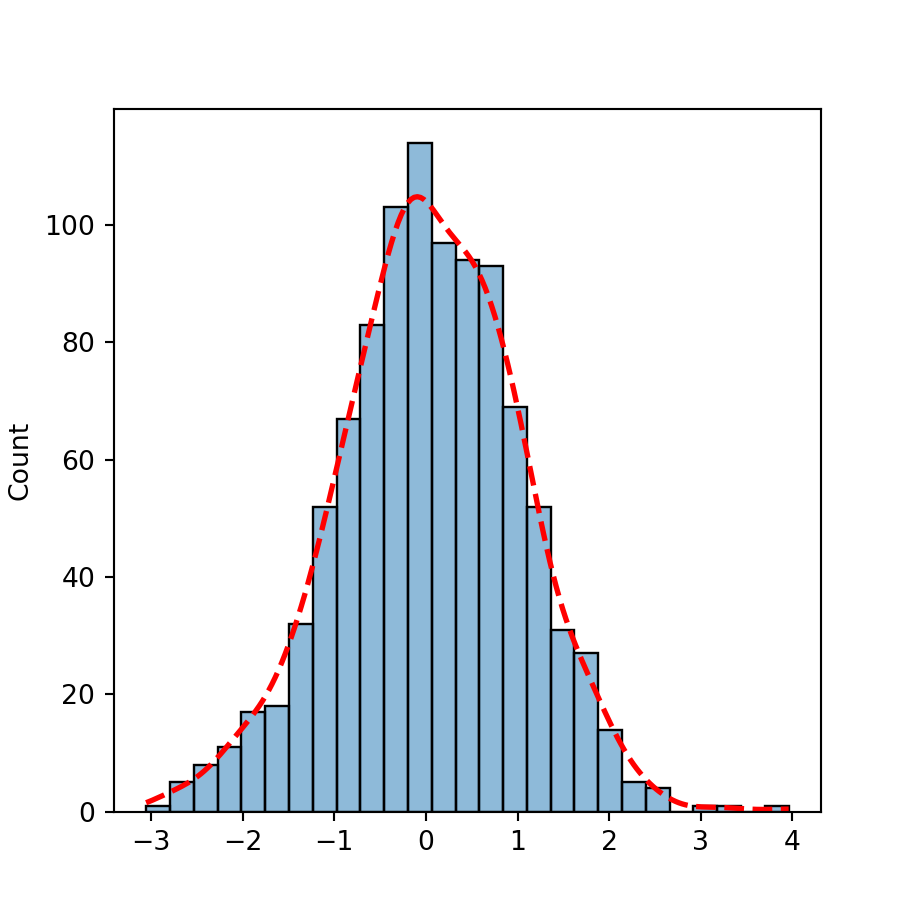
Histogram with density in seaborn
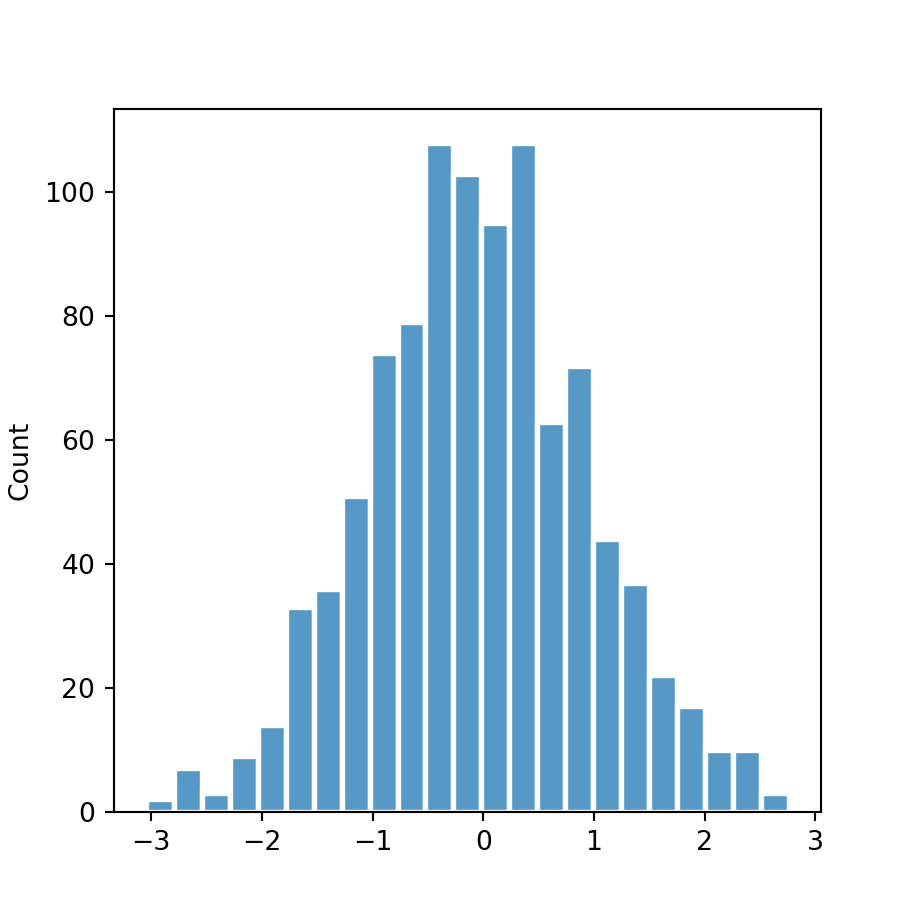
Histogram in seaborn with histplot
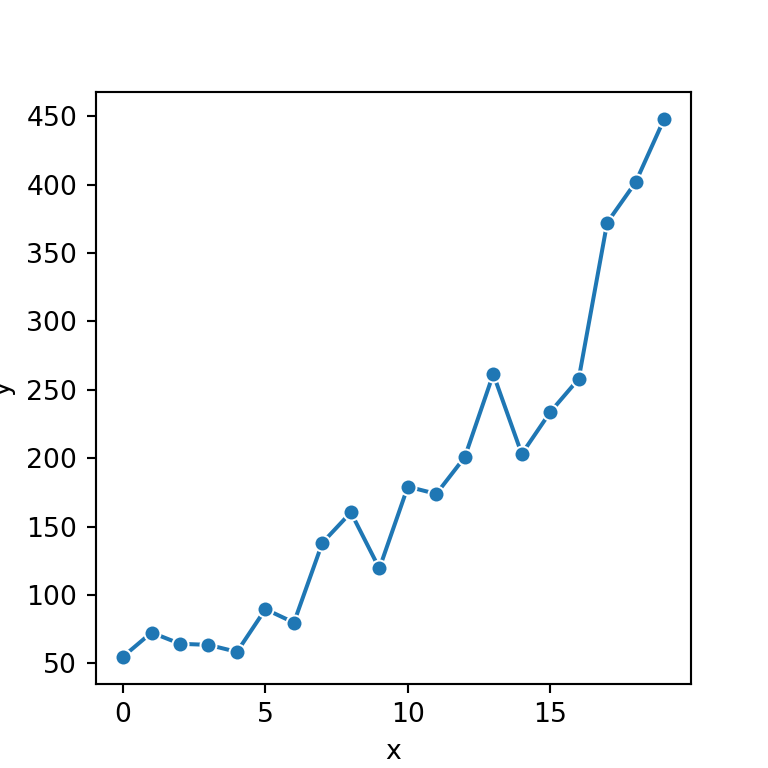
Line chart in seaborn with lineplot
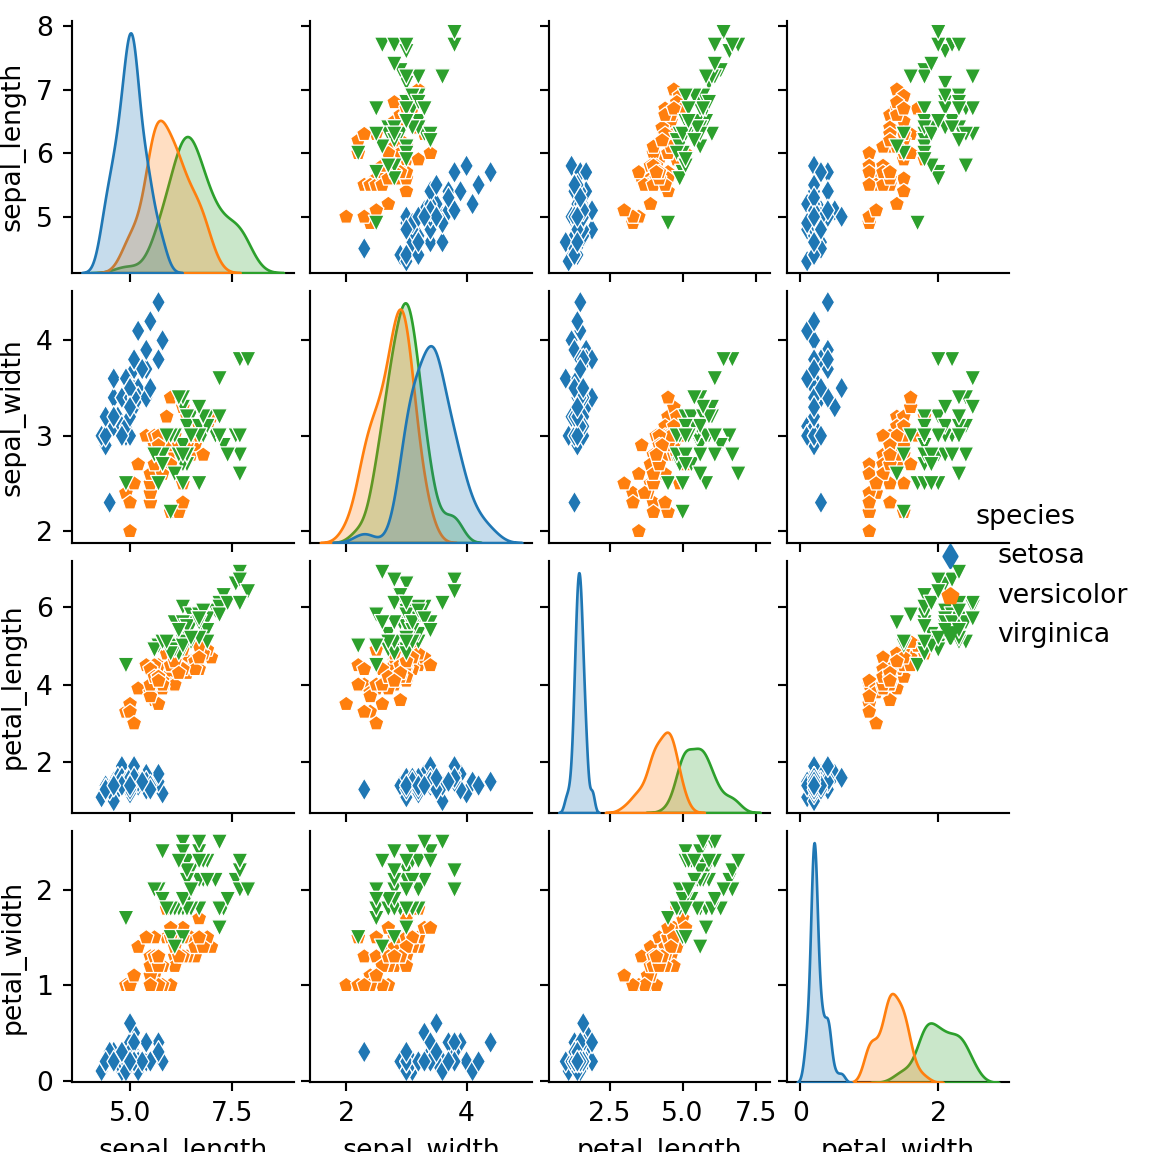
Pairs plot (pairwise plot) in seaborn with the pairplot function
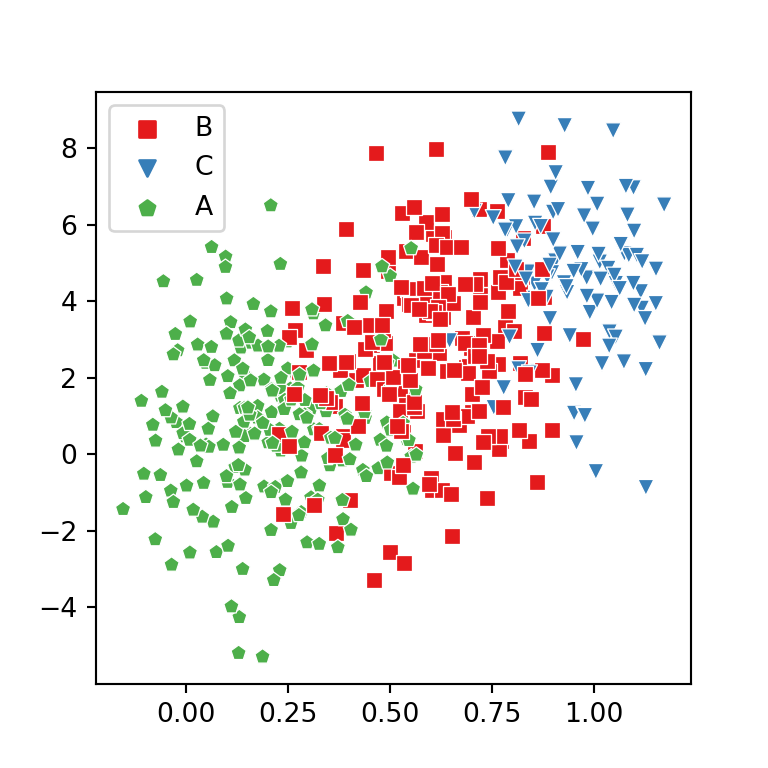
Scatter plot by group in seaborn
Scatter plot with regression line in seaborn
Scatter plot in seaborn