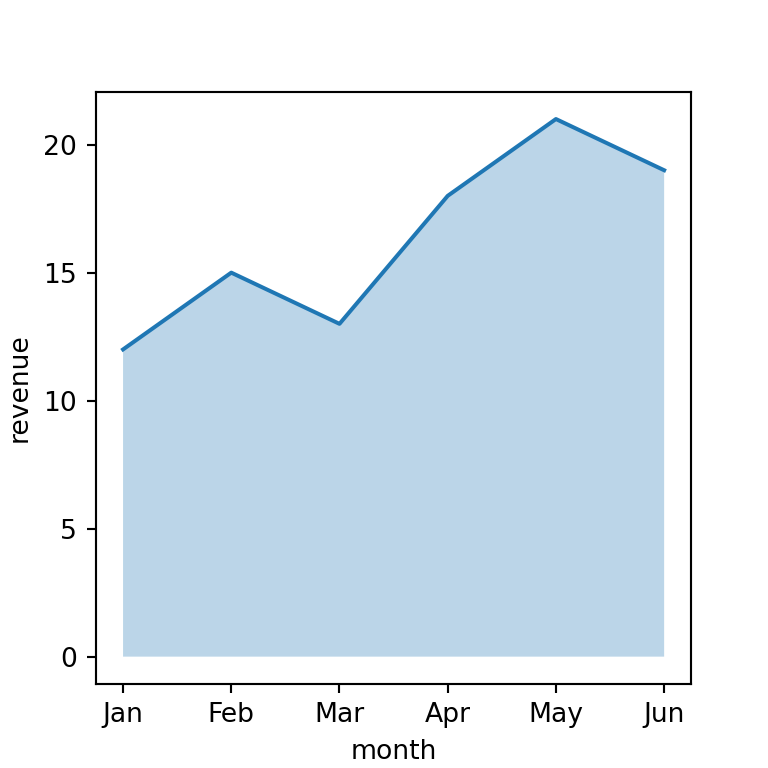
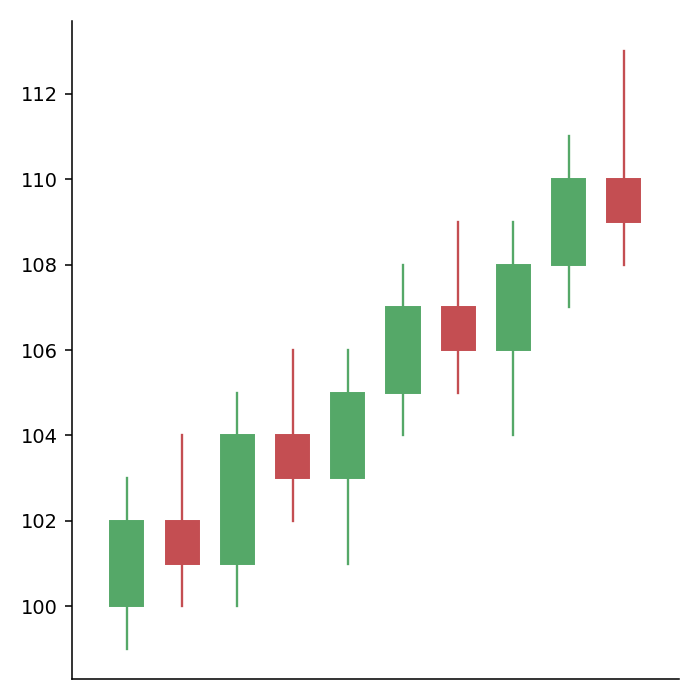
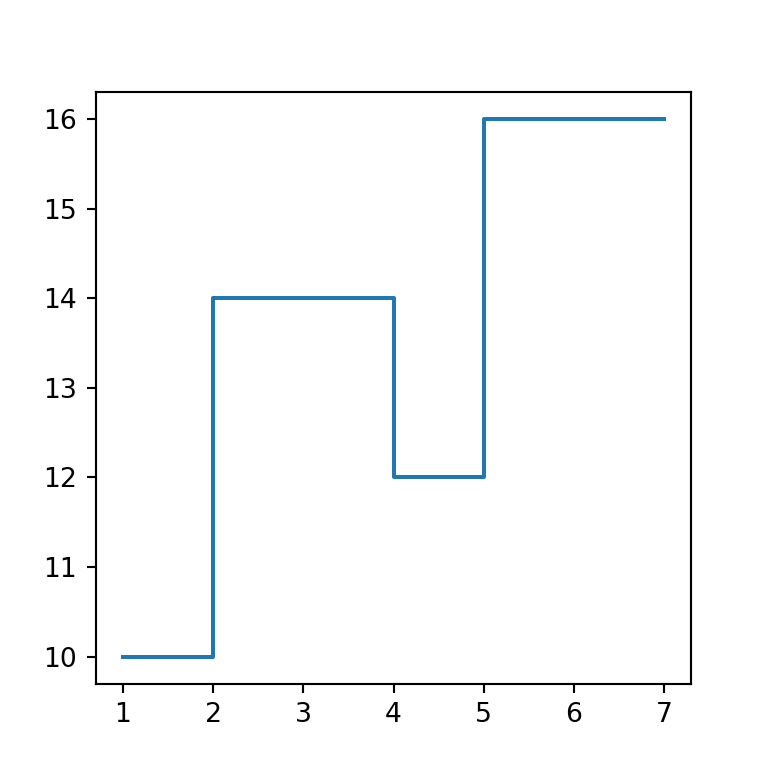
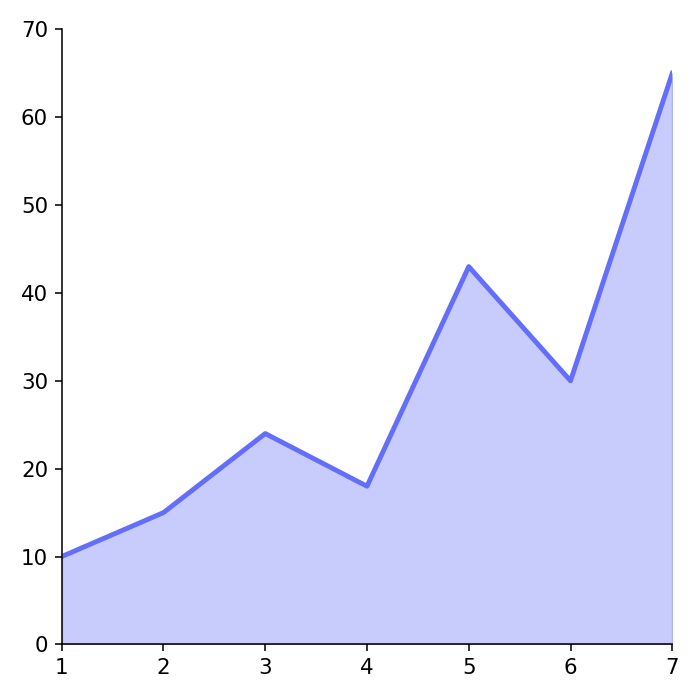
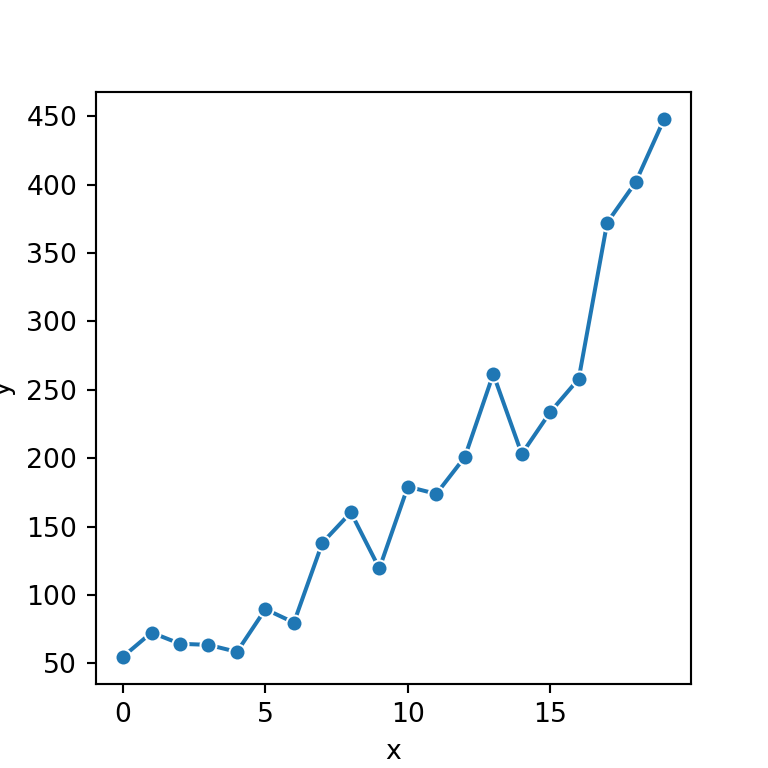
Line charts are the default type of chart of the plot method of pandas. They are the best option to represent time series, as the index (for example, a date index) is used for the X axis.
Line chart from a Series
Call plot (or plot.line) on a Series to draw a single line.
import numpy as np
import pandas as pd
import matplotlib.pyplot as plt

rng = np.random.default_rng(11)
returns = rng.normal(0.001, 0.02, (250, 3))
df = pd.DataFrame(100 * np.exp(returns.cumsum(axis = 0)),
                  columns = ["Alpha", "Beta", "Gamma"],
                  index = pd.bdate_range("2025-01-01", periods = 250))

df["Alpha"].plot()
# plt.show()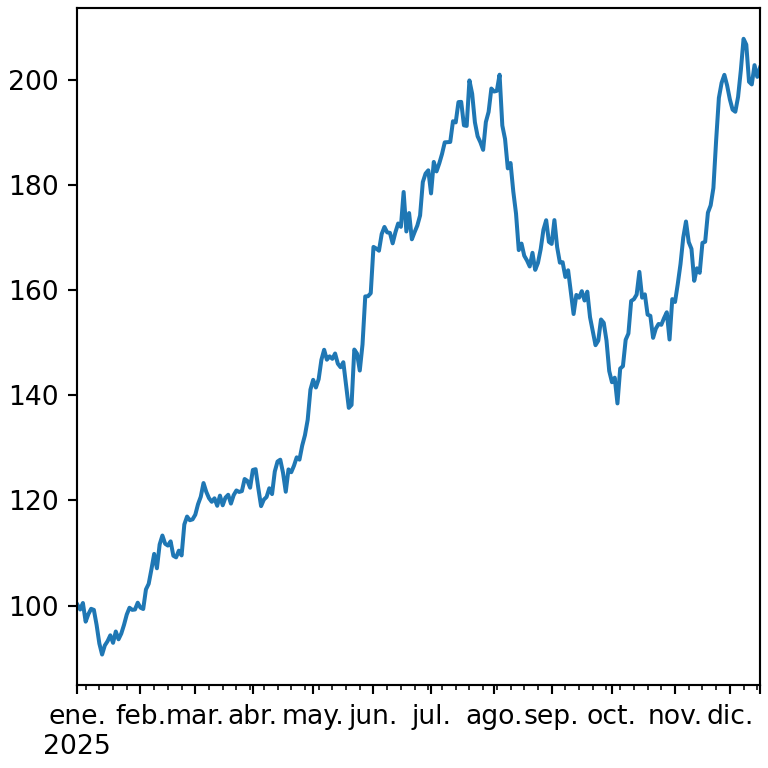
Several lines from a DataFrame
When you call plot on a data frame each numeric column is drawn as a different line and a legend is added automatically.
import numpy as np
import pandas as pd
import matplotlib.pyplot as plt

rng = np.random.default_rng(11)
returns = rng.normal(0.001, 0.02, (250, 3))
df = pd.DataFrame(100 * np.exp(returns.cumsum(axis = 0)),
                  columns = ["Alpha", "Beta", "Gamma"],
                  index = pd.bdate_range("2025-01-01", periods = 250))

df.plot.line()
# plt.show()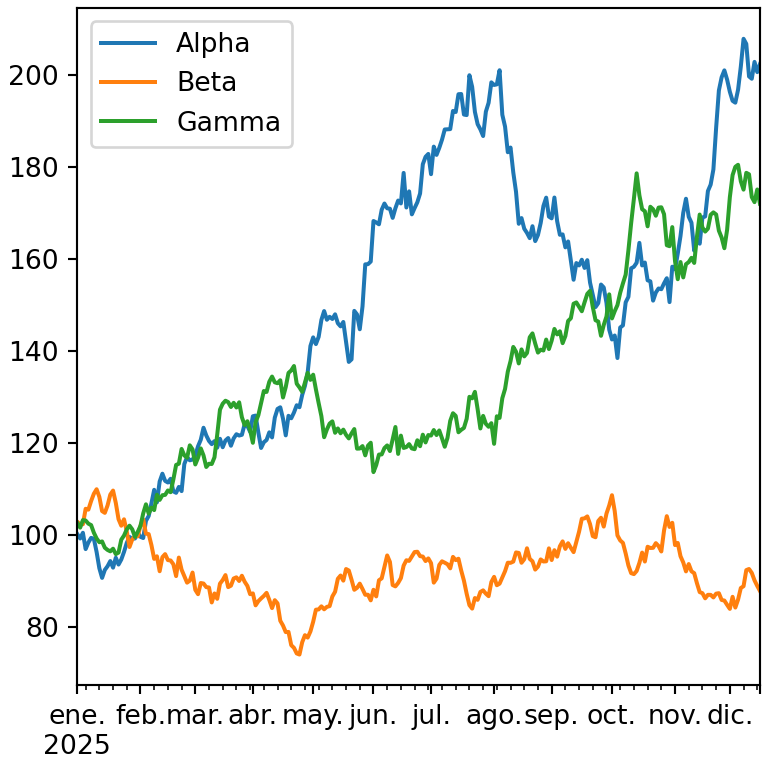
Choose the columns
Select the columns you want to represent with y, or index the data frame before plotting it.
import numpy as np
import pandas as pd
import matplotlib.pyplot as plt

rng = np.random.default_rng(11)
returns = rng.normal(0.001, 0.02, (250, 3))
df = pd.DataFrame(100 * np.exp(returns.cumsum(axis = 0)),
                  columns = ["Alpha", "Beta", "Gamma"],
                  index = pd.bdate_range("2025-01-01", periods = 250))

df.plot(y = ["Alpha", "Gamma"])
# plt.show()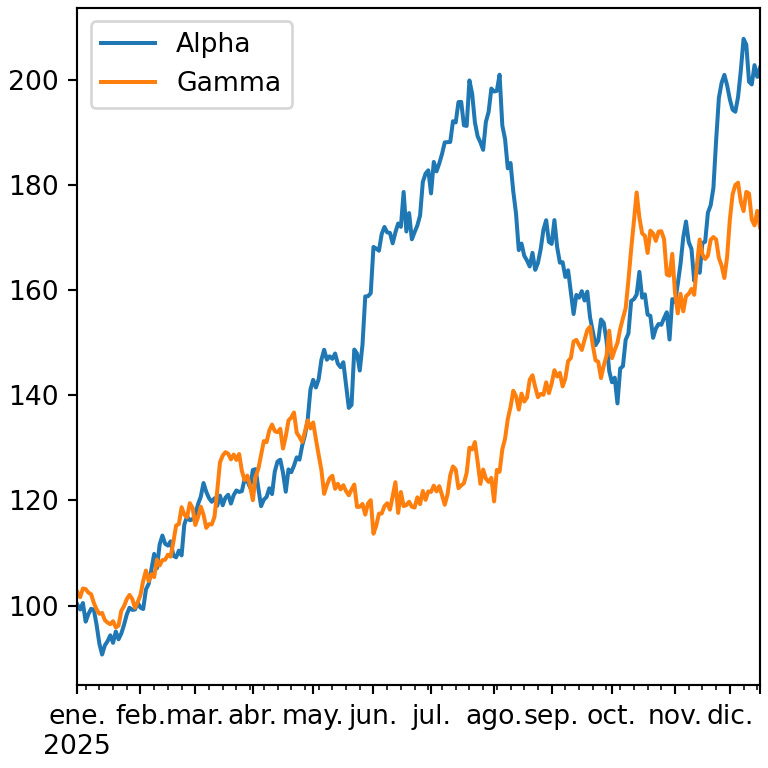
Colors, line styles and markers
Use color to set the colors, style to pass a format string for each line (color, marker and line style) and linewidth to change the width.
import numpy as np
import pandas as pd
import matplotlib.pyplot as plt

rng = np.random.default_rng(11)
returns = rng.normal(0.001, 0.02, (250, 3))
df = pd.DataFrame(100 * np.exp(returns.cumsum(axis = 0)),
                  columns = ["Alpha", "Beta", "Gamma"],
                  index = pd.bdate_range("2025-01-01", periods = 250))

df.plot(style = ["-", "--", ":"],
        color = ["#264653", "#E76F51", "#2A9D8F"], linewidth = 2)
# plt.show()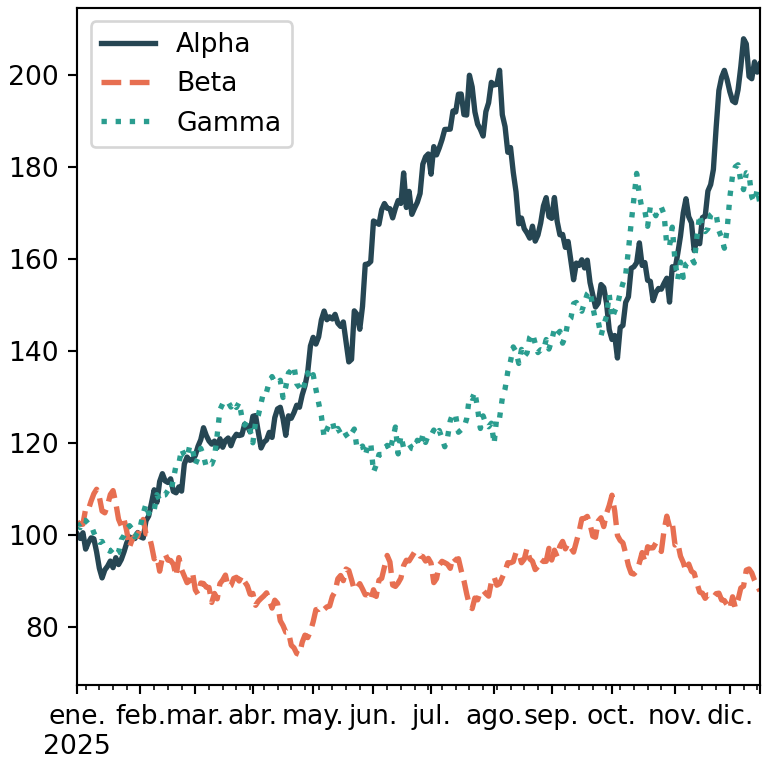
Markers
Add markers with the marker argument or within the format string, for instance "o-".
import pandas as pd
import matplotlib.pyplot as plt

s = pd.Series([3, 5, 4, 7, 6, 8], index = [2020, 2021, 2022, 2023, 2024, 2025])

s.plot(marker = "o", markersize = 8)
# plt.show()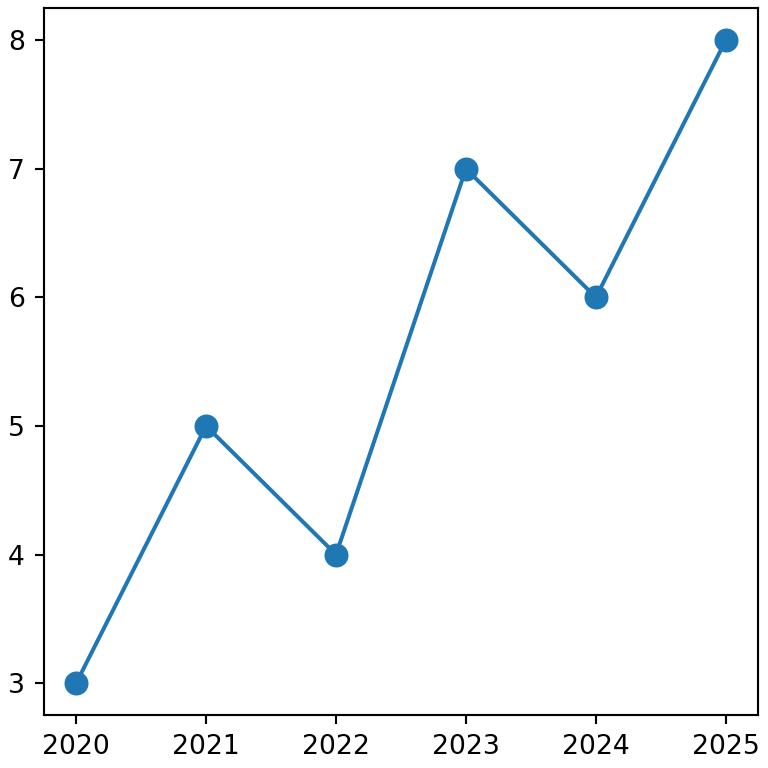
Add a rolling mean
Pass the axes returned by the first plot call to the ax argument of the second to draw both lines on the same chart. This is useful to add a rolling mean computed with rolling.
import numpy as np
import pandas as pd
import matplotlib.pyplot as plt

rng = np.random.default_rng(11)
returns = rng.normal(0.001, 0.02, (250, 3))
df = pd.DataFrame(100 * np.exp(returns.cumsum(axis = 0)),
                  columns = ["Alpha", "Beta", "Gamma"],
                  index = pd.bdate_range("2025-01-01", periods = 250))

ax = df["Alpha"].plot(alpha = 0.5, label = "Alpha")
df["Alpha"].rolling(20).mean().plot(ax = ax, linewidth = 2, label = "Rolling mean")
ax.legend()
# plt.show()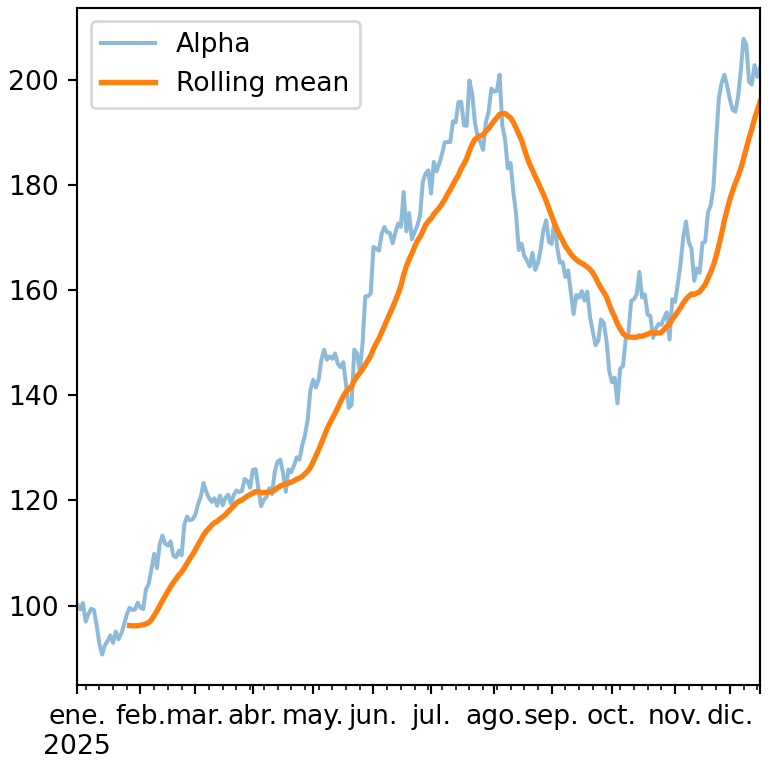
Log scale and subplots
logy = True uses a logarithmic scale on the Y axis and subplots = True draws each line in a different subplot.
import numpy as np
import pandas as pd
import matplotlib.pyplot as plt

rng = np.random.default_rng(11)
returns = rng.normal(0.001, 0.02, (250, 3))
df = pd.DataFrame(100 * np.exp(returns.cumsum(axis = 0)),
                  columns = ["Alpha", "Beta", "Gamma"],
                  index = pd.bdate_range("2025-01-01", periods = 250))

df.plot(subplots = True, sharex = True)
# plt.show()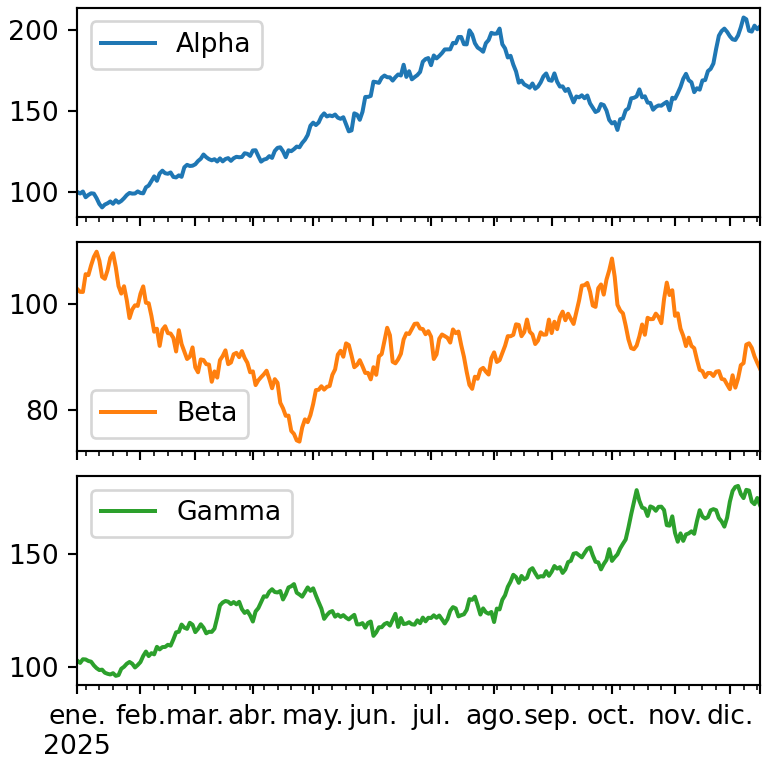
See the plotting with pandas guide for the rest of arguments or learn how to customize the date axis with matplotlib.