Matplotlib can plot dates and times directly from Python datetime objects, NumPy datetime64 arrays or pandas date columns. The matplotlib.dates module provides locators to place the ticks and formatters to choose how the dates are displayed.
Plotting dates
Pass the dates as the X-axis values. Matplotlib detects that they are dates and chooses the position and format of the ticks automatically.
import numpy as np
import pandas as pd
import matplotlib.pyplot as plt

dates = pd.date_range("2025-01-01", periods = 365, freq = "D")
values = np.random.default_rng(1).normal(size = 365).cumsum()

fig, ax = plt.subplots()
ax.plot(dates, values)
# plt.show()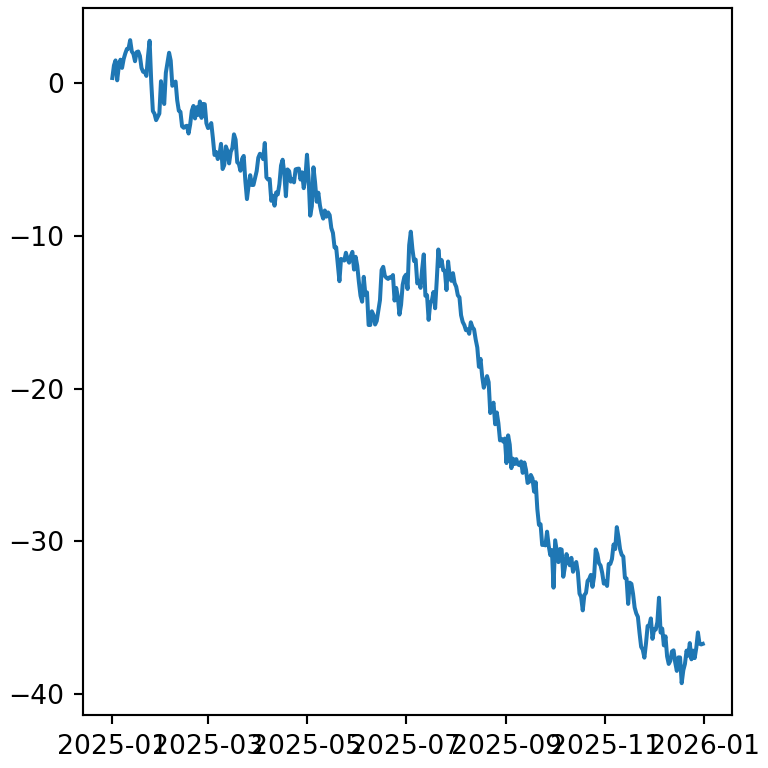
When the labels overlap, as in the previous plot, you have several options: use a more compact format, rotate the labels or reduce the number of ticks.
Concise date format
The ConciseDateFormatter displays the minimum information needed in each label (for instance, the year only once) and is usually the best option for time series.
import numpy as np
import pandas as pd
import matplotlib.pyplot as plt

dates = pd.date_range("2025-01-01", periods = 365, freq = "D")
values = np.random.default_rng(1).normal(size = 365).cumsum()
import matplotlib.dates as mdates

fig, ax = plt.subplots()
ax.plot(dates, values)

locator = mdates.AutoDateLocator()
ax.xaxis.set_major_locator(locator)
ax.xaxis.set_major_formatter(mdates.ConciseDateFormatter(locator))
# plt.show()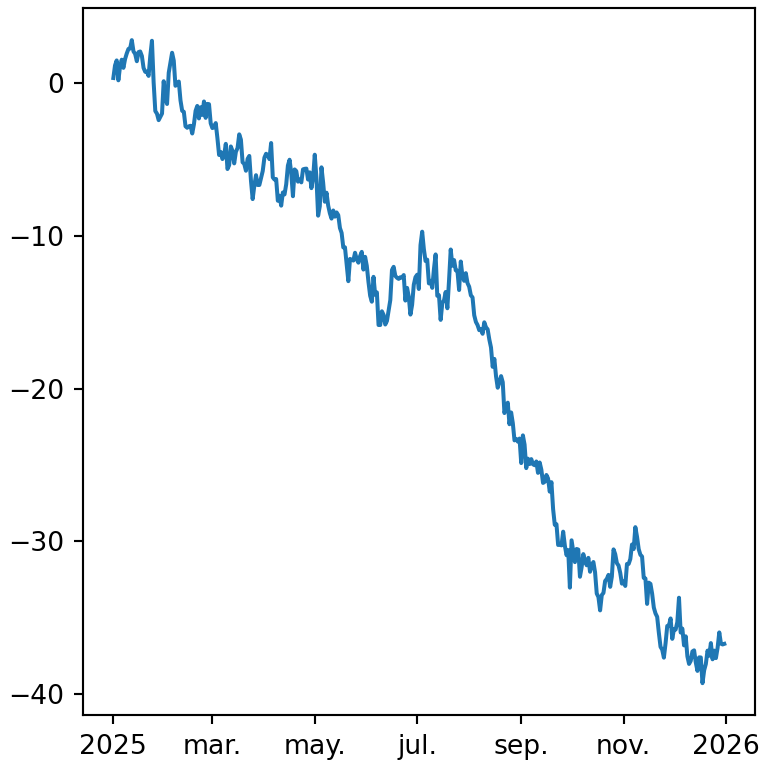
Custom date format
Use DateFormatter with a format string to choose how the dates are displayed. The most common codes are %Y (year), %m (month as a number), %b (abbreviated month name), %B (full month name), %d (day), %H (hour) and %M (minutes).
import numpy as np
import pandas as pd
import matplotlib.pyplot as plt

dates = pd.date_range("2025-01-01", periods = 365, freq = "D")
values = np.random.default_rng(1).normal(size = 365).cumsum()
import matplotlib.dates as mdates

fig, ax = plt.subplots()
ax.plot(dates, values)

ax.xaxis.set_major_formatter(mdates.DateFormatter("%b %Y"))
# plt.show()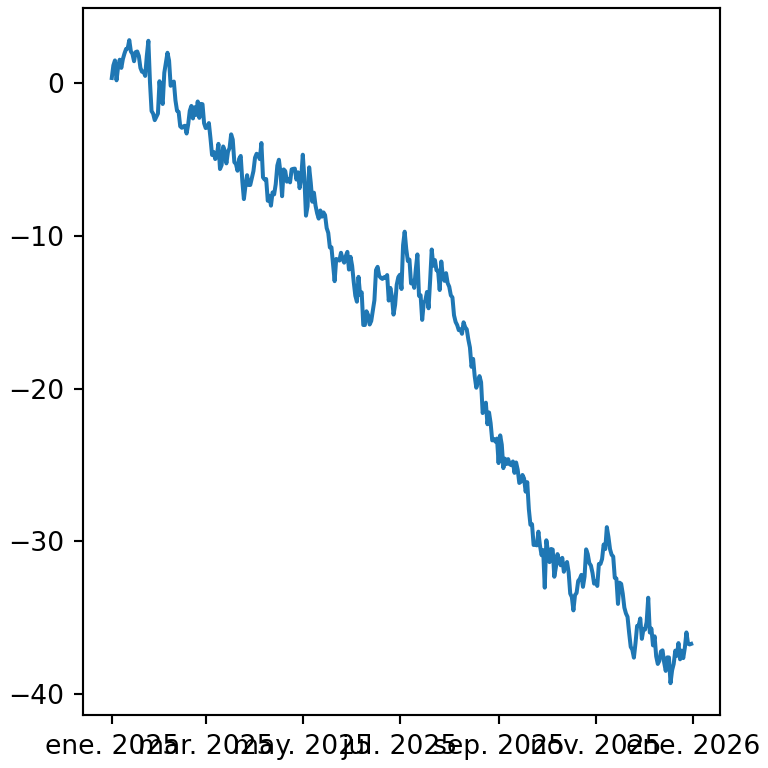
Date ticks every month, week or day
Locators set the position of the ticks. MonthLocator, WeekdayLocator, DayLocator, YearLocator and HourLocator place a tick every given interval. You can also add minor ticks with a different locator.
import numpy as np
import pandas as pd
import matplotlib.pyplot as plt

dates = pd.date_range("2025-01-01", periods = 365, freq = "D")
values = np.random.default_rng(1).normal(size = 365).cumsum()
import matplotlib.dates as mdates

fig, ax = plt.subplots()
ax.plot(dates, values)

ax.xaxis.set_major_locator(mdates.MonthLocator(interval = 3))
ax.xaxis.set_minor_locator(mdates.MonthLocator())
ax.xaxis.set_major_formatter(mdates.DateFormatter("%b"))
# plt.show()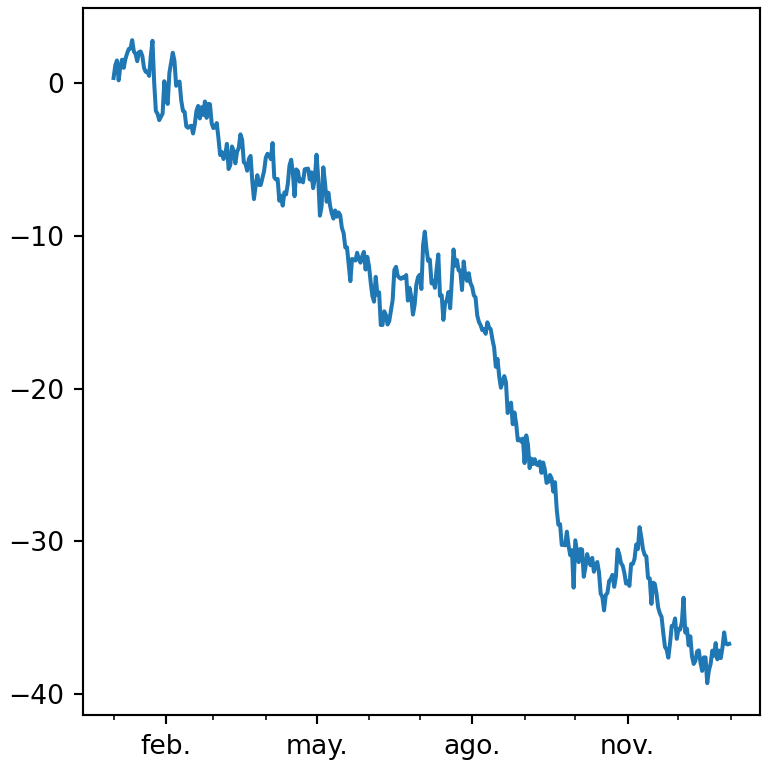
Rotate the date labels
fig.autofmt_xdate rotates and right-aligns the date labels so they don’t overlap. You can also use ax.tick_params(axis = "x", labelrotation = 45).
import numpy as np
import pandas as pd
import matplotlib.pyplot as plt

dates = pd.date_range("2025-01-01", periods = 365, freq = "D")
values = np.random.default_rng(1).normal(size = 365).cumsum()

fig, ax = plt.subplots()
ax.plot(dates, values)

fig.autofmt_xdate()
# plt.show()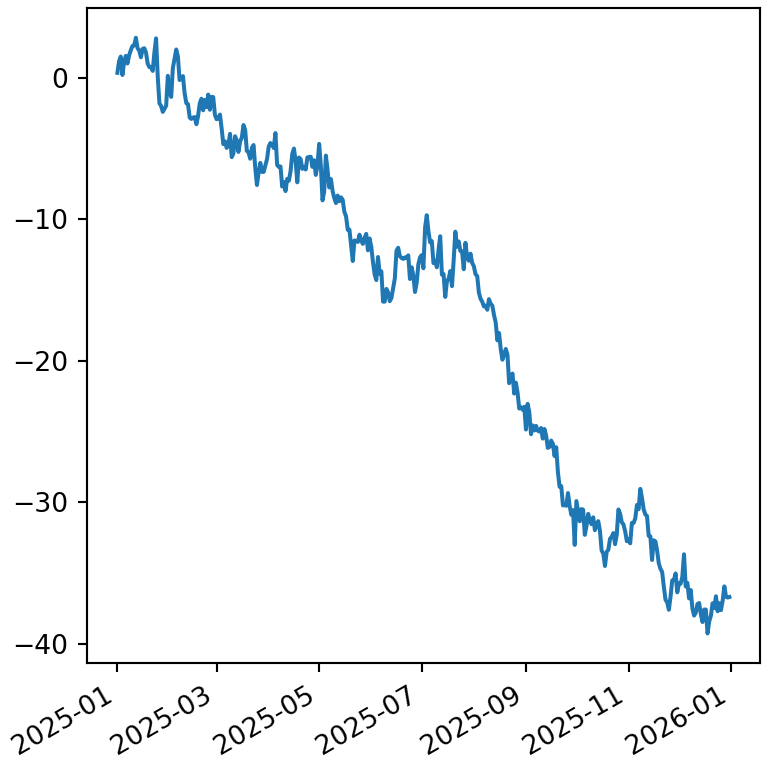
Date limits
To zoom in on a period, pass dates to set_xlim. They can be datetime objects or pandas timestamps.
import numpy as np
import pandas as pd
import matplotlib.pyplot as plt

dates = pd.date_range("2025-01-01", periods = 365, freq = "D")
values = np.random.default_rng(1).normal(size = 365).cumsum()
import matplotlib.dates as mdates

fig, ax = plt.subplots()
ax.plot(dates, values)

ax.set_xlim(pd.Timestamp("2025-03-01"), pd.Timestamp("2025-06-30"))
ax.xaxis.set_major_formatter(mdates.DateFormatter("%d %b"))
# plt.show()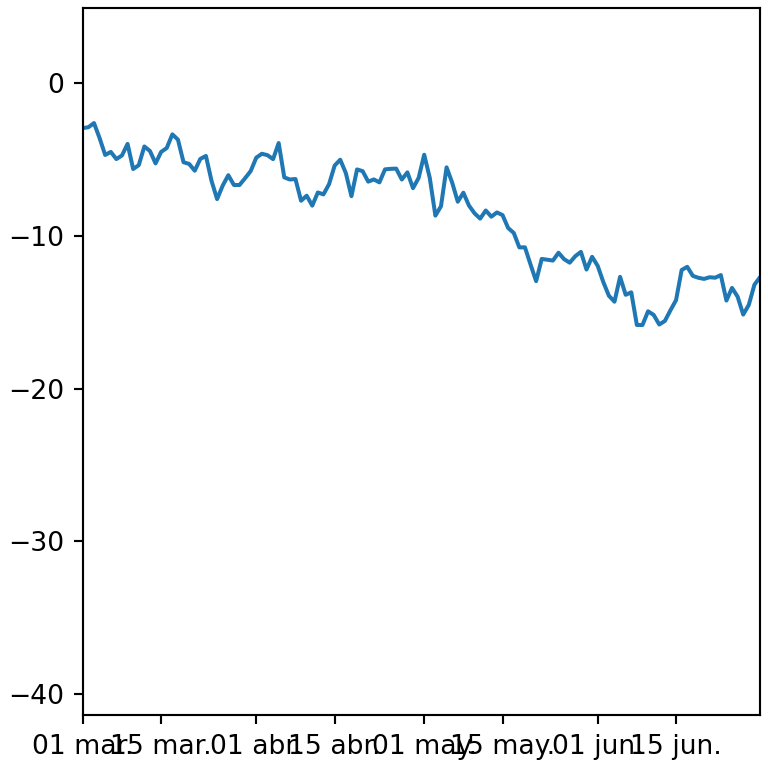
Dates with pandas
If your data is in a pandas data frame with a date column (or a date index) you can pass the columns to matplotlib directly. Make sure the column has a date type, converting it with pd.to_datetime if necessary.
import pandas as pd
import matplotlib.pyplot as plt

df = pd.DataFrame({"date": ["2025-01-01", "2025-02-01", "2025-03-01"],
                   "value": [10, 15, 12]})
df["date"] = pd.to_datetime(df["date"])

fig, ax = plt.subplots()
ax.plot(df["date"], df["value"])
# plt.show()
Learn more about how to customize the rest of the elements of the axes in the axis customization in matplotlib tutorial or how to create a line chart in matplotlib.