Once your chart is ready you can export it to a file with savefig. This tutorial explains the most important arguments to get the image exactly as you want.
Saving a figure with savefig
Call plt.savefig or fig.savefig with the name of the file. The format is deduced from the extension.
import matplotlib.pyplot as plt

fig, ax = plt.subplots()
ax.pie([45, 30, 15, 10], labels = ["A", "B", "C", "D"], autopct = "%1.0f%%")
ax.set_title("my_chart.png", family = "monospace")
# plt.show()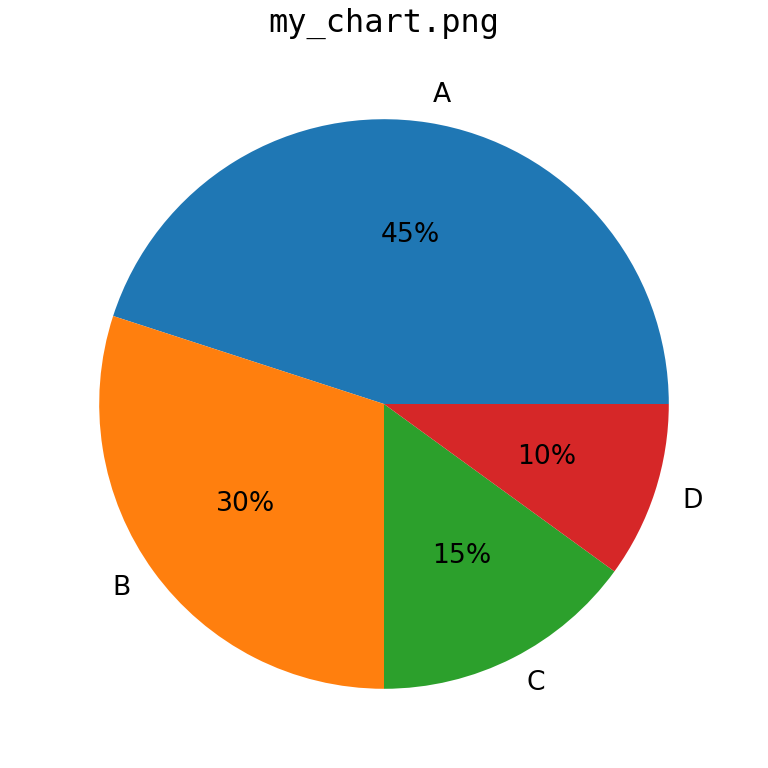
fig.savefig("my_chart.png")Important: call savefig before plt.show(). In some environments show clears the figure and the saved file will be empty.
File formats
Matplotlib supports raster formats such as PNG and JPG and vector formats such as PDF, SVG and EPS. Vector formats can be scaled without losing quality, so they are the best option for publications and documents.
fig.savefig("my_chart.png")
fig.savefig("my_chart.jpg")
fig.savefig("my_chart.pdf")
fig.savefig("my_chart.svg")
Resolution with dpi
For raster formats the dpi argument sets the resolution. A value of 300 is usually enough for printing. The size in pixels of the file is the figure size in inches multiplied by the DPI.
fig.savefig("my_chart.png", dpi = 300)Remove the white space or avoid cropped elements
With bbox_inches = "tight" matplotlib adjusts the saved area to the content of the figure. This removes the extra white space and avoids cutting elements placed outside the axes, such as a legend outside the plot. pad_inches controls the remaining margin.
fig.savefig("my_chart.png", bbox_inches = "tight", pad_inches = 0.1)Transparent background
Set transparent = True to save the image without background, for instance to place it over a colored slide. Use facecolor to save it with a different background color.
fig.savefig("my_chart.png", transparent = True)
fig.savefig("my_chart.png", facecolor = "lightyellow")
Several figures in a single PDF
PdfPages allows saving several figures as the pages of the same PDF file.
import matplotlib.pyplot as plt
from matplotlib.backends.backend_pdf import PdfPages

with PdfPages("report.pdf") as pdf:
    for i in range(3):
        fig, ax = plt.subplots()
        ax.plot(range(10), [v ** (i + 1) for v in range(10)])
        pdf.savefig(fig)
        plt.close(fig)
If you create many figures in a loop, close each one with plt.close(fig) after saving it to free memory. To control the size of the saved image see the figure size in matplotlib tutorial.