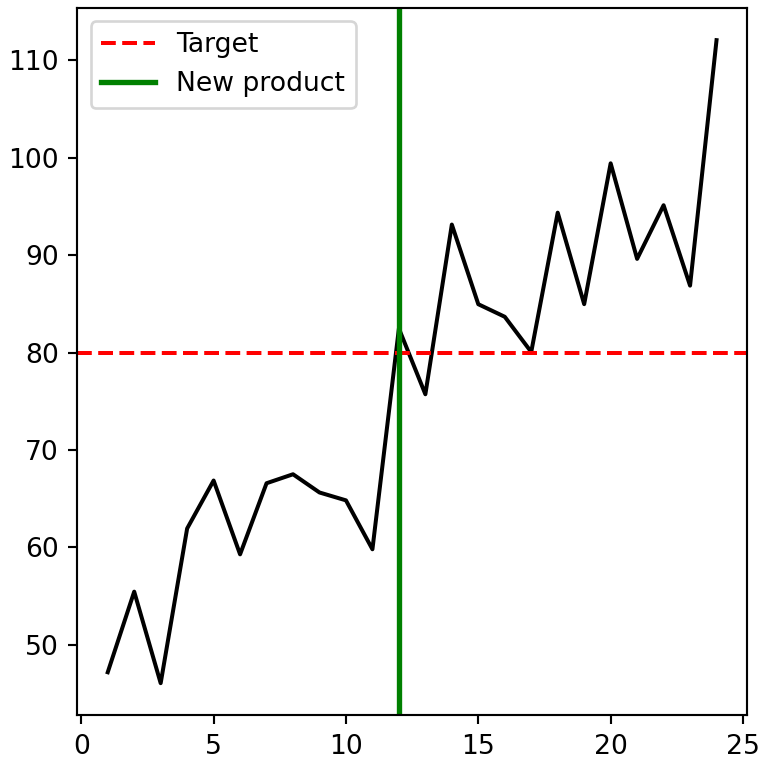
The style of a line in matplotlib is controlled with the linestyle (or ls) argument, available in plot and in any function that draws lines, such as axhline, vlines, grid or the borders of bars. This guide contains the list of line styles and how to customize the width, color and dashes of the lines.
List of line styles
Matplotlib provides four named line styles, which can be specified with their name or with a short string. Use "None", "" or " " to draw no line.
| Name | Short string | Description |
|---|---|---|
“solid”
|
“-”
|
Solid line (default) |
“dashed”
|
“–”
|
Dashed line |
“dashdot”
|
“-.”
|
Dash-dotted line |
“dotted”
|
“:”
|
Dotted line |
“None”
|
““
|
No line |
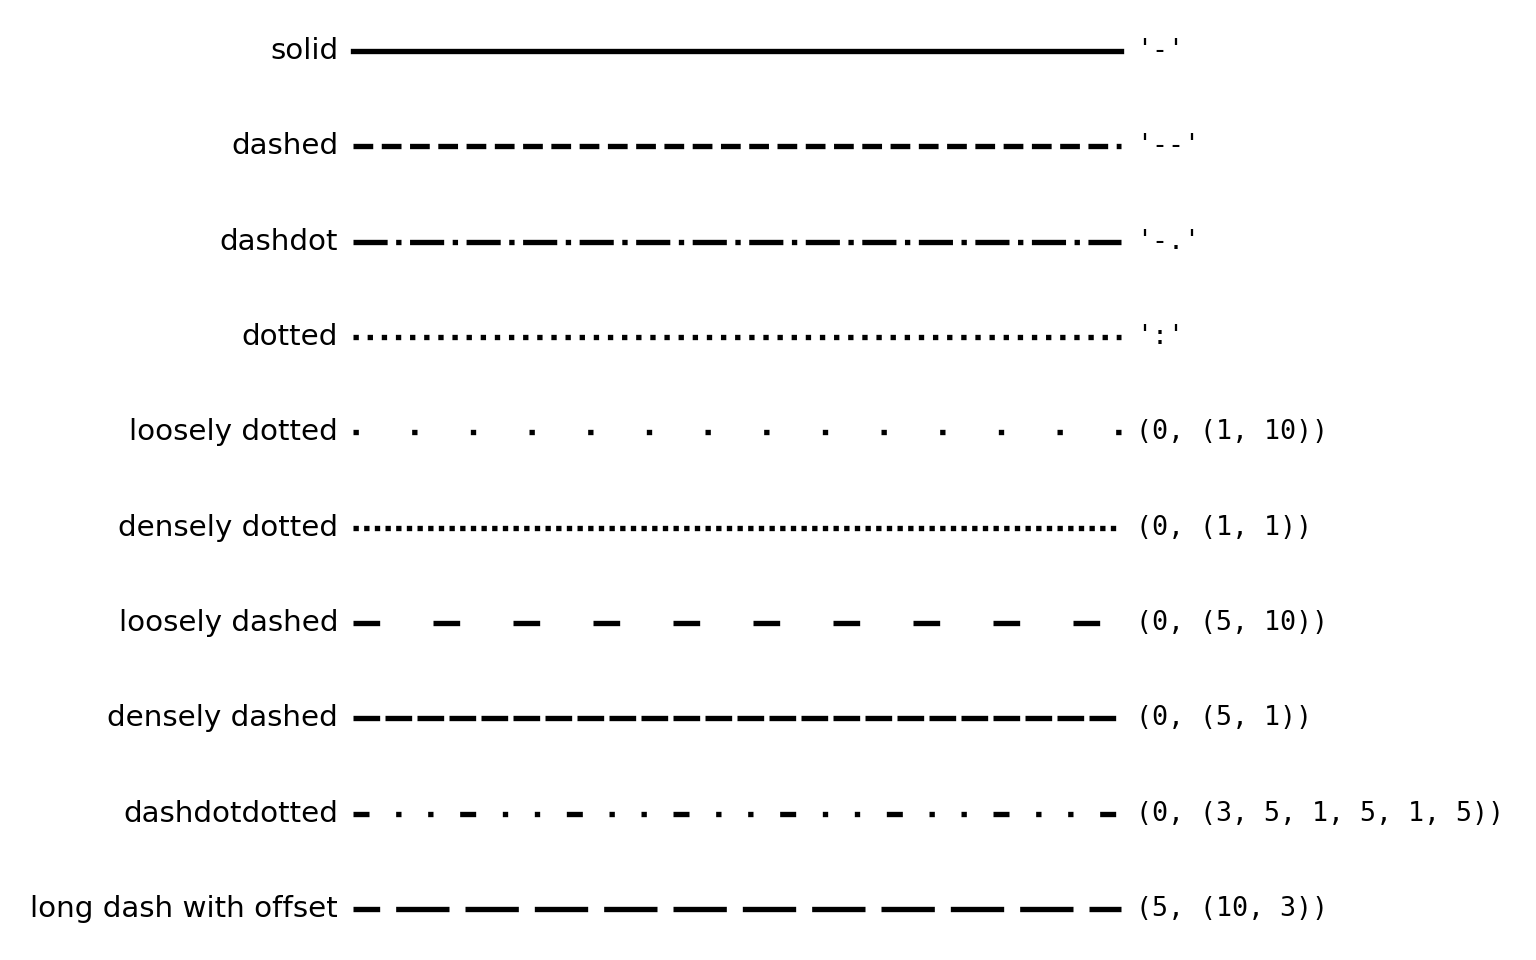
The following chart shows the named line styles and some common custom styles created with dash tuples, which are explained later in this tutorial.
import matplotlib.pyplot as plt

styles = [("solid", "-"), ("dashed", "--"), ("dashdot", "-."), ("dotted", ":"),
          ("loosely dotted", (0, (1, 10))), ("densely dotted", (0, (1, 1))),
          ("loosely dashed", (0, (5, 10))), ("densely dashed", (0, (5, 1))),
          ("dashdotdotted", (0, (3, 5, 1, 5, 1, 5))), ("long dash with offset", (5, (10, 3)))]

fig, ax = plt.subplots(figsize = (8, 5))

for i, (name, style) in enumerate(styles):
    ax.plot([0, 1], [-i, -i], linestyle = style, linewidth = 2, color = "black")
    ax.text(-0.02, -i, name, ha = "right", va = "center", fontsize = 11)
    ax.text(1.02, -i, repr(style), ha = "left", va = "center", fontsize = 10, family = "monospace")

ax.set_xlim(-0.45, 1.5)
ax.axis("off")
# plt.show()
Change the line style
Pass any of the previous styles to linestyle or ls.
import numpy as np
import matplotlib.pyplot as plt

years = np.arange(2025, 2036)
base = 100 + 4 * (years - 2025)

fig, ax = plt.subplots()
ax.plot(years, base * 1.15, linestyle = "dashed", linewidth = 2, label = "Optimistic")
ax.plot(years, base, linestyle = "solid", linewidth = 2, label = "Base")
ax.plot(years, base * 0.85, linestyle = ":", linewidth = 2, label = "Pessimistic")
ax.legend()
# plt.show()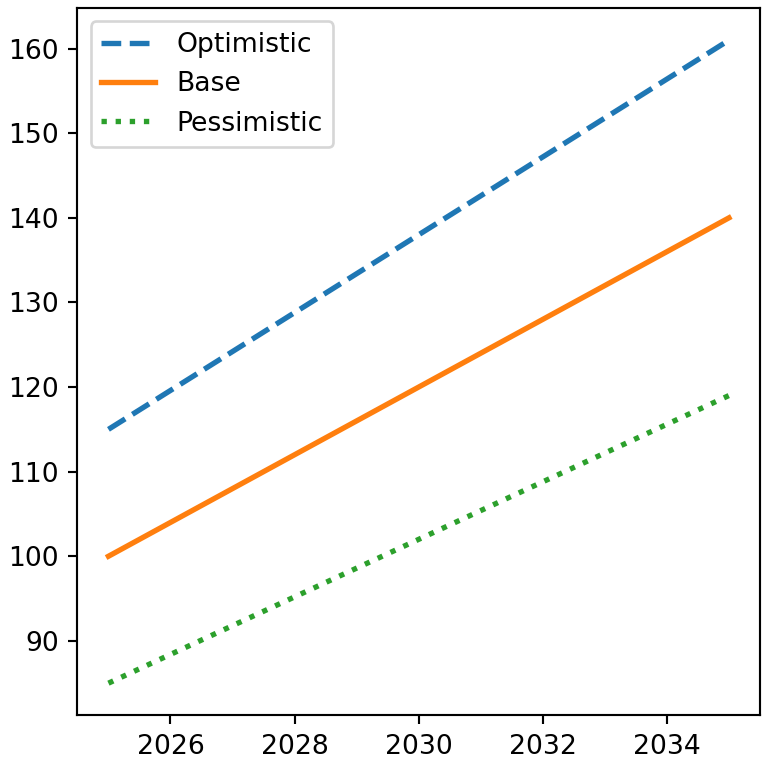
Format strings
The third positional argument of plot is a format string that combines color, marker and line style. For instance, "r--" is a red dashed line and "go:" a green dotted line with circles.
import numpy as np
import matplotlib.pyplot as plt

years = np.arange(2025, 2036)
base = 100 + 4 * (years - 2025)

fig, ax = plt.subplots()
ax.plot(years, base, "r--")
ax.plot(years, base * 0.9, "go:")
# plt.show()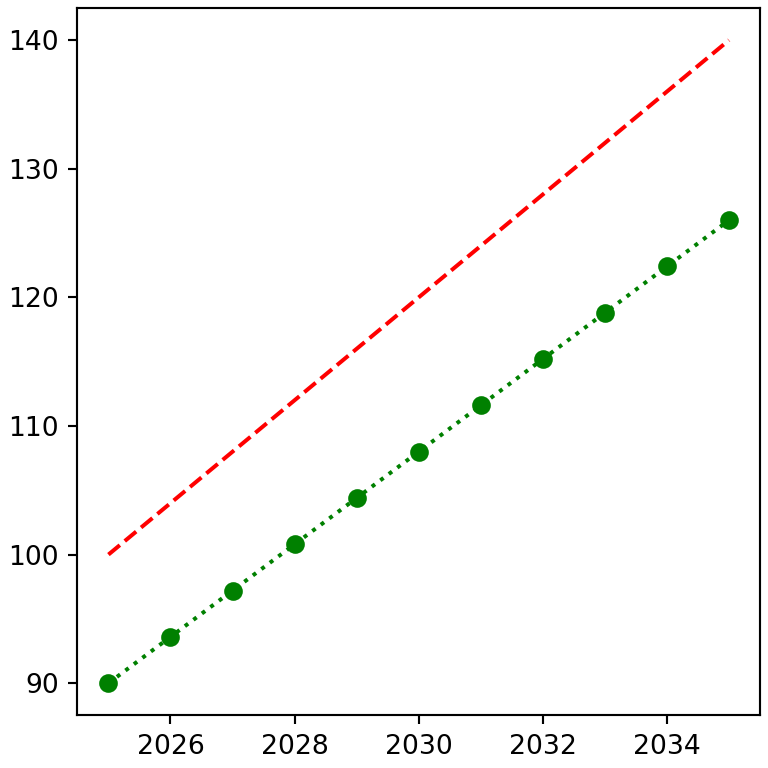
Custom dash patterns
For more control, pass a tuple of the form (offset, (on, off, on, off, ...)) where on and off are the lengths of the dashes and the gaps in points and offset is where the pattern starts. For instance, (0, (5, 1)) draws long dashes separated by small gaps and (0, (3, 5, 1, 5)) a dash-dotted line with larger gaps.
import numpy as np
import matplotlib.pyplot as plt

years = np.arange(2025, 2036)
base = 100 + 4 * (years - 2025)

fig, ax = plt.subplots()
ax.plot(years, base, linestyle = (0, (5, 1)))
ax.plot(years, base * 1.1, linestyle = (0, (3, 5, 1, 5)))
# plt.show()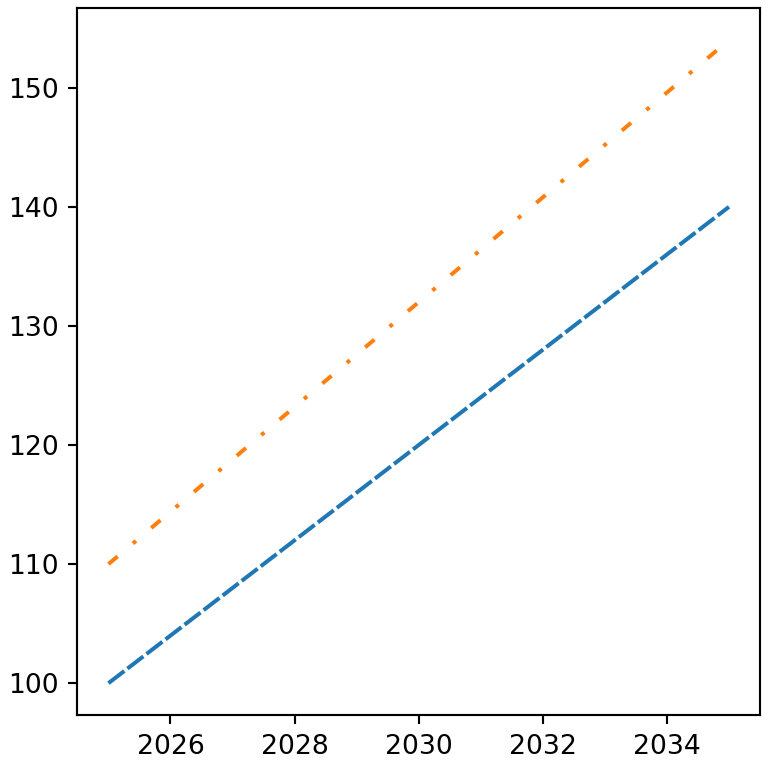
Line width
The width of the lines is set in points with linewidth or lw. The default value is 1.5.
import numpy as np
import matplotlib.pyplot as plt

years = np.arange(2025, 2036)
base = 100 + 4 * (years - 2025)

fig, ax = plt.subplots()
ax.plot(years, base, linewidth = 0.5)
ax.plot(years, base + 10, linewidth = 2)
ax.plot(years, base + 20, linewidth = 5)
# plt.show()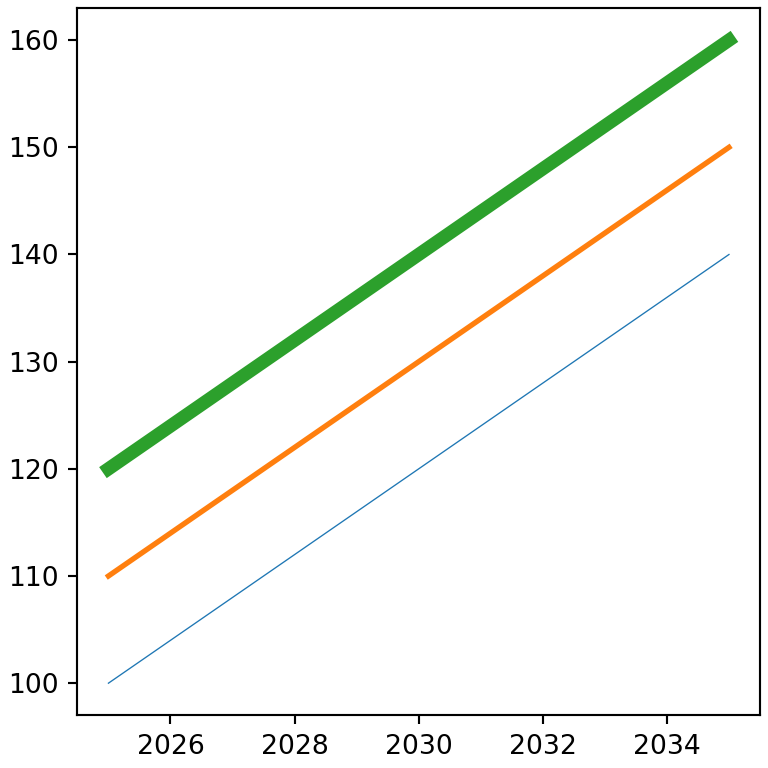
Line color and transparency
Use color to change the color of the line (see the full list of matplotlib colors) and alpha to set its transparency.
import numpy as np
import matplotlib.pyplot as plt

years = np.arange(2025, 2036)
base = 100 + 4 * (years - 2025)

fig, ax = plt.subplots()
ax.plot(years, base, color = "darkorange", linewidth = 4, alpha = 0.5)
# plt.show()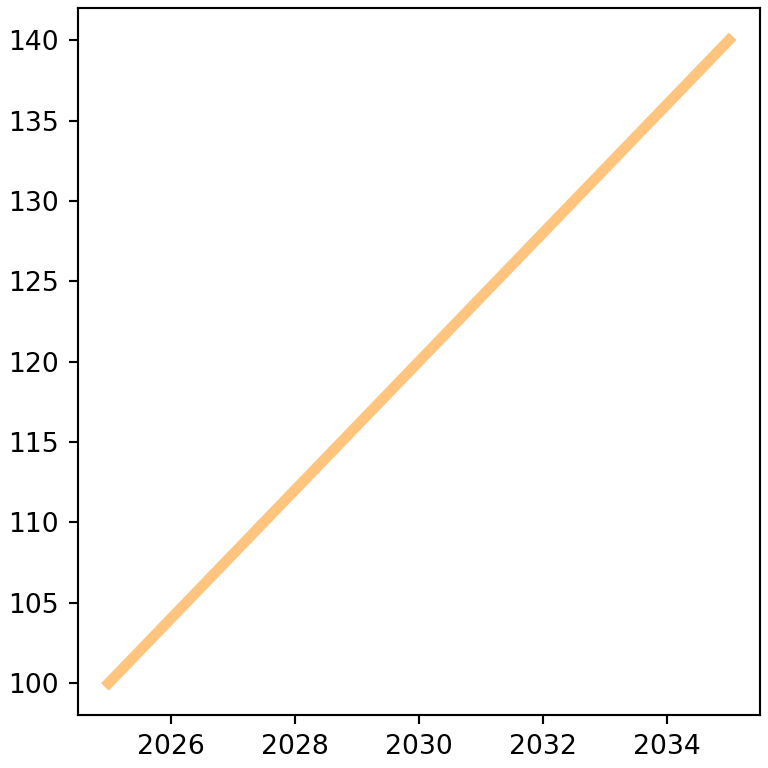
Line ends and joins
The dash_capstyle and solid_capstyle arguments change the ends of the dashes and lines ("butt", "round" or "projecting"), while dash_joinstyle and solid_joinstyle set how the segments are joined ("miter", "round" or "bevel"). The differences are noticeable with wide lines.
import matplotlib.pyplot as plt

fig, ax = plt.subplots()
ax.plot([0, 1], [1, 1], linestyle = "--", linewidth = 8, dash_capstyle = "butt")
ax.plot([0, 1], [0, 0], linestyle = "--", linewidth = 8, dash_capstyle = "round")
ax.set_ylim(-0.5, 1.5)
# plt.show()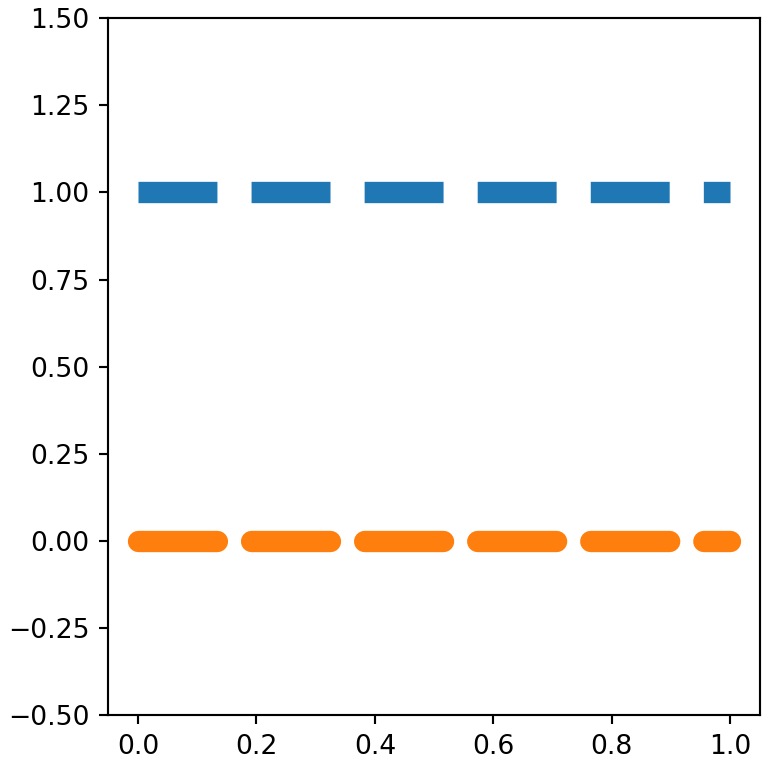
Line styles in other elements
The same arguments work in every element made of lines, such as horizontal and vertical lines, grid lines, the border of bars or the spines of the axes.
import matplotlib.pyplot as plt

fig, ax = plt.subplots()
ax.bar(["A", "B", "C"], [3, 5, 4], edgecolor = "black", linestyle = "--")
ax.axhline(4, color = "red", linestyle = ":", linewidth = 2)
ax.grid(axis = "y", linestyle = "-.")
ax.set_axisbelow(True)
# plt.show()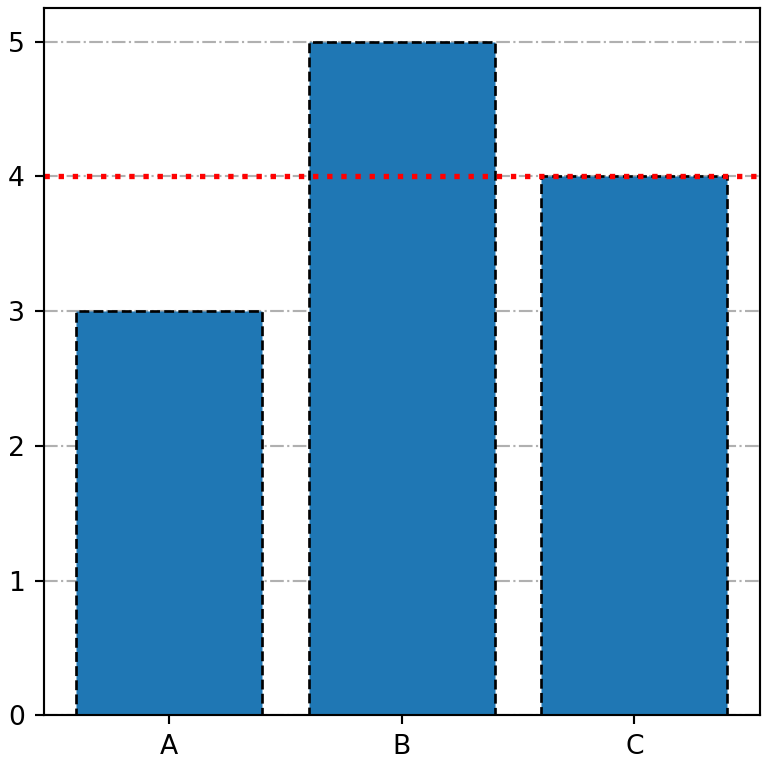
Learn more about how to customize grid lines and markers, or how to create a line chart in matplotlib.