Background color of the axes with set_facecolor
The background color of a matplotlib chart can be customized with the set_facecolor function. The only parameter required as input is the desired color for the background.
import numpy as np
import matplotlib.pyplot as plt

fig, ax = plt.subplots()
X, Y = np.mgrid[-4:4, -4:4]
ax.quiver(X, Y)

# Background color
ax.set_facecolor('lavender')

# plt.show()
Border color
In case you want to customize the border color of the graph you will need to set a color for each of the sides of the box. You can set colors one by one or use a for loop to set all borders at once as in the example below.
import numpy as np
import matplotlib.pyplot as plt

fig, ax = plt.subplots()
X, Y = np.mgrid[-4:4, -4:4]
ax.quiver(X, Y)

# Border color:
for axis in ['top', 'bottom', 'left', 'right']:
  ax.spines[axis].set_color('red')

# plt.show()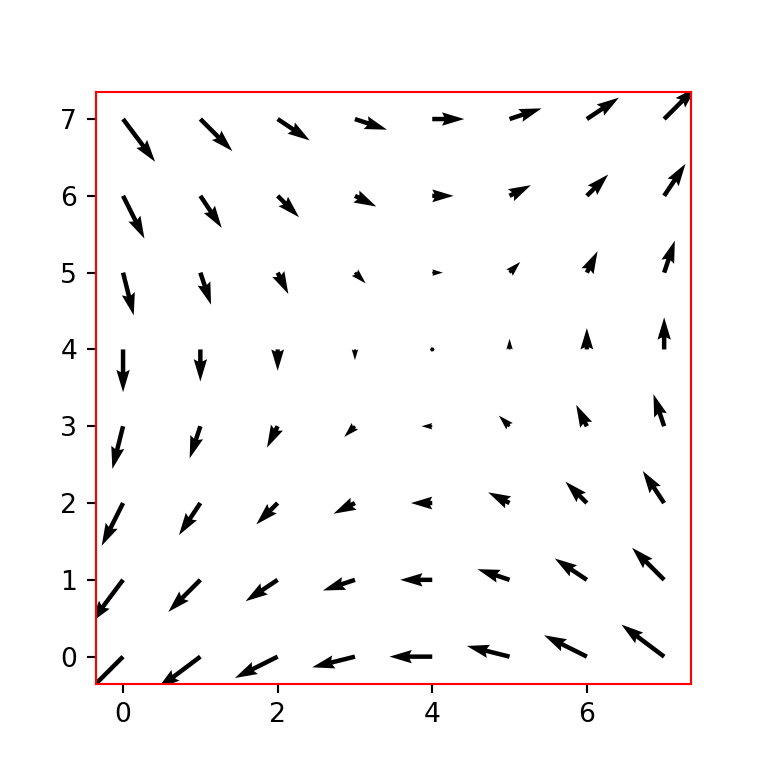
Background color of the figure
The background color of the figure can also be customized. For this purpose, you will need to set a new color to the figure (fig) with fig.set_facecolor, e.g. fig.set_facecolor("aliceblue") if you want to use the aliceblue color, or just input the desired color to the facecolor argument of the subplots function, as shown below.
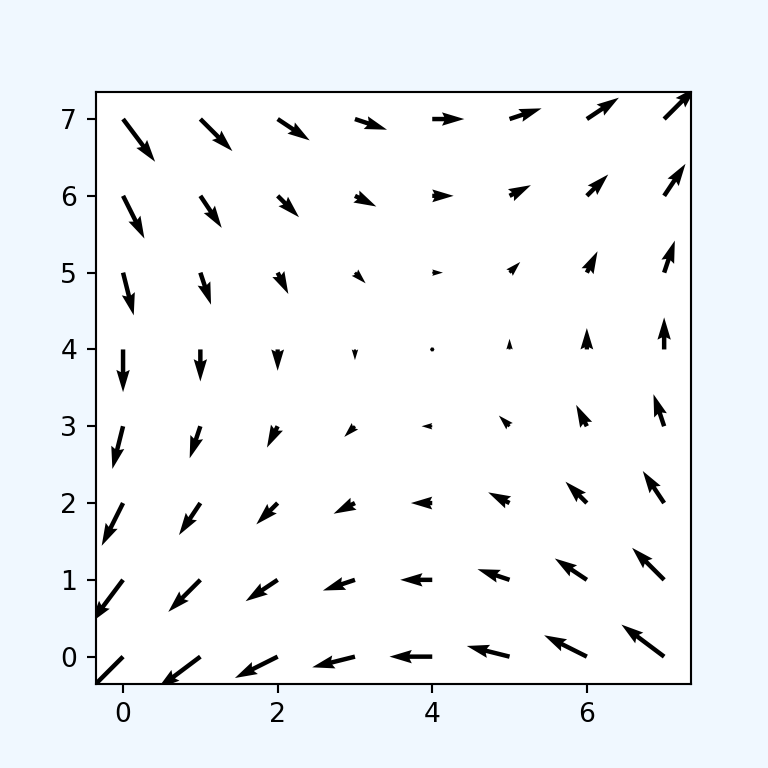
import numpy as np
import matplotlib.pyplot as plt
fig, ax = plt.subplots(facecolor = 'aliceblue')
X, Y = np.mgrid[-4:4, -4:4]
ax.quiver(X, Y)
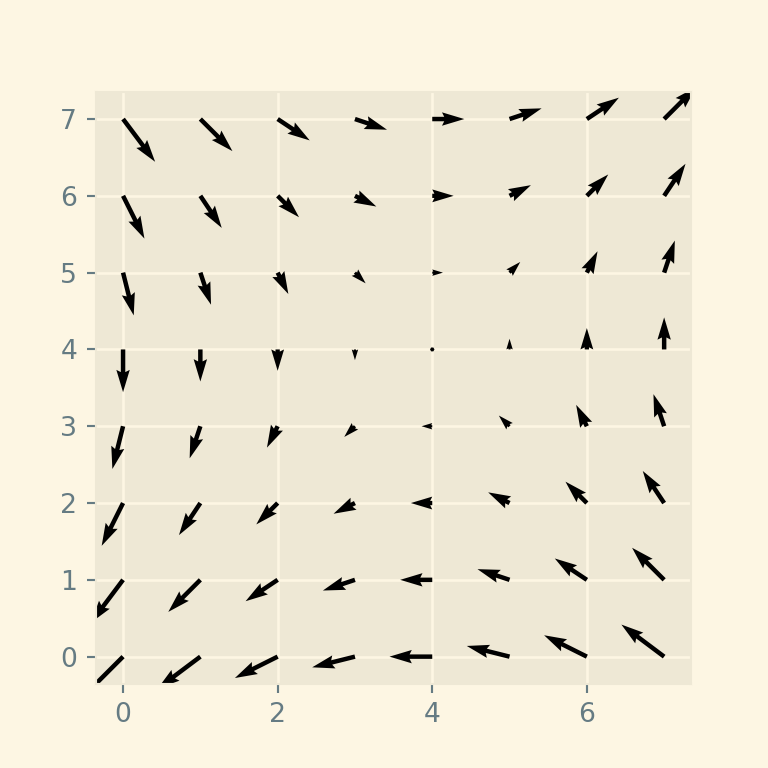
# plt.show()Change the background colors using predefined styles
Matplotlib provides several predefined styles or themes to customize the background colors. You will need to pass the desired style name to the style.use function, as in the following example. If you want to know the names of all the available styles type print(plt.style.available) after importing matplotlib.pyplot as plt.
import numpy as np
import matplotlib.pyplot as plt

# Using a style
plt.style.use('Solarize_Light2')

fig, ax = plt.subplots()
X, Y = np.mgrid[-4:4, -4:4]

# Plot
ax.quiver(X, Y)

# plt.show()