Matplotlib style sheet list
Matplotlib provides built-in style sheets to customize the appearance of the charts. You can list the available style sheets or themes importing matplotlib as plt and printing the following:
import matplotlib.pyplot as plt

print(plt.style.available)
The console will print the following style names:
['Solarize_Light2', '_classic_test_patch', '_mpl-gallery', '_mpl-gallery-nogrid', 'bmh',
'classic', 'dark_background', 'fast', 'fivethirtyeight', 'ggplot',
'grayscale', 'seaborn', 'seaborn-bright', 'seaborn-colorblind',
'seaborn-dark', 'seaborn-dark-palette', 'seaborn-darkgrid', 'seaborn-deep',
'seaborn-muted', 'seaborn-notebook', 'seaborn-paper', 'seaborn-pastel',
'seaborn-poster', 'seaborn-talk', 'seaborn-ticks', 'seaborn-white', 'seaborn-whitegrid',
'tableau-colorblind10']
Customizing matplotlib plots with styles
In order to set a matplotlib style you will need to use plt.style.use and select the desired theme. For instance, in the following block of code we are setting the 'Solarize_Light2' style.
import numpy as np
import matplotlib.pyplot as plt
from scipy.special import jv

plt.style.use("Solarize_Light2")

fig, ax = plt.subplots()
x = np.linspace(-10, 10, 100)

for i in range(0, 3):
  J = jv(i, x)
  ax.plot(x, J)

# plt.show()
plt.style.use will change the global styling for all plots.
Temporary or local style
It is important to note that using the previous code the styling will be applied not only to the first plot you create, but all the plots of the session. If you want to set a theme only for one chart or block of code you will need to use with plt.style.context("style_name"): as in the example below.
import numpy as np
import matplotlib.pyplot as plt
from scipy.special import jv

with plt.style.context("dark_background"):

  fig, ax = plt.subplots()
  x = np.linspace(-10, 10, 100)

  for i in range(0, 3):
    J = jv(i, x)
    ax.plot(x, J)

# plt.show()
Recovering the matplotlib default style after setting a style sheet
Nonetheless, if you have already set a theme and want to recover the default matplotlib settings you can call mpl.rcParams.update(mpl.rcParamsDefault) after importing matplotlib as mpl or a hidden style named "default".
import numpy as np
import matplotlib.pyplot as plt
from scipy.special import jv
import matplotlib as mpl

# Default settings
mpl.rcParams.update(mpl.rcParamsDefault)

plt.style.use("ggplot")

fig, ax = plt.subplots()
x = np.linspace(-10, 10, 100)

for i in range(0, 3):
  J = jv(i, x)
  ax.plot(x, J)

# plt.show()
Style samples
In the following examples you will see the rest of the available styles:
_classic_test_patch
import numpy as np
import matplotlib.pyplot as plt
from scipy.special import jv

plt.style.use("_classic_test_patch")

fig, ax = plt.subplots()
x = np.linspace(-10, 10, 100)

for i in range(0, 3):
  J = jv(i, x)
  ax.plot(x, J)

# plt.show()
_mpl-gallery
import numpy as np
import matplotlib.pyplot as plt
from scipy.special import jv

plt.style.use("_mpl-gallery")

fig, ax = plt.subplots()
x = np.linspace(-10, 10, 100)

for i in range(0, 3):
  J = jv(i, x)
  ax.plot(x, J)

# plt.show()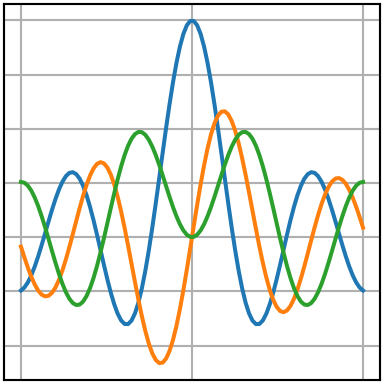
_mpl-gallery-nogrid
import numpy as np
import matplotlib.pyplot as plt
from scipy.special import jv

plt.style.use("_mpl-gallery-nogrid")

fig, ax = plt.subplots()
x = np.linspace(-10, 10, 100)

for i in range(0, 3):
  J = jv(i, x)
  ax.plot(x, J)

# plt.show()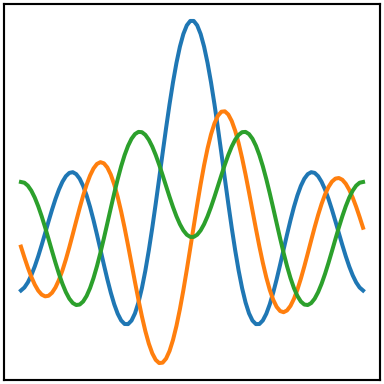
bmh
import numpy as np
import matplotlib.pyplot as plt
from scipy.special import jv

plt.style.use("bmh")

fig, ax = plt.subplots()
x = np.linspace(-10, 10, 100)

for i in range(0, 3):
  J = jv(i, x)
  ax.plot(x, J)

# plt.show()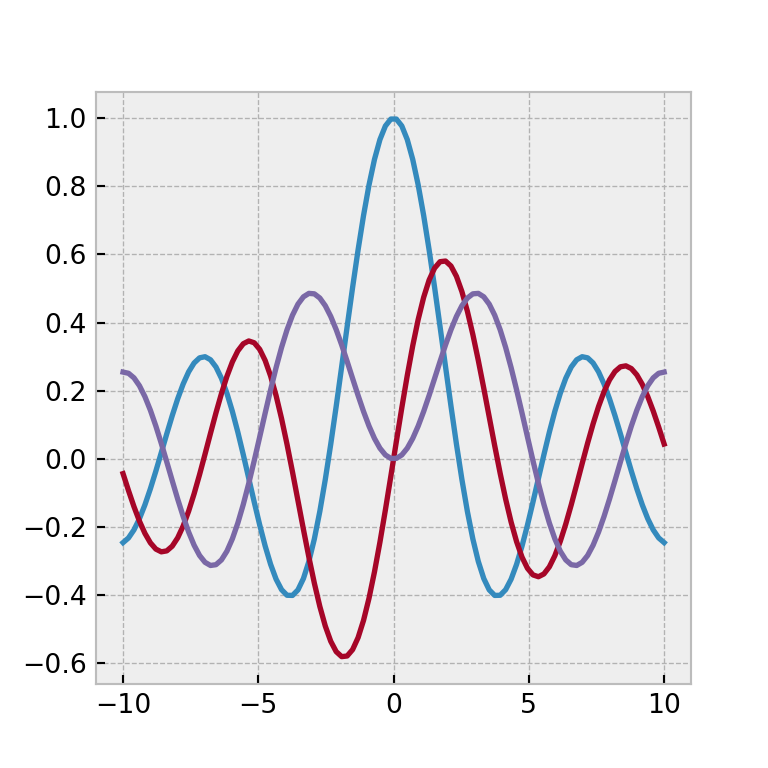
classic
import numpy as np
import matplotlib.pyplot as plt
from scipy.special import jv

plt.style.use("classic")

fig, ax = plt.subplots()
x = np.linspace(-10, 10, 100)

for i in range(0, 3):
  J = jv(i, x)
  ax.plot(x, J)

# plt.show()
fast
import numpy as np
import matplotlib.pyplot as plt
from scipy.special import jv

plt.style.use("fast")

fig, ax = plt.subplots()
x = np.linspace(-10, 10, 100)

for i in range(0, 3):
  J = jv(i, x)
  ax.plot(x, J)

# plt.show()
fivethirtyeight
import numpy as np
import matplotlib.pyplot as plt
from scipy.special import jv

plt.style.use("fivethirtyeight")

fig, ax = plt.subplots()
x = np.linspace(-10, 10, 100)

for i in range(0, 3):
  J = jv(i, x)
  ax.plot(x, J)

# plt.show()
grayscale
import numpy as np
import matplotlib.pyplot as plt
from scipy.special import jv

plt.style.use("grayscale")

fig, ax = plt.subplots()
x = np.linspace(-10, 10, 100)

for i in range(0, 3):
  J = jv(i, x)
  ax.plot(x, J)

# plt.show()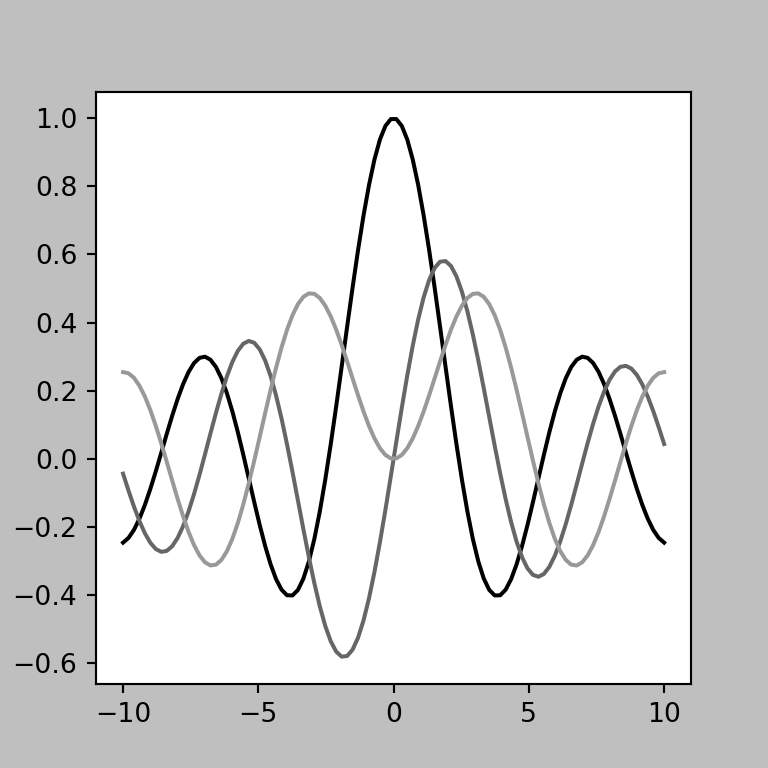
seaborn
import numpy as np
import matplotlib.pyplot as plt
from scipy.special import jv

plt.style.use("seaborn")

fig, ax = plt.subplots()
x = np.linspace(-10, 10, 100)

for i in range(0, 3):
  J = jv(i, x)
  ax.plot(x, J)

# plt.show()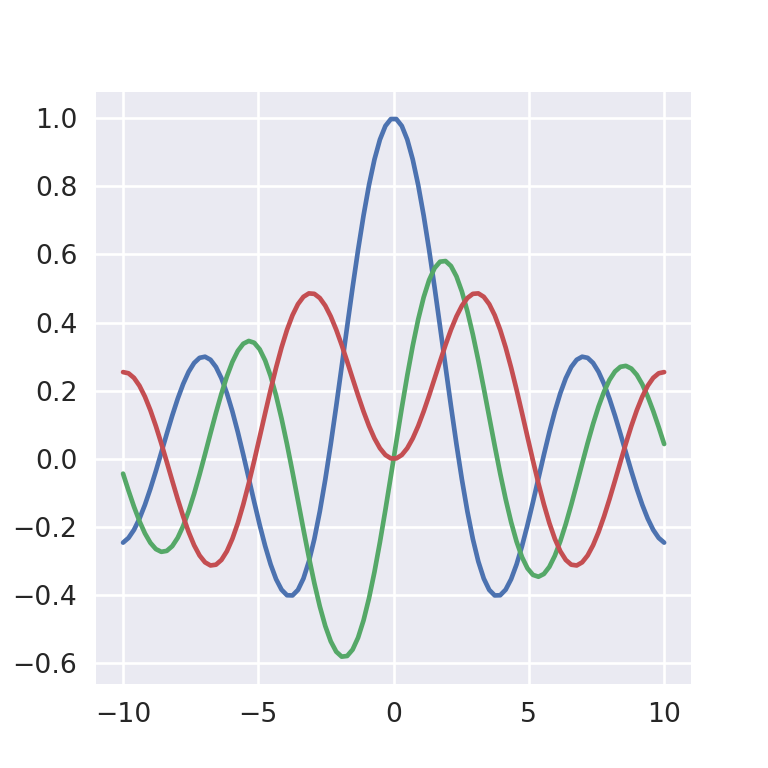
seaborn-bright
import numpy as np
import matplotlib.pyplot as plt
from scipy.special import jv

plt.style.use("seaborn-bright")

fig, ax = plt.subplots()
x = np.linspace(-10, 10, 100)

for i in range(0, 3):
  J = jv(i, x)
  ax.plot(x, J)

# plt.show()
seaborn-colorblind
import numpy as np
import matplotlib.pyplot as plt
from scipy.special import jv

plt.style.use("seaborn-colorblind")

fig, ax = plt.subplots()
x = np.linspace(-10, 10, 100)

for i in range(0, 3):
  J = jv(i, x)
  ax.plot(x, J)

# plt.show()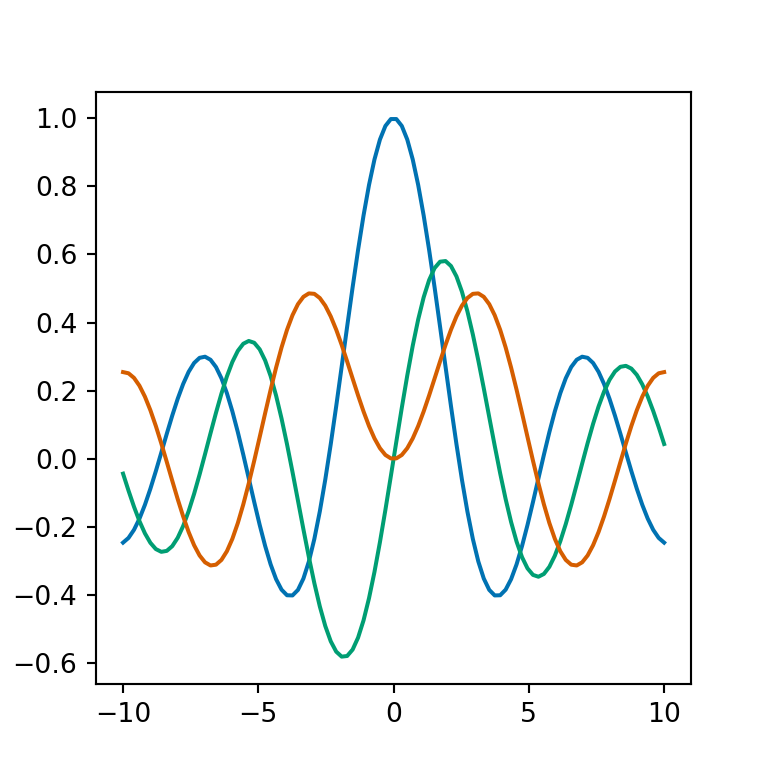
seaborn-dark
import numpy as np
import matplotlib.pyplot as plt
from scipy.special import jv

plt.style.use("seaborn-dark")

fig, ax = plt.subplots()
x = np.linspace(-10, 10, 100)

for i in range(0, 3):
  J = jv(i, x)
  ax.plot(x, J)

# plt.show()
seaborn-dark-palette
import numpy as np
import matplotlib.pyplot as plt
from scipy.special import jv

plt.style.use("seaborn-dark-palette")

fig, ax = plt.subplots()
x = np.linspace(-10, 10, 100)

for i in range(0, 3):
  J = jv(i, x)
  ax.plot(x, J)

# plt.show()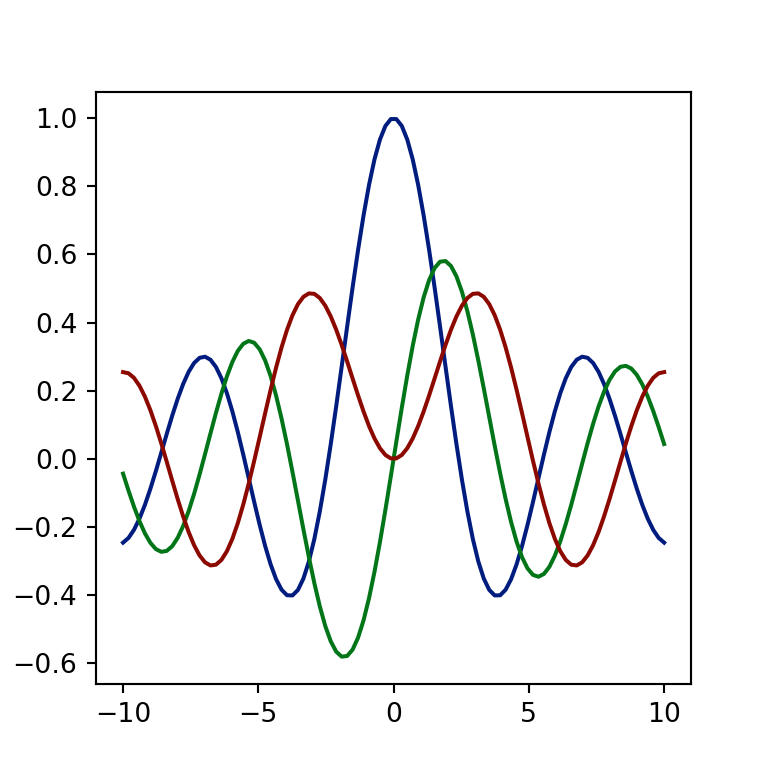
seaborn-darkgrid
import numpy as np
import matplotlib.pyplot as plt
from scipy.special import jv

plt.style.use("seaborn-darkgrid")

fig, ax = plt.subplots()
x = np.linspace(-10, 10, 100)

for i in range(0, 3):
  J = jv(i, x)
  ax.plot(x, J)

# plt.show()
seaborn-deep
import numpy as np
import matplotlib.pyplot as plt
from scipy.special import jv

plt.style.use("seaborn-deep")

fig, ax = plt.subplots()
x = np.linspace(-10, 10, 100)

for i in range(0, 3):
  J = jv(i, x)
  ax.plot(x, J)

# plt.show()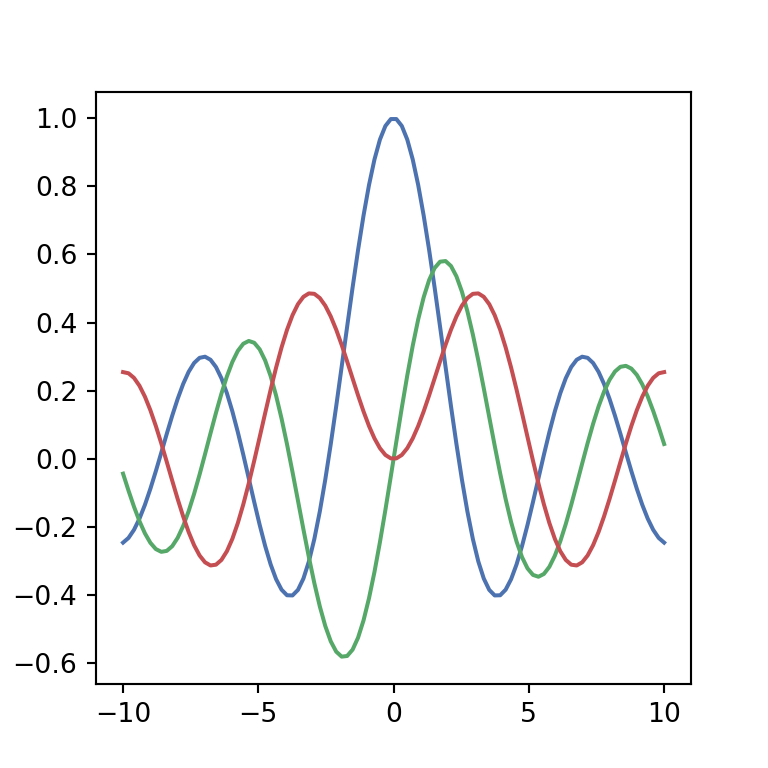
seaborn-muted
import numpy as np
import matplotlib.pyplot as plt
from scipy.special import jv

plt.style.use("seaborn-deep")

fig, ax = plt.subplots()
x = np.linspace(-10, 10, 100)

for i in range(0, 3):
  J = jv(i, x)
  ax.plot(x, J)

# plt.show()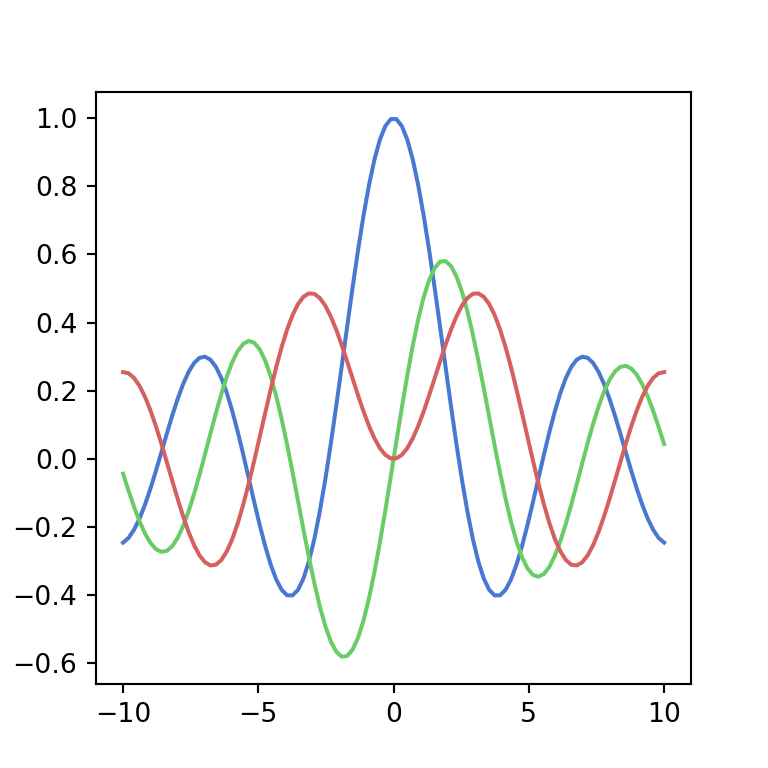
seaborn-notebook
import numpy as np
import matplotlib.pyplot as plt
from scipy.special import jv

plt.style.use("seaborn-notebook")

fig, ax = plt.subplots()
x = np.linspace(-10, 10, 100)

for i in range(0, 3):
  J = jv(i, x)
  ax.plot(x, J)

# plt.show()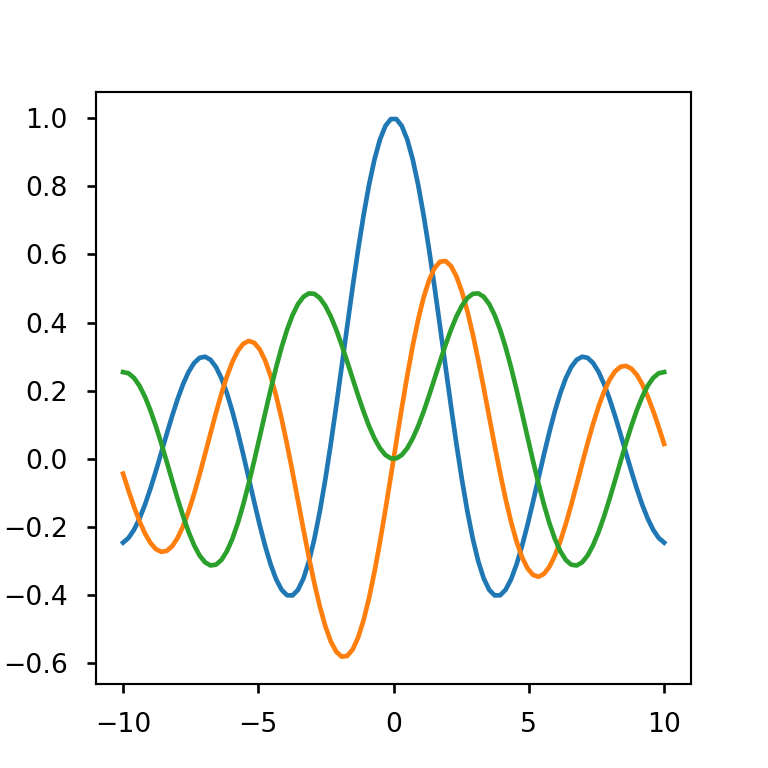
seaborn-paper
import numpy as np
import matplotlib.pyplot as plt
from scipy.special import jv

plt.style.use("seaborn-paper")

fig, ax = plt.subplots()
x = np.linspace(-10, 10, 100)

for i in range(0, 3):
  J = jv(i, x)
  ax.plot(x, J)

# plt.show()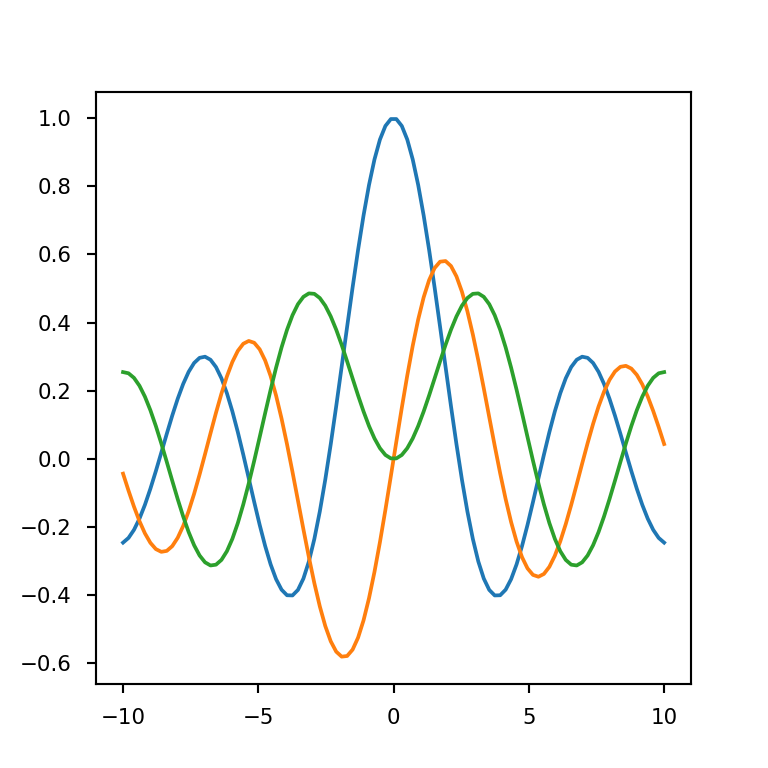
seaborn-pastel
import numpy as np
import matplotlib.pyplot as plt
from scipy.special import jv

plt.style.use("seaborn-pastel")

fig, ax = plt.subplots()
x = np.linspace(-10, 10, 100)

for i in range(0, 3):
  J = jv(i, x)
  ax.plot(x, J)

# plt.show()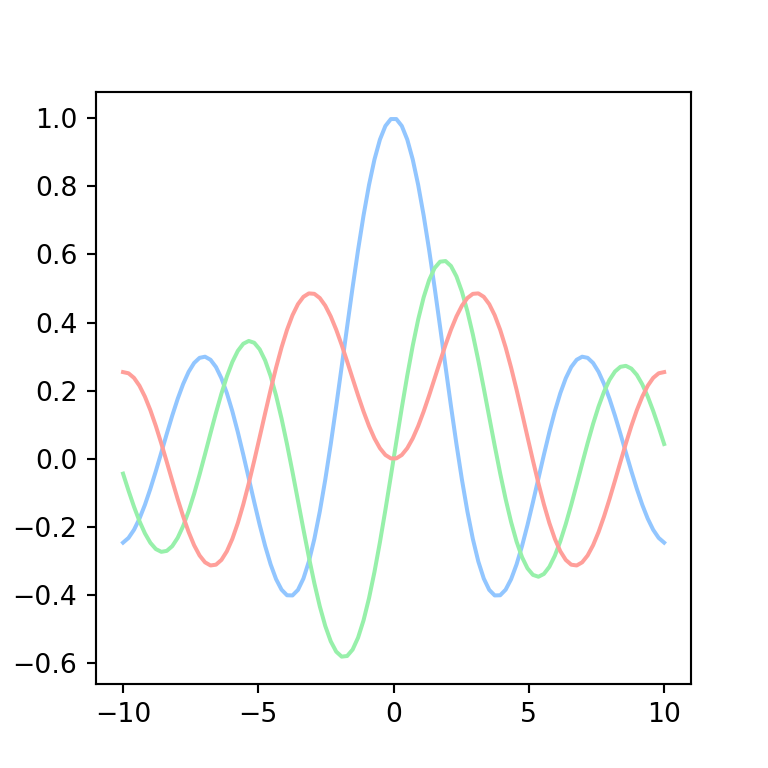
seaborn-poster
import numpy as np
import matplotlib.pyplot as plt
from scipy.special import jv

plt.style.use("seaborn-poster")

fig, ax = plt.subplots()
x = np.linspace(-10, 10, 100)

for i in range(0, 3):
  J = jv(i, x)
  ax.plot(x, J)

# plt.show()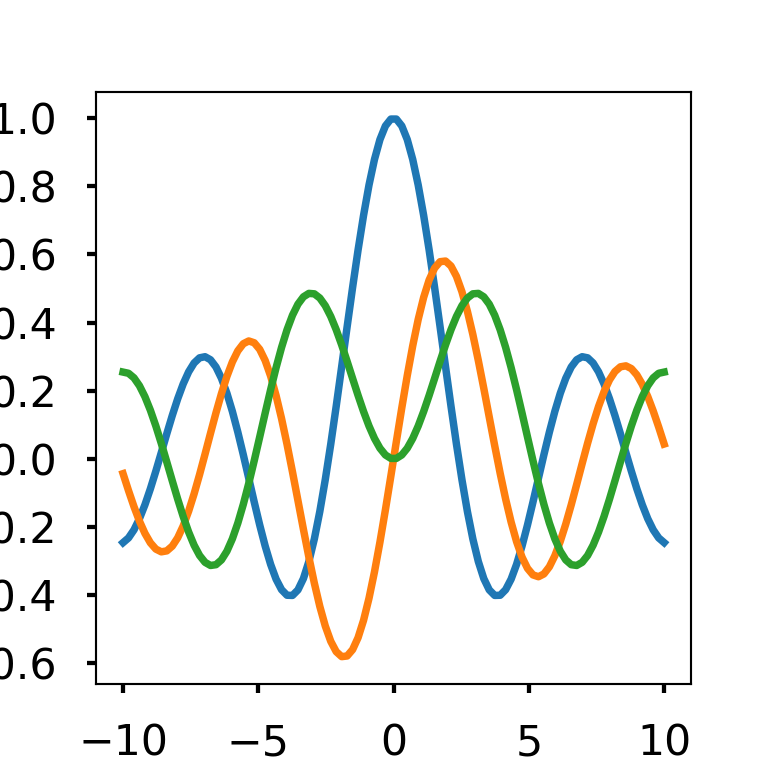
seaborn-talk
import numpy as np
import matplotlib.pyplot as plt
from scipy.special import jv

plt.style.use("seaborn-talk")

fig, ax = plt.subplots()
x = np.linspace(-10, 10, 100)

for i in range(0, 3):
  J = jv(i, x)
  ax.plot(x, J)

# plt.show()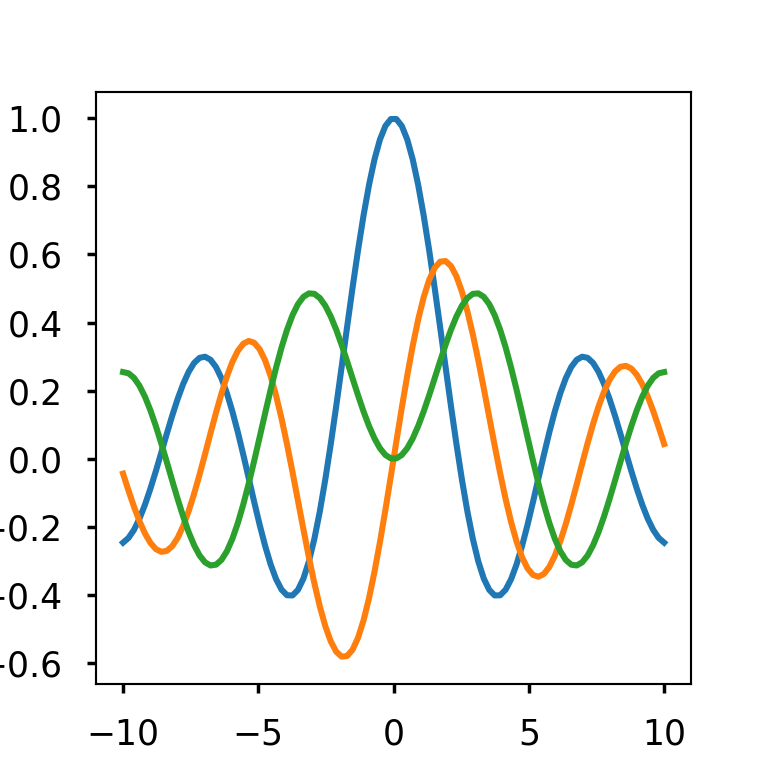
seaborn-ticks
import numpy as np
import matplotlib.pyplot as plt
from scipy.special import jv

plt.style.use("seaborn-ticks")

fig, ax = plt.subplots()
x = np.linspace(-10, 10, 100)

for i in range(0, 3):
  J = jv(i, x)
  ax.plot(x, J)

# plt.show()
seaborn-white
import numpy as np
import matplotlib.pyplot as plt
from scipy.special import jv

plt.style.use("seaborn-white")

fig, ax = plt.subplots()
x = np.linspace(-10, 10, 100)

for i in range(0, 3):
  J = jv(i, x)
  ax.plot(x, J)

# plt.show()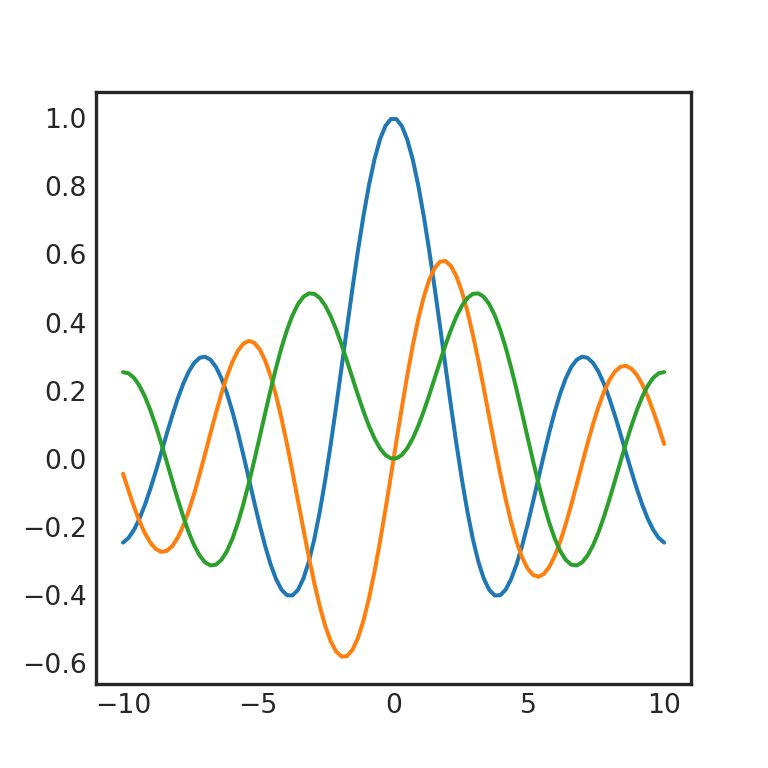
seaborn-whitegrid
import numpy as np
import matplotlib.pyplot as plt
from scipy.special import jv

plt.style.use("seaborn-whitegrid")

fig, ax = plt.subplots()
x = np.linspace(-10, 10, 100)

for i in range(0, 3):
  J = jv(i, x)
  ax.plot(x, J)

# plt.show()
tableau-colorblind10
import numpy as np
import matplotlib.pyplot as plt
from scipy.special import jv

plt.style.use("tableau-colorblind10")

fig, ax = plt.subplots()
x = np.linspace(-10, 10, 100)

for i in range(0, 3):
  J = jv(i, x)
  ax.plot(x, J)

# plt.show()
Creating your own styles
It is possible to create your own styles or customize any style you want.
Customizing a style
Consider that you like the "fivethirtyeight" style, but you want to customize some of its features. In this scenario you can use rcParams to change the desired parameters as in the example below.

import numpy as np
import matplotlib.pyplot as plt
from scipy.special import jv
import matplotlib as mpl

plt.style.use("fivethirtyeight")

mpl.rcParams['font.size'] = 5
mpl.rcParams['grid.color'] = "black"

fig, ax = plt.subplots()
x = np.linspace(-10, 10, 100)

for i in range(0, 3):
  J = jv(i, x)
  ax.plot(x, J)

plt.show()
Create a new style
If you want to create a new style you will need to create a .mplstyle file. For instance, you might want to create a style named mystyle with the styling of the following block of code and save it inside a folder named styles under your working environment, e.g. ./styles/mystyle.mplstyle. Recall to call mpl.rcParams for a list of params.
# mystyle.mplstyle

font.size: 5.0,
axes.facecolor: 'lavender',
lines.linewidth : 3
lines.linestyle: '-'
lines.color: 'red'
In this scenario, you can call the style with the following line:
import numpy as np
import matplotlib.pyplot as plt
from scipy.special import jv

plt.style.use("./styles/mystyle.mplstyle")

# Plot
# ...
Note that you can also call a style sheet from a URL.
Alternatively, you can save your style into mpl_configdir/stylelib. You will find where that folders are calling mpl.get_configdir() after importing matplotlib as mpl. If the folders doesn’t exist, you might need to create them. Then, you will be able to call your styles by their name, e.g. plt.style.use("mystyle").
More themes
If you don’t want to create a new style and all the built-in styles doesn’t fit your needs you will find lots of styles available online. Take a look for instance to this GitHub repository. Using one of these styles is straightforward, as you can input an URL as a style:
Example 1
import numpy as np
import matplotlib.pyplot as plt
from scipy.special import jv

plt.style.use('https://github.com/dhaitz/matplotlib-stylesheets/raw/master/pitayasmoothie-light.mplstyle')

fig, ax = plt.subplots()
x = np.linspace(-10, 10, 100)

for i in range(0, 3):
  J = jv(i, x)
  ax.plot(x, J)

plt.show()
Example 2
import numpy as np
import matplotlib.pyplot as plt
from scipy.special import jv

plt.style.use('https://github.com/dhaitz/matplotlib-stylesheets/raw/master/pitayasmoothie-dark.mplstyle')

fig, ax = plt.subplots()
x = np.linspace(-10, 10, 100)

for i in range(0, 3):
  J = jv(i, x)
  ax.plot(x, J)

plt.show()


