Adding texts in matplotlib with text and figtext
It is possible to add texts over matplotlib charts by using the text and figtext functions. The main difference between these two functions is that the first can be used to add texts inside the plot axes while the second can be used to add text to the figure.
Adding a basic text
The text function needs at least three parameters: the coordinates (x, y) and the desired text string, as shown in the example below.
import numpy as np
import matplotlib.pyplot as plt

fig, ax = plt.subplots()
ax.plot(np.sin(np.linspace(0, 10)))
plt.text(20, 0.5, 'Text') # Coordinates and text

plt.show()
Position based on the axes
An alternative of positioning the texts by coordinates is positioning them relative to the axes on a scale from 0 to 1 with transform = ax.transAxes.
import numpy as np
import matplotlib.pyplot as plt

fig, ax = plt.subplots()
ax.plot(np.sin(np.linspace(0, 10)))
plt.text(0.5, 0.5, 'Center', transform = ax.transAxes)
plt.text(0.05, 0.05, 'Bottom-left', transform = ax.transAxes)
plt.text(0.8, 0.85, 'Top-right', transform = ax.transAxes)
plt.text(0.8, 0.05, 'Bottom-right', transform = ax.transAxes)
plt.text(0.05, 0.85, 'Top-left', transform = ax.transAxes)

# plt.show()
In the following subsections we are going to highlight some of the most common customizations, but recall to read the documentation of the function for more advanced settings.
Color
With the color argument it is possible to change the default color of the text passing the new desired color as input.
import numpy as np
import matplotlib.pyplot as plt

fig, ax = plt.subplots()
ax.plot(np.sin(np.linspace(0, 10)))
plt.text(20, 0.5, 'Text', color = "green")

# plt.show()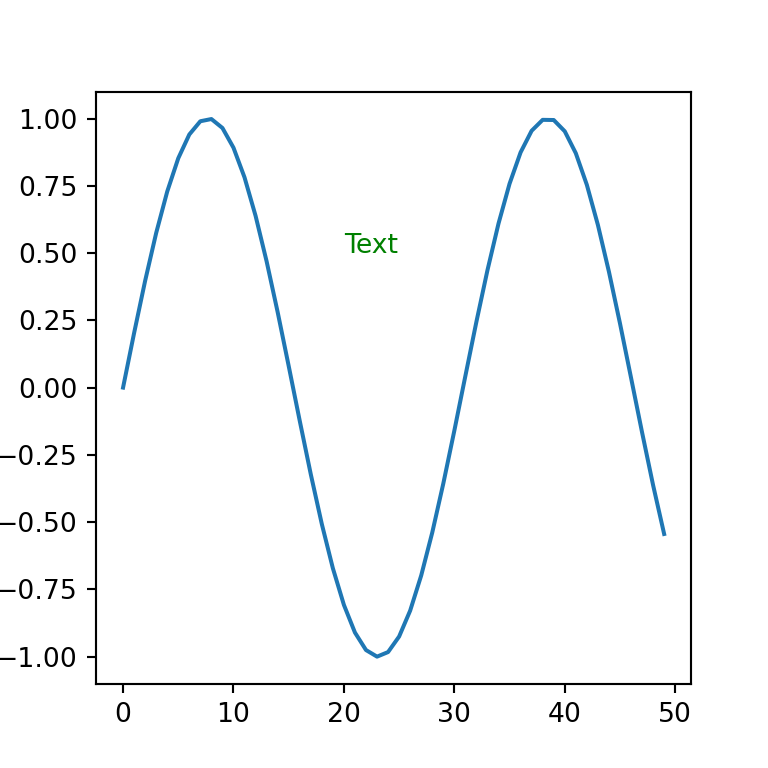
Font size
If the font size is too small or too big it can be adjusted with the fontsize argument.
import numpy as np
import matplotlib.pyplot as plt

fig, ax = plt.subplots()
ax.plot(np.sin(np.linspace(0, 10)))
plt.text(20, 0.5, 'Text', fontsize = 16)

# plt.show()
Text alignment
The text function allows adjusting both the vertical and horizontal alignment of the text with verticalalignment or va (possible values are 'center', 'top', 'bottom', 'baseline' or 'center_baseline') and horizontalalignment or ha (possible values are 'center', 'right' o 'left'), respectively.
import numpy as np
import matplotlib.pyplot as plt

fig, ax = plt.subplots()
ax.plot(np.sin(np.linspace(0, 10)))
plt.text(20, 0.5, 'Text',
         verticalalignment = 'bottom',
         horizontalalignment = 'right')

# plt.show()
Text rotation
The rotation argument allows setting the rotation angle of the text or setting it as vertical or horizontal.
import numpy as np
import matplotlib.pyplot as plt

fig, ax = plt.subplots()
ax.plot(np.sin(np.linspace(0, 10)))
plt.text(20, 0.5, 'Text', rotation = 45)

# plt.show()
Text inside a box
Passing a dictionary to the bbox argument of the text function the text will be displayed inside a box, as in the example below.
import numpy as np
import matplotlib.pyplot as plt

fig, ax = plt.subplots()
ax.plot(np.sin(np.linspace(0, 10)))
plt.text(20, 0.5, 'Text', bbox = {'facecolor': 'oldlace', 'alpha': 0.5, 'pad': 8})

# plt.show()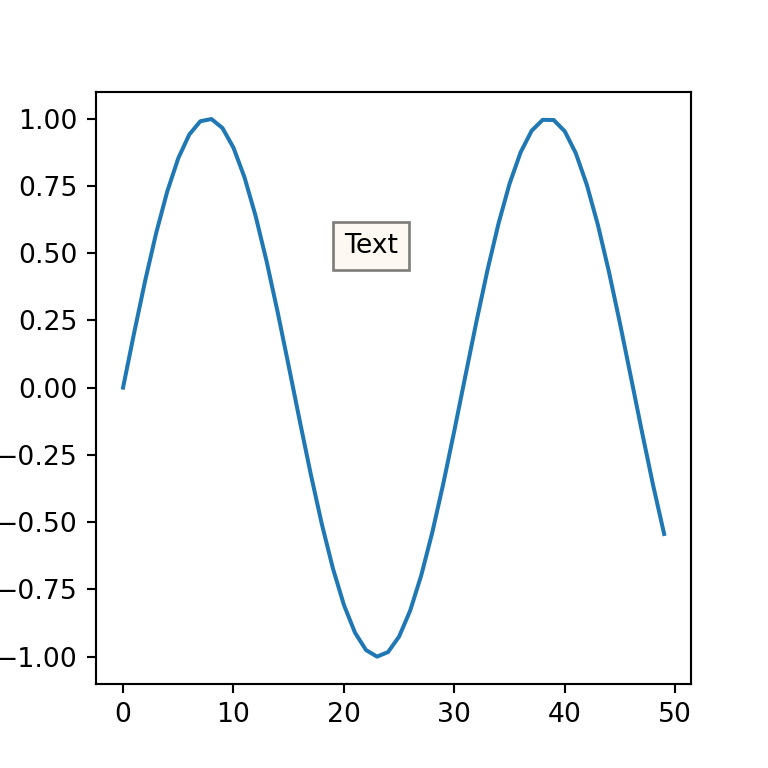
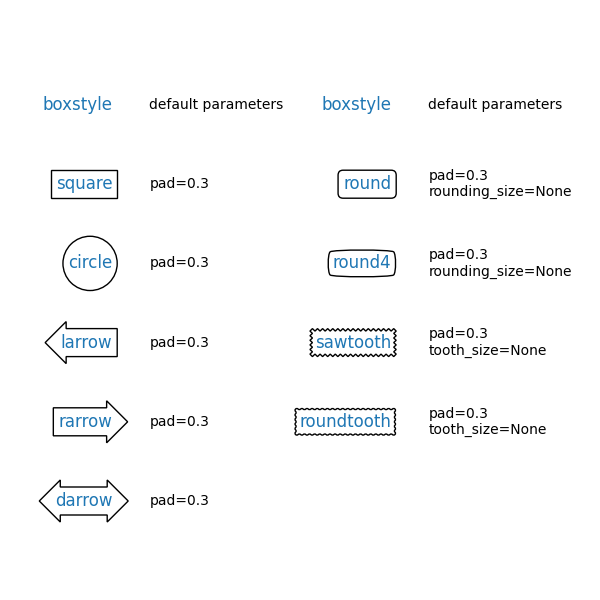
In addition, it is possible to customize the style of the box with boxstyle key of the bbox dict, as shown in the example below.
import numpy as np
import matplotlib.pyplot as plt

fig, ax = plt.subplots()
ax.plot(np.sin(np.linspace(0, 10)))
plt.text(20, 0.5, 'Text inside box', bbox = {'facecolor': 'oldlace', 'alpha': 0.5, 'boxstyle': "rarrow,pad=0.3", 'ec': 'red'})

# plt.show()
In the previous example we used the rarrow box style. The following are all the possible box styles and their default parameters:
Text at an arbitrary location of the figure
Similar to the previous function, the figtext function can be used to add text to the figure. Recall that it is possible to customize the text the same way as in the previous function. Read the documentation for further details.
import numpy as np
import matplotlib.pyplot as plt

fig, (ax1, ax2) = plt.subplots(1, 2)
ax1.plot(np.sin(np.linspace(0, 10)))
ax2.plot(np.sin(np.linspace(0, 10)))
plt.figtext(0.5, 0.9, 'Figure text')

# plt.show()
Annotations and arrows with annotate
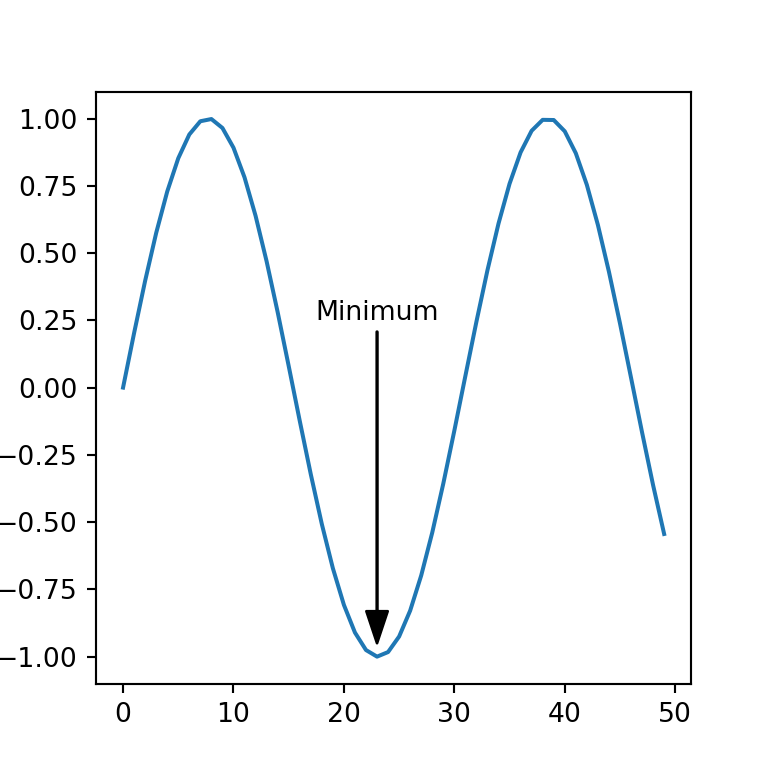
Annotations are similar to basic texts, but the annotate function provides further parameters to annotate specific parts of the plot with arrows. If you don’t want to use arrows probably your best choice is to use text.
In order to add text annotations to a matplotlib chart you will need to set at least, the text, the coordinates of the plot to be highlighted with an arrow (xy), the coordinates of the text (xytext) and the properties of the arrow (arrowprops).
import numpy as np
import matplotlib.pyplot as plt

fig, ax = plt.subplots()
ax.plot(np.sin(np.linspace(0, 10)))
plt.annotate('Minimum',
             xy = (23, -0.95),
             xytext = (23, 0.25),
             arrowprops = dict(facecolor = 'black', width = 0.2, headwidth = 8),
             horizontalalignment = 'center')

# plt.show()
The coordinates of the previous example are in data coordinates, but the annotate function allows specifying custom system coordinates for the arrow and for the text with xycoords and textcoords, respectively. Possible options are 'figure points', 'figure pixels', 'figure fraction', 'axes points', 'axes pixels', 'axes fraction', 'data', among others. Read the documentation of the function for more details.
Arrow without text
In case you only want to add an arrow but no text just left the string empty and the arrow will be created without any text.
![]()
import numpy as np
import matplotlib.pyplot as plt

fig, ax = plt.subplots()
ax.plot(np.sin(np.linspace(0, 10)))
plt.annotate('',
             xy = (23, -0.95),
             xytext = (23, 0.25),
             arrowprops = dict(facecolor = 'red', width = 0.4, headwidth = 8))

# plt.show()


