Reference lines highlight important values in a chart, such as a mean, a target or a threshold. Matplotlib provides functions for horizontal, vertical and diagonal lines and for shaded regions.
Horizontal and vertical lines with axhline and axvline
axhline draws a horizontal line at a given Y value and axvline a vertical line at a given X value. The lines span the whole plot, regardless of the axis limits.
import numpy as np
import matplotlib.pyplot as plt

months = np.arange(1, 25)
revenue = 50 + months * 2 + np.random.default_rng(9).normal(0, 6, 24)

fig, ax = plt.subplots()
ax.plot(months, revenue, color = "black")

ax.axhline(y = 80, color = "red", linestyle = "--", label = "Target")
ax.axvline(x = 12, color = "green", linewidth = 2, label = "New product")
ax.legend()
# plt.show()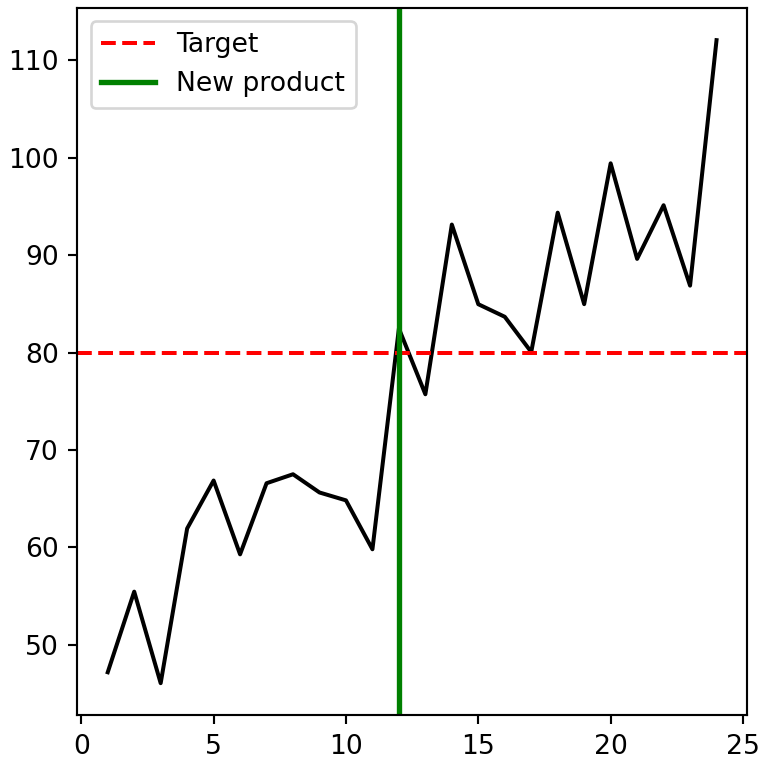
Partial lines
The xmin and xmax arguments of axhline (and ymin and ymax of axvline) limit the length of the line. They are fractions of the axes between 0 and 1, not data values.
import numpy as np
import matplotlib.pyplot as plt

months = np.arange(1, 25)
revenue = 50 + months * 2 + np.random.default_rng(9).normal(0, 6, 24)

fig, ax = plt.subplots()
ax.plot(months, revenue)

ax.axhline(y = 70, xmin = 0.25, xmax = 0.75, color = "black")
# plt.show()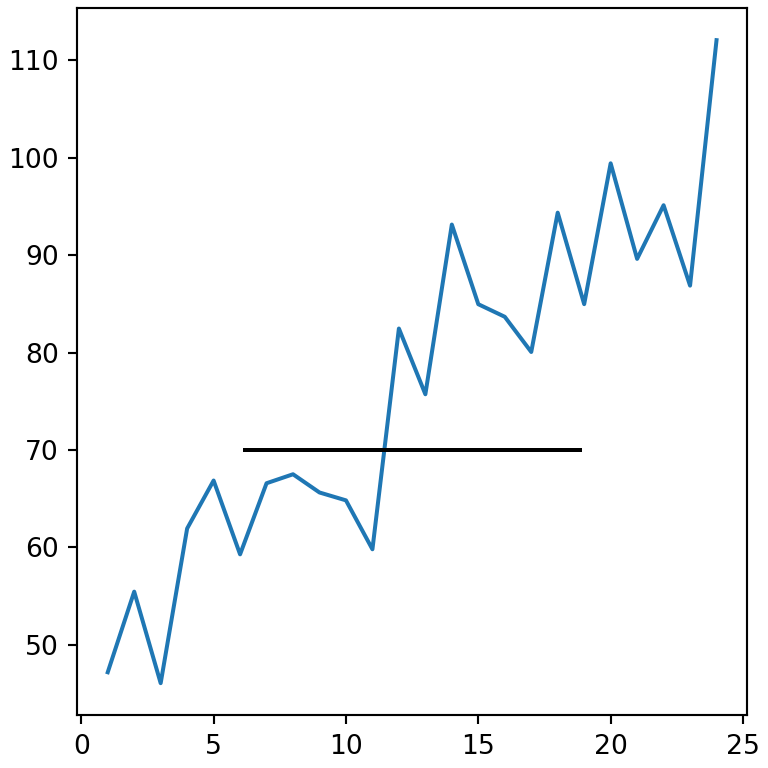
Several lines with hlines and vlines
hlines and vlines draw several lines at once between the data limits you specify, and each line can have its own color.
import numpy as np
import matplotlib.pyplot as plt

months = np.arange(1, 25)
revenue = 50 + months * 2 + np.random.default_rng(9).normal(0, 6, 24)

fig, ax = plt.subplots()
ax.plot(months, revenue)

ax.hlines(y = [60, 80, 100], xmin = 1, xmax = 24,
          colors = ["tab:red", "gray", "tab:green"], linestyles = ":")
# plt.show()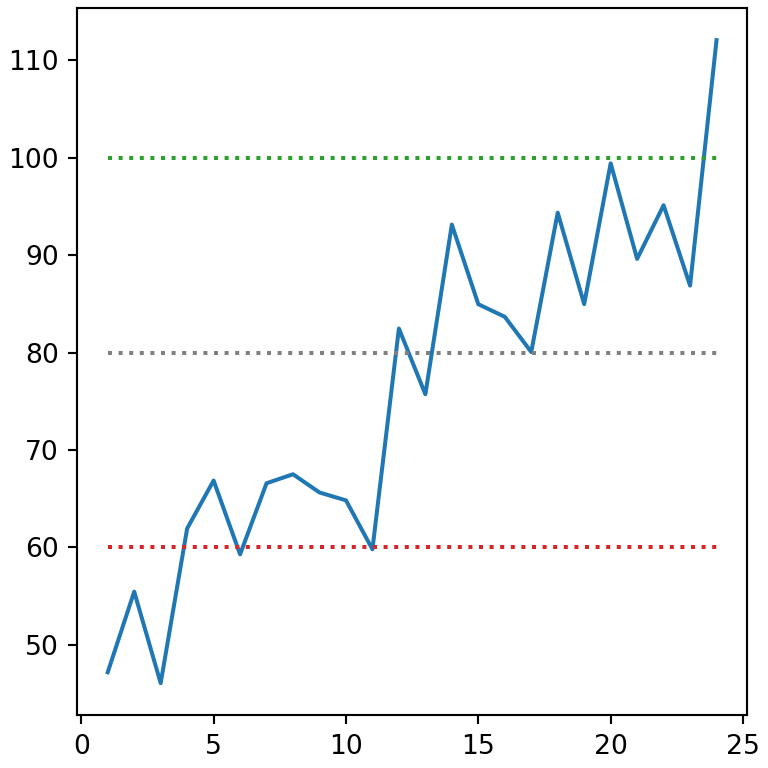
Lines with any slope with axline
axline draws an infinite line through two points or through one point with a given slope. It is useful to add a diagonal reference line, for example y = x in a scatter plot.
import numpy as np
import matplotlib.pyplot as plt

rng = np.random.default_rng(1)
x = rng.uniform(0, 10, 50)
y = x + rng.normal(0, 1, 50)

fig, ax = plt.subplots()
ax.scatter(x, y)

ax.axline((0, 0), slope = 1, color = "red")
# plt.show()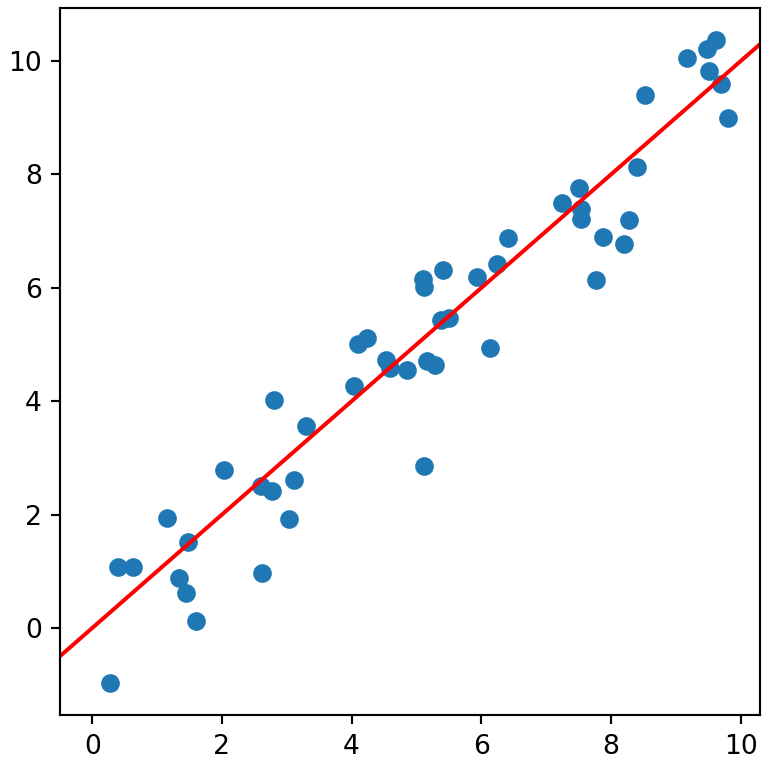
Shaded regions with axhspan and axvspan
axhspan and axvspan shade a horizontal or a vertical band. Use alpha so the data remains visible.
import numpy as np
import matplotlib.pyplot as plt

months = np.arange(1, 25)
revenue = 50 + months * 2 + np.random.default_rng(9).normal(0, 6, 24)

fig, ax = plt.subplots()
ax.plot(months, revenue)

ax.axvspan(6, 9, color = "orange", alpha = 0.3)
ax.axhspan(75, 85, color = "gray", alpha = 0.2)
# plt.show()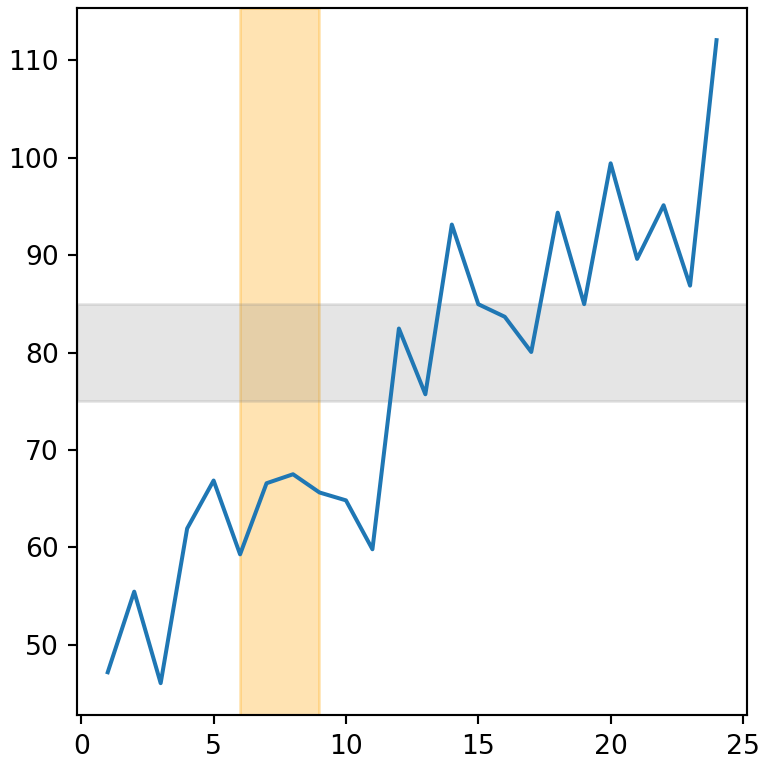
Area between curves
To shade the area between two curves, or between a curve and a value, use fill_between. The where argument fills only the regions that meet a condition.
import numpy as np
import matplotlib.pyplot as plt

months = np.arange(1, 25)
revenue = 50 + months * 2 + np.random.default_rng(9).normal(0, 6, 24)

fig, ax = plt.subplots()
ax.plot(months, revenue)

ax.fill_between(months, revenue, 80, where = revenue > 80,
                color = "tab:green", alpha = 0.3)
# plt.show()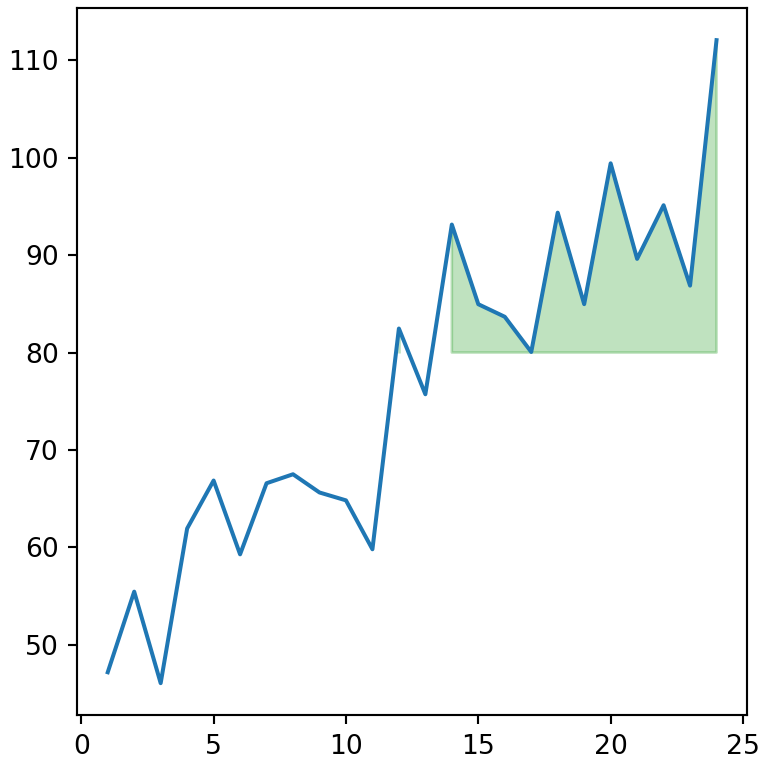
Add a label to a reference line
Add a label to show the line in the legend, or write a text next to it with text.
import numpy as np
import matplotlib.pyplot as plt

values = np.random.default_rng(4).normal(50, 10, 200)

fig, ax = plt.subplots()
ax.hist(values, color = "lightgray")

ax.axvline(values.mean(), color = "red", label = "Mean")
ax.text(values.mean() + 1, 45, f"{values.mean():.1f}", color = "red")
ax.legend()
# plt.show()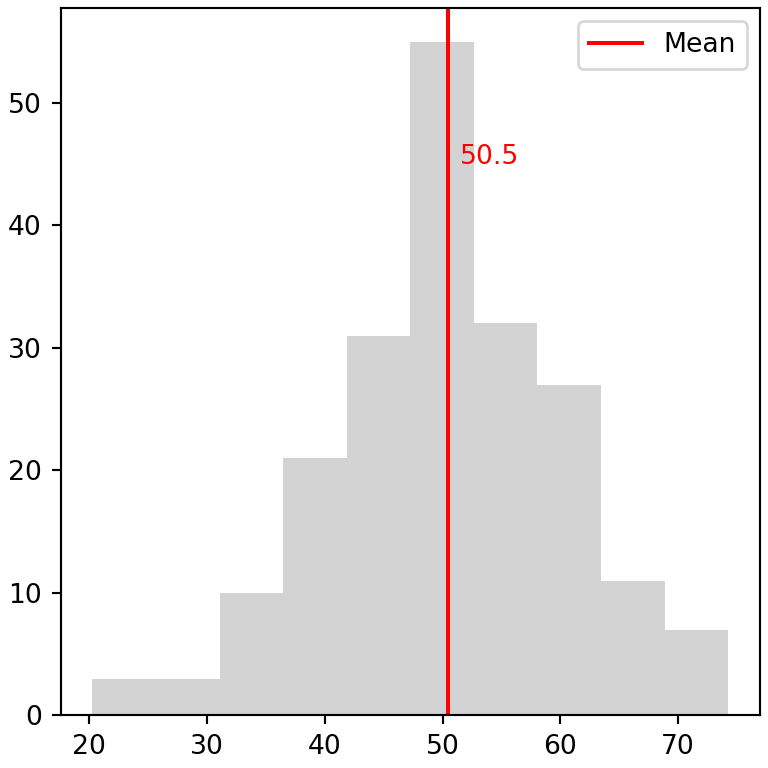
You can customize the style of the lines with the arguments explained in the line styles tutorial. To add arrows and annotations see the texts and annotations tutorial.