The axes of a matplotlib chart are made of a label, the limits, the ticks with their labels and the lines that surround the plot (spines). This guide explains how to customize each of these elements.
Axis labels
Add a label to the X and Y axes with plt.xlabel and plt.ylabel or with the set_xlabel and set_ylabel methods of the axes.
import numpy as np
import matplotlib.pyplot as plt

rng = np.random.default_rng(3)
day = np.arange(1, 366)
temp = 15 + 10 * np.sin((day - 110) / 365 * 2 * np.pi) + rng.normal(0, 2, 365)

fig, ax = plt.subplots()
ax.plot(day, temp)

ax.set_xlabel("Day of the year")
ax.set_ylabel("Temperature (ºC)")
# plt.show()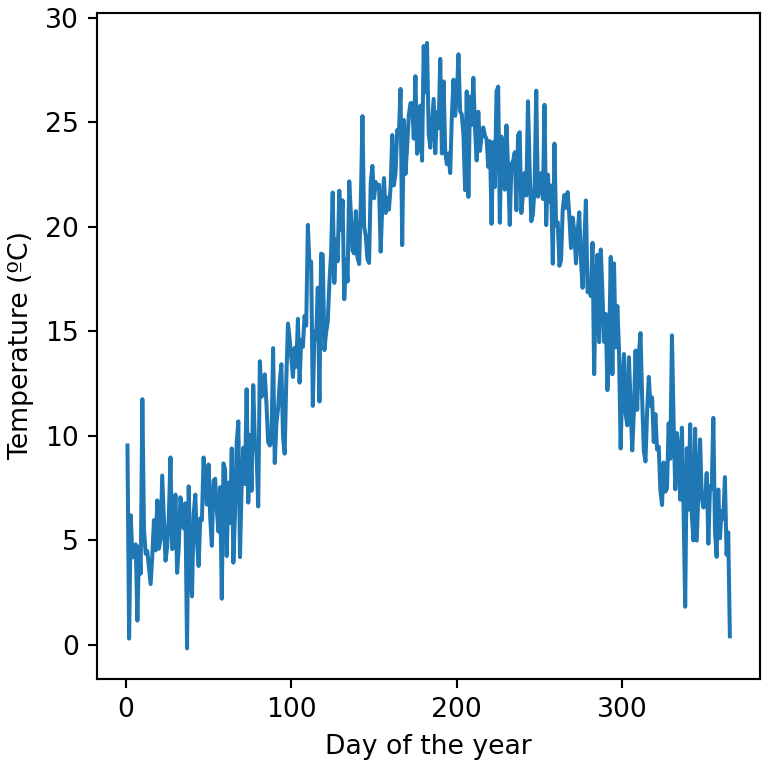
Label size, color and distance
The text arguments fontsize, color or fontweight change the style of the labels, labelpad the distance to the axis and loc their position ("left", "center" or "right" for the X axis and "bottom", "center" or "top" for the Y axis).
import numpy as np
import matplotlib.pyplot as plt

rng = np.random.default_rng(3)
day = np.arange(1, 366)
temp = 15 + 10 * np.sin((day - 110) / 365 * 2 * np.pi) + rng.normal(0, 2, 365)

fig, ax = plt.subplots()
ax.plot(day, temp)

ax.set_xlabel("Day of the year", fontsize = 14, color = "tab:red", loc = "right")
ax.set_ylabel("Temperature (ºC)", fontweight = "bold", labelpad = 15)
# plt.show()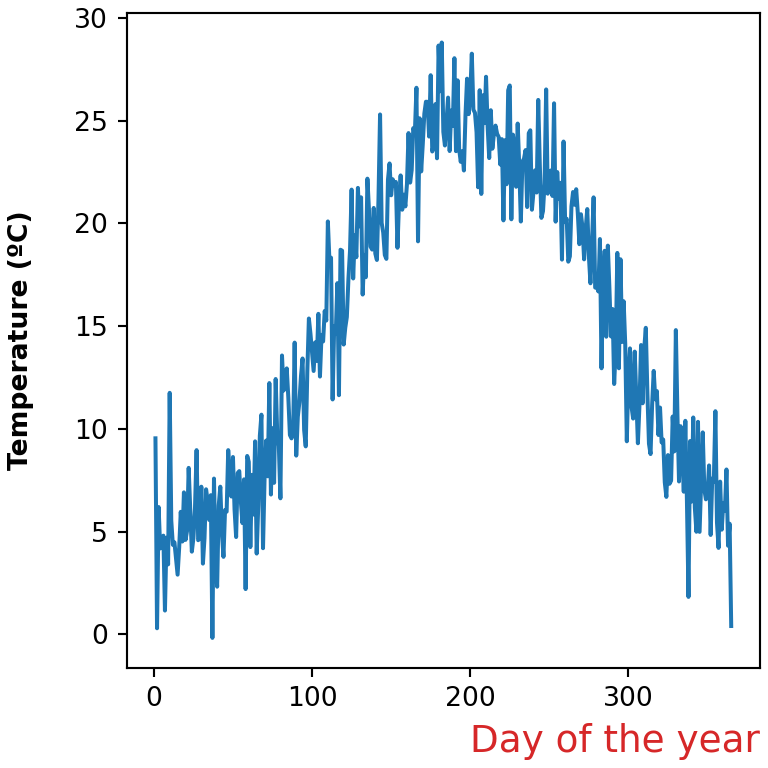
Axis limits
Matplotlib sets the limits automatically based on the data. Change them with set_xlim and set_ylim (or plt.xlim and plt.ylim). You can also set only one of the limits, such as ax.set_ylim(bottom = 0).
import numpy as np
import matplotlib.pyplot as plt

rng = np.random.default_rng(3)
day = np.arange(1, 366)
temp = 15 + 10 * np.sin((day - 110) / 365 * 2 * np.pi) + rng.normal(0, 2, 365)

fig, ax = plt.subplots()
ax.plot(day, temp)

ax.set_xlim(1, 180)
ax.set_ylim(-5, 35)
# plt.show()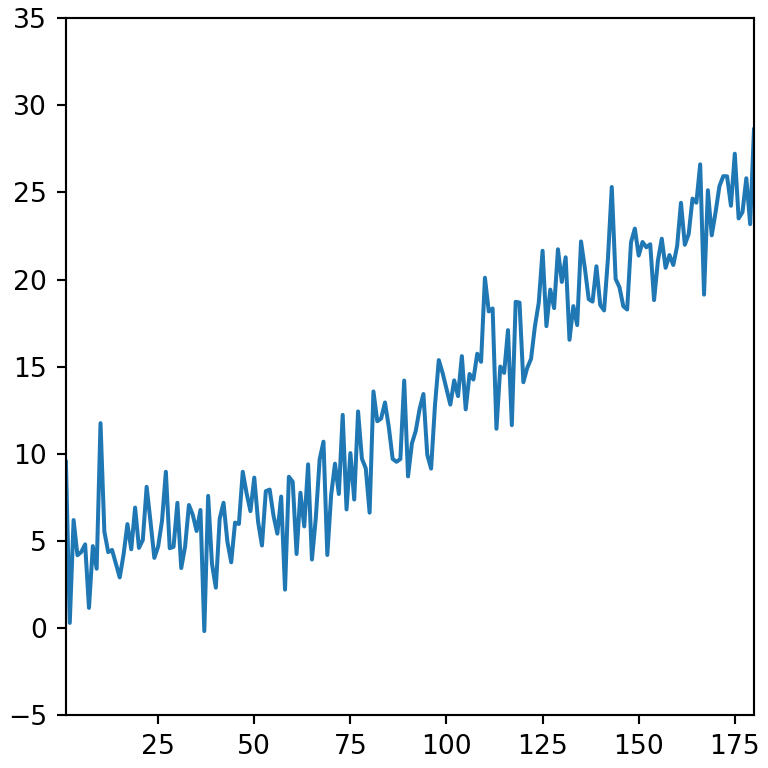
Invert an axis
Use invert_xaxis or invert_yaxis to reverse the direction of an axis, or set the limits in descending order.
import numpy as np
import matplotlib.pyplot as plt

rng = np.random.default_rng(3)
day = np.arange(1, 366)
temp = 15 + 10 * np.sin((day - 110) / 365 * 2 * np.pi) + rng.normal(0, 2, 365)

fig, ax = plt.subplots()
ax.plot(day, temp)

ax.invert_yaxis()
# plt.show()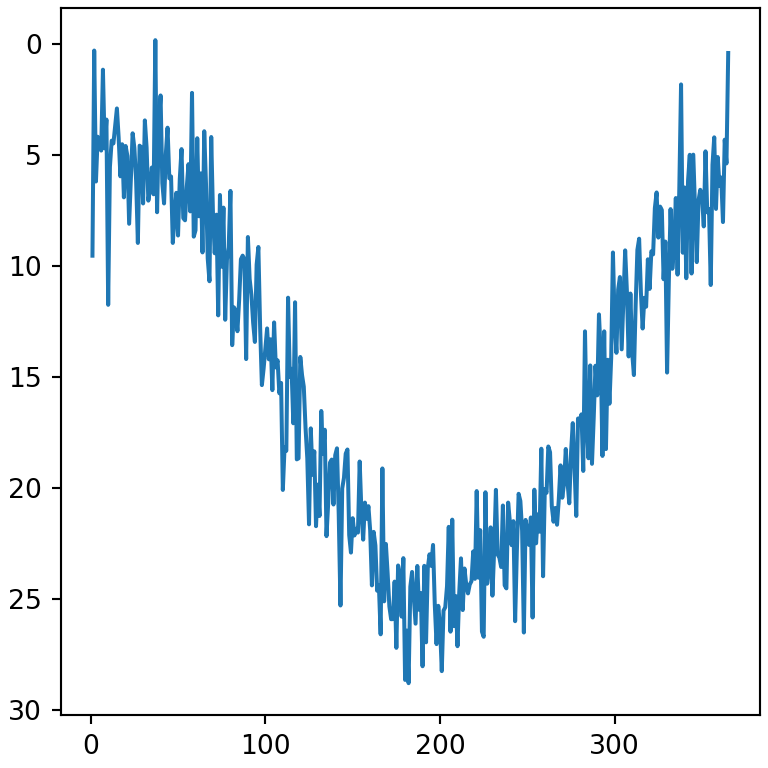
Margins
By default there is a small margin between the data and the limits. Remove it or change it with margins.
import numpy as np
import matplotlib.pyplot as plt

rng = np.random.default_rng(3)
day = np.arange(1, 366)
temp = 15 + 10 * np.sin((day - 110) / 365 * 2 * np.pi) + rng.normal(0, 2, 365)

fig, ax = plt.subplots()
ax.plot(day, temp)

ax.margins(x = 0)
# plt.show()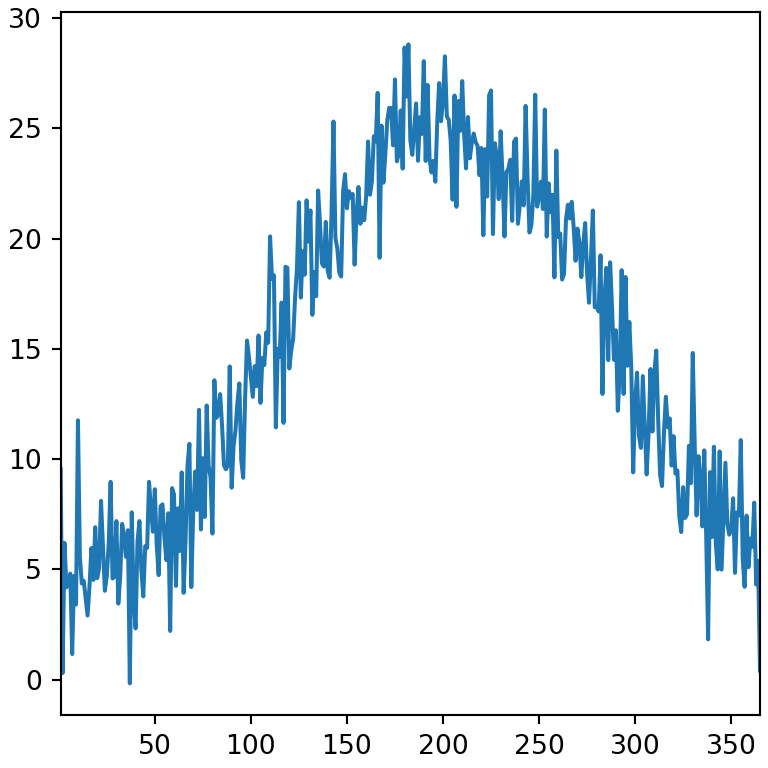
Ticks and tick labels
Set the position of the ticks with set_xticks and set_yticks. The labels argument replaces the numbers with custom texts.
import numpy as np
import matplotlib.pyplot as plt

rng = np.random.default_rng(3)
day = np.arange(1, 366)
temp = 15 + 10 * np.sin((day - 110) / 365 * 2 * np.pi) + rng.normal(0, 2, 365)

fig, ax = plt.subplots()
ax.plot(day, temp)

ax.set_xticks([1, 91, 182, 274], labels = ["Jan", "Apr", "Jul", "Oct"])
ax.set_yticks([0, 15, 30])
# plt.show()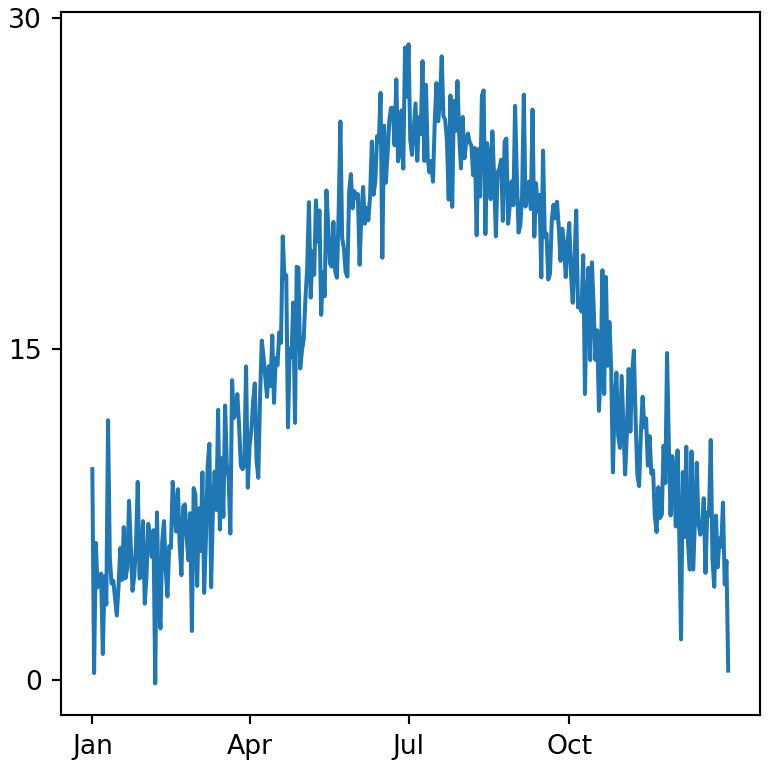
Rotate the tick labels
When the tick labels are long they overlap. Rotate them with the rotation argument of tick_params or plt.xticks(rotation = 45).
import matplotlib.pyplot as plt

names = ["January", "February", "March", "April", "May", "June"]

fig, ax = plt.subplots()
ax.bar(names, [5, 7, 3, 8, 6, 9])

ax.tick_params(axis = "x", labelrotation = 45)
# plt.show()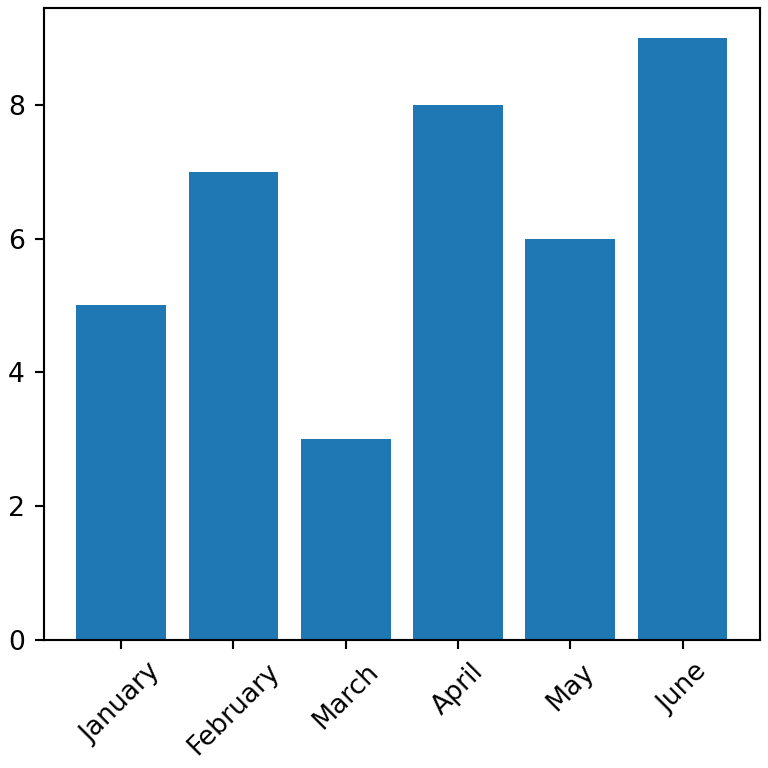
Tick style
The tick_params method customizes the ticks and their labels: labelsize, labelcolor, length, width, color and direction ("in", "out" or "inout").
import numpy as np
import matplotlib.pyplot as plt

rng = np.random.default_rng(3)
day = np.arange(1, 366)
temp = 15 + 10 * np.sin((day - 110) / 365 * 2 * np.pi) + rng.normal(0, 2, 365)

fig, ax = plt.subplots()
ax.plot(day, temp)

ax.tick_params(axis = "both", labelsize = 12, labelcolor = "tab:blue",
               length = 8, width = 2, direction = "in")
# plt.show()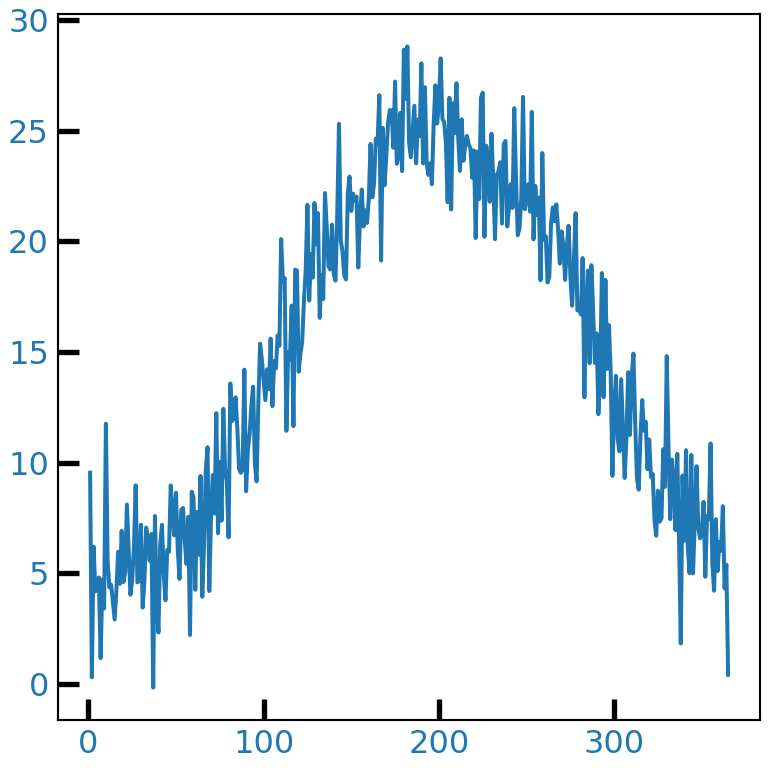
Remove the ticks
Pass an empty list to set_xticks or set_yticks to remove the ticks and their labels.
import numpy as np
import matplotlib.pyplot as plt

rng = np.random.default_rng(3)
day = np.arange(1, 366)
temp = 15 + 10 * np.sin((day - 110) / 365 * 2 * np.pi) + rng.normal(0, 2, 365)

fig, ax = plt.subplots()
ax.plot(day, temp)

ax.set_yticks([])
# plt.show()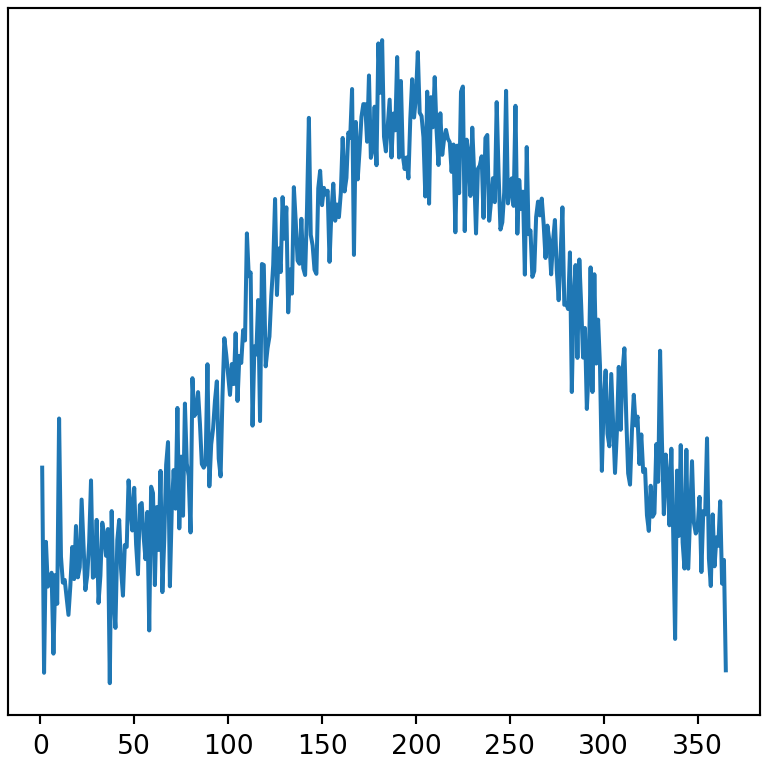
Format the tick labels
The matplotlib.ticker module provides formatters to display the numbers of the axes as percentages, currency or with thousands separators.
import matplotlib.pyplot as plt
from matplotlib.ticker import PercentFormatter, StrMethodFormatter

fig, ax = plt.subplots()
ax.bar(["A", "B", "C"], [0.25, 0.45, 0.30])

ax.yaxis.set_major_formatter(PercentFormatter(xmax = 1))
# plt.show()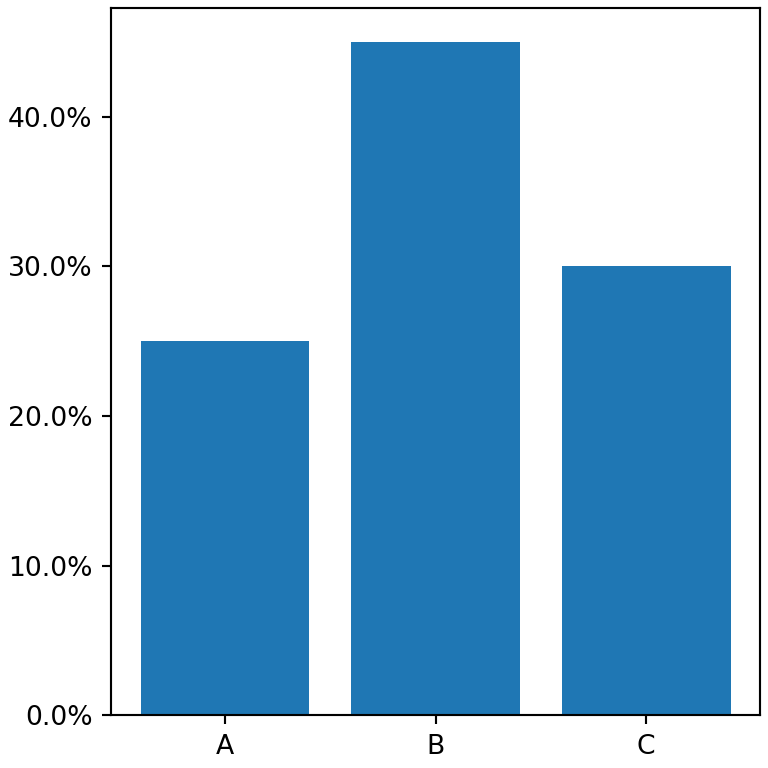
Thousands separator
import matplotlib.pyplot as plt
from matplotlib.ticker import StrMethodFormatter

fig, ax = plt.subplots()
ax.bar(["2023", "2024", "2025"], [125000, 180000, 240000])

ax.yaxis.set_major_formatter(StrMethodFormatter("${x:,.0f}"))
# plt.show()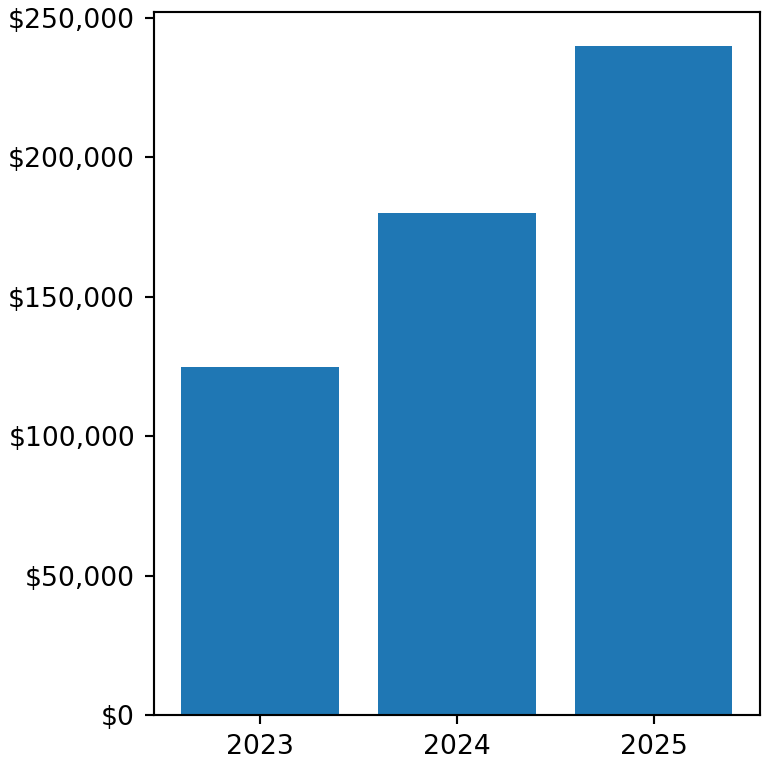
Logarithmic scale
Use set_xscale or set_yscale with "log" to transform the axis to a logarithmic scale. Other options are "symlog" (which allows negative values) and "logit".
import numpy as np
import matplotlib.pyplot as plt

years = np.arange(2000, 2026)
devices = 1000 * 1.45 ** (years - 2000)

fig, ax = plt.subplots()
ax.plot(years, devices)

ax.set_yscale("log")
# plt.show()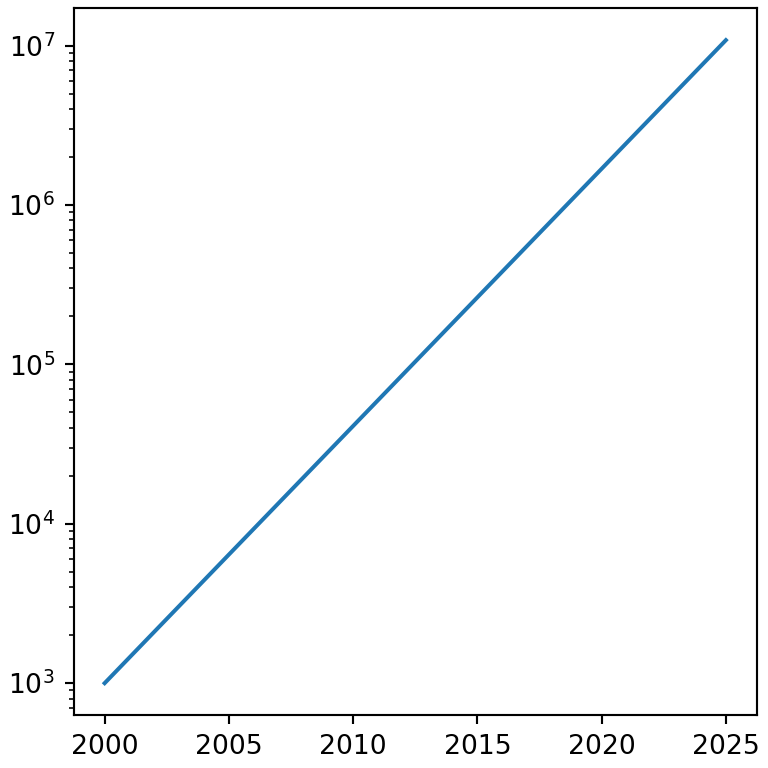
Remove the axes and borders
The lines surrounding the plot are called spines. Hide any of them with set_visible(False), or remove the whole axes (spines, ticks and labels) with ax.axis("off").
import numpy as np
import matplotlib.pyplot as plt

rng = np.random.default_rng(3)
day = np.arange(1, 366)
temp = 15 + 10 * np.sin((day - 110) / 365 * 2 * np.pi) + rng.normal(0, 2, 365)

fig, ax = plt.subplots()
ax.plot(day, temp)

ax.spines[["top", "right"]].set_visible(False)
# plt.show()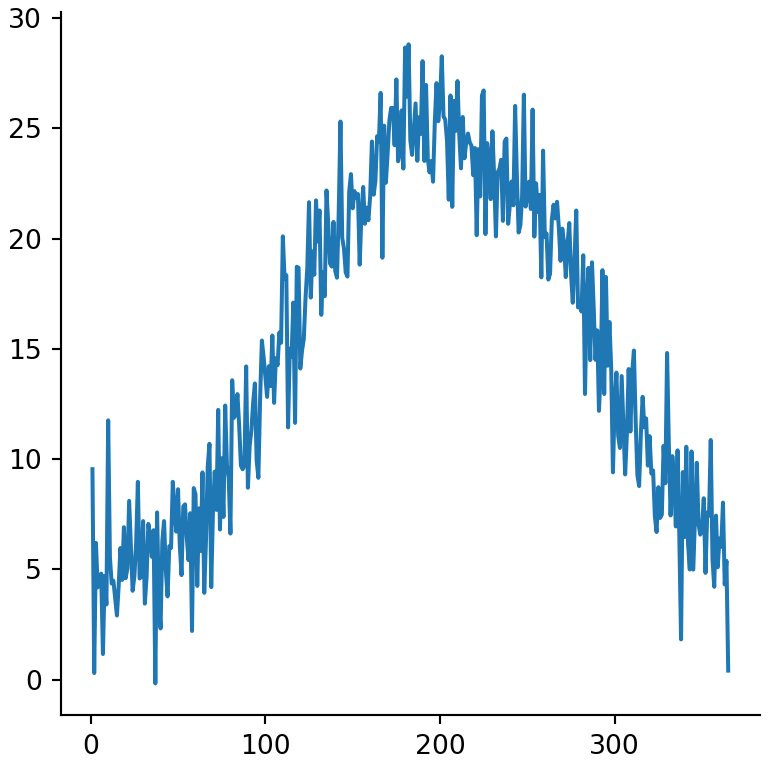
Secondary axis
To plot two variables with different scales in the same chart create a second Y axis that shares the X axis with twinx.
import numpy as np
import matplotlib.pyplot as plt

rng = np.random.default_rng(3)
day = np.arange(1, 366)
temp = 15 + 10 * np.sin((day - 110) / 365 * 2 * np.pi) + rng.normal(0, 2, 365)

pressure = 1013 + rng.normal(0, 1, 365).cumsum()

fig, ax = plt.subplots()
ax.plot(day, temp, color = "tab:red")
ax.set_ylabel("Temperature (ºC)", color = "tab:red")

ax2 = ax.twinx()
ax2.plot(day, pressure, color = "tab:blue")
ax2.set_ylabel("Pressure (hPa)", color = "tab:blue")
# plt.show()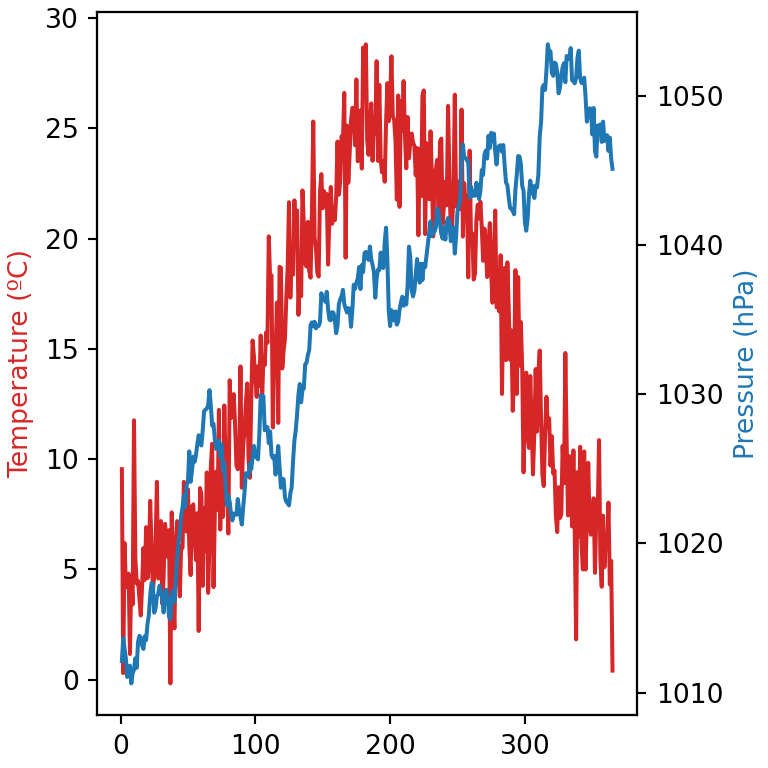
Learn also how to add grid lines, titles and texts to your matplotlib charts.