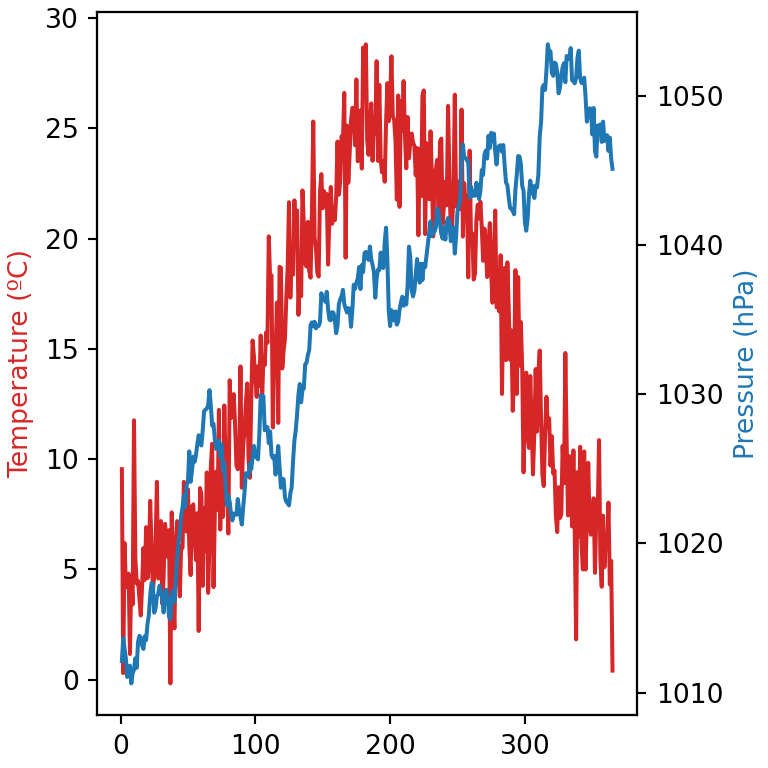
Subplots allow displaying several charts in the same figure. The recommended way to create them in matplotlib is plt.subplots, which returns the figure and an array with one axes object for each subplot.
Creating subplots with plt.subplots
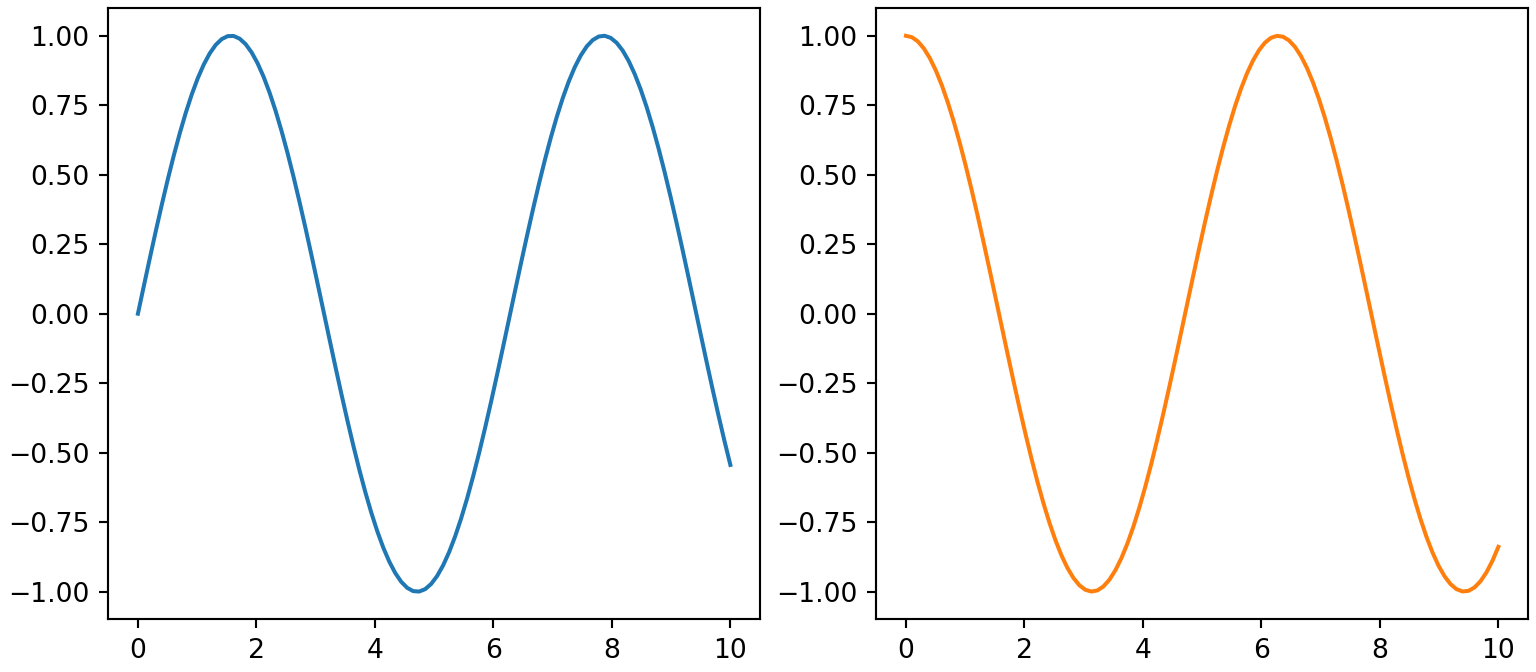
The nrows and ncols arguments set the number of rows and columns of the grid. With a single row or column the axes are returned as a one-dimensional array, so you can unpack them directly.
import numpy as np
import matplotlib.pyplot as plt

x = np.linspace(0, 10, 100)

fig, (ax1, ax2) = plt.subplots(nrows = 1, ncols = 2, figsize = (8, 3.5))

ax1.plot(x, np.sin(x))
ax2.plot(x, np.cos(x), color = "tab:orange")
# plt.show()
Grid of subplots
With several rows and columns the axes are returned as a two-dimensional array. Access each subplot with axs[row, column] or iterate over all of them with axs.flat.
import numpy as np
import matplotlib.pyplot as plt

rng = np.random.default_rng(1)

fig, axs = plt.subplots(2, 2)

axs[0, 0].plot(rng.normal(size = 20).cumsum())
axs[0, 1].bar(["A", "B", "C"], [3, 5, 2])
axs[1, 0].hist(rng.normal(size = 200))
axs[1, 1].scatter(rng.normal(size = 30), rng.normal(size = 30))
# plt.show()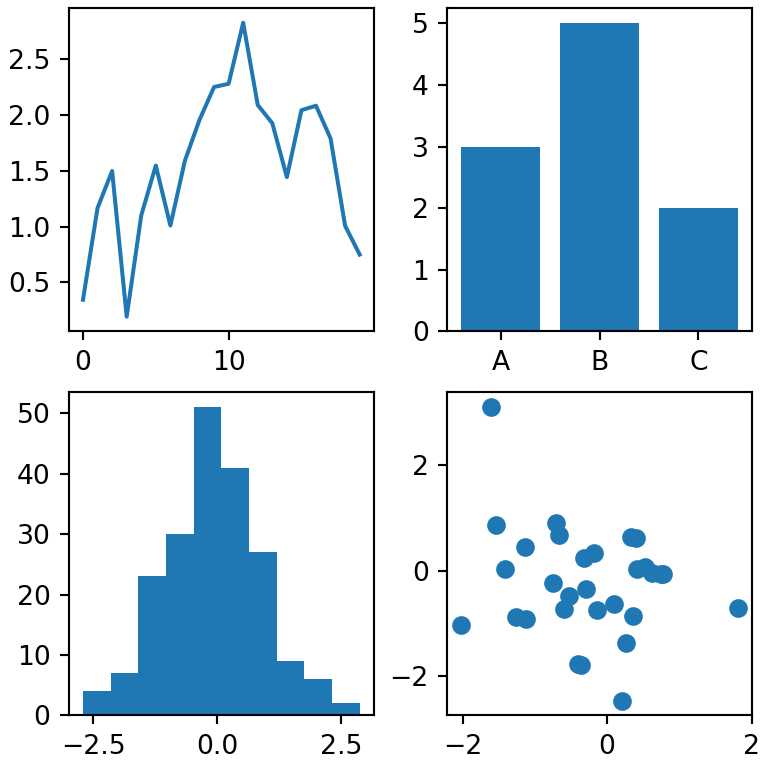
Iterate over the subplots
import numpy as np
import matplotlib.pyplot as plt

x = np.linspace(0, 10, 100)

fig, axs = plt.subplots(2, 3)

for i, ax in enumerate(axs.flat):
    ax.plot(x, np.sin(x + i))
    ax.set_title(f"Plot {i + 1}")

plt.tight_layout()
# plt.show()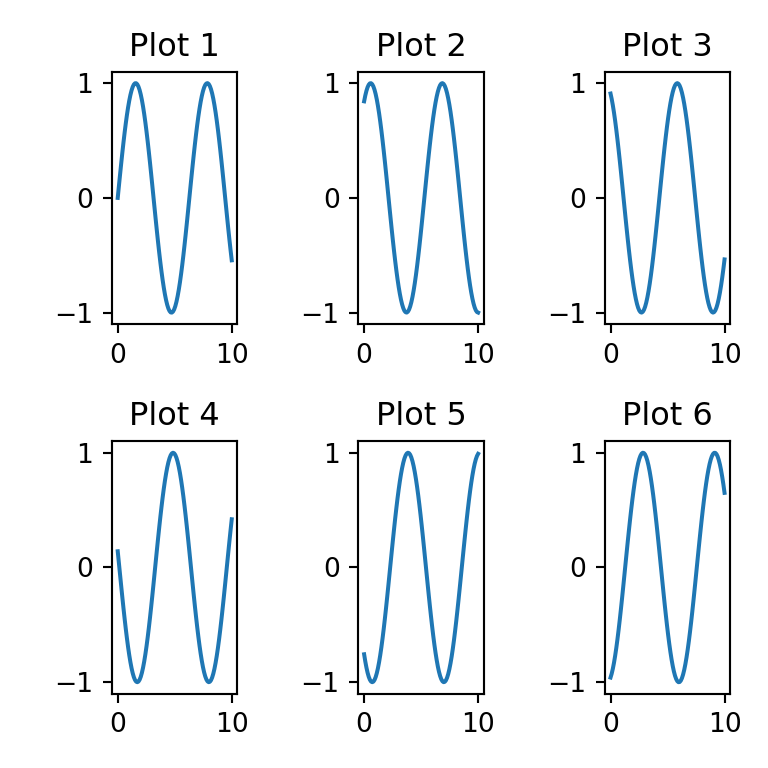
Figure size
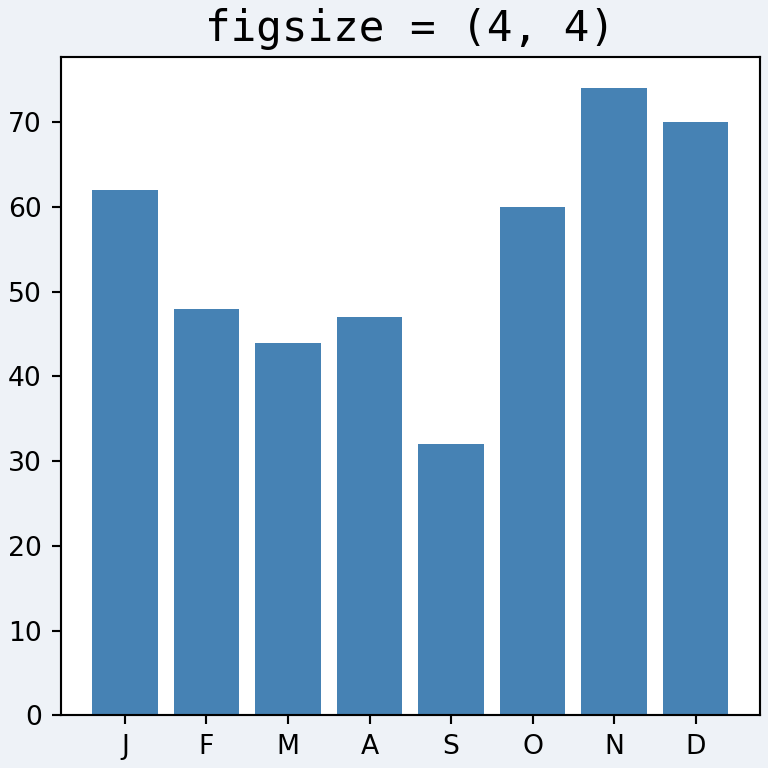
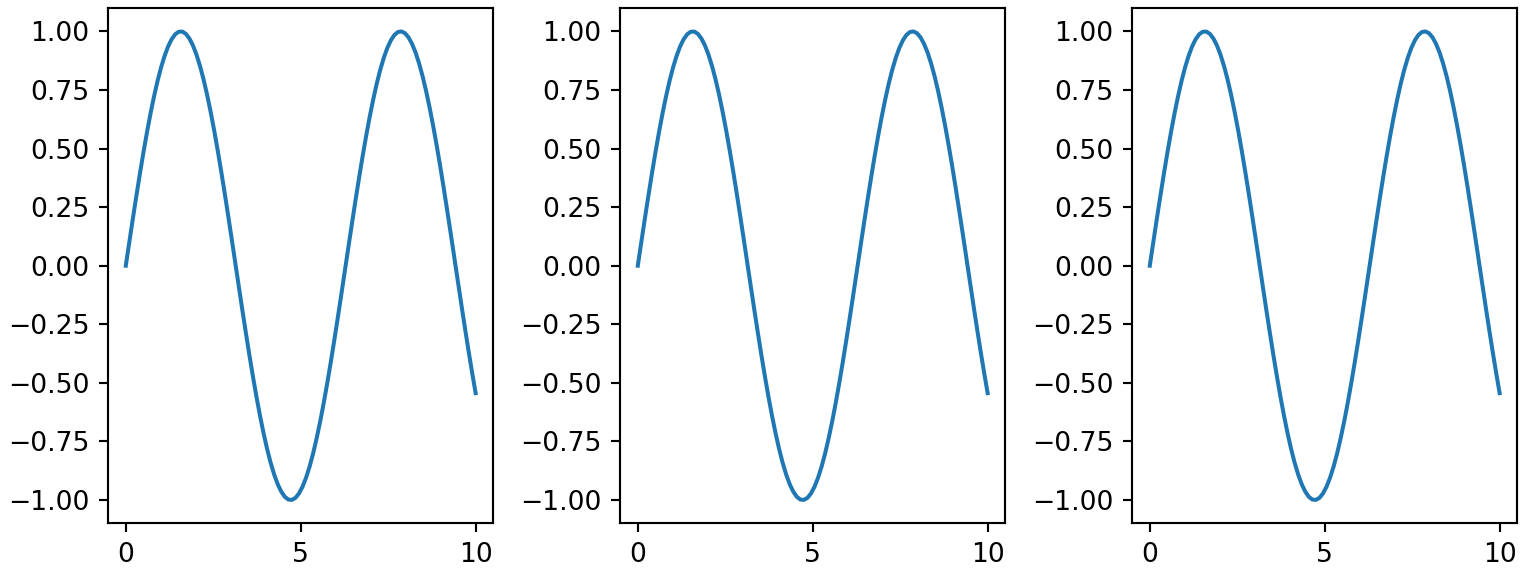
The size of the whole figure is set in inches with figsize = (width, height). The space is shared among all the subplots.
import numpy as np
import matplotlib.pyplot as plt

x = np.linspace(0, 10, 100)

fig, axs = plt.subplots(1, 3, figsize = (8, 3))

for ax in axs:
    ax.plot(x, np.sin(x))
# plt.show()
Spacing between subplots
Titles and axis labels often overlap when there are several subplots. The easiest solution is calling plt.tight_layout() or creating the figure with layout = "constrained", which adjust the spacing automatically.
import numpy as np
import matplotlib.pyplot as plt

x = np.linspace(0, 10, 100)

fig, axs = plt.subplots(2, 2, layout = "constrained")

for ax in axs.flat:
    ax.plot(x, np.sin(x))
    ax.set_title("Title")
    ax.set_xlabel("X-axis label")
# plt.show()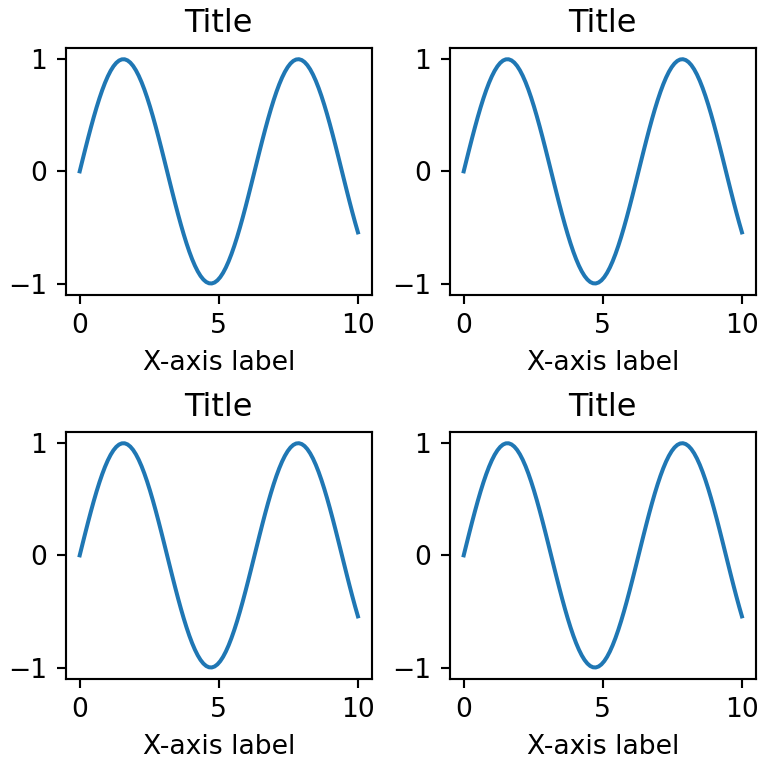
Custom spacing
To set the space manually use subplots_adjust, where wspace and hspace are the horizontal and vertical space between subplots as a fraction of the average axes width and height.
import numpy as np
import matplotlib.pyplot as plt

x = np.linspace(0, 10, 100)

fig, axs = plt.subplots(2, 2)

for ax in axs.flat:
    ax.plot(x, np.sin(x))

plt.subplots_adjust(wspace = 0.5, hspace = 0.5)
# plt.show()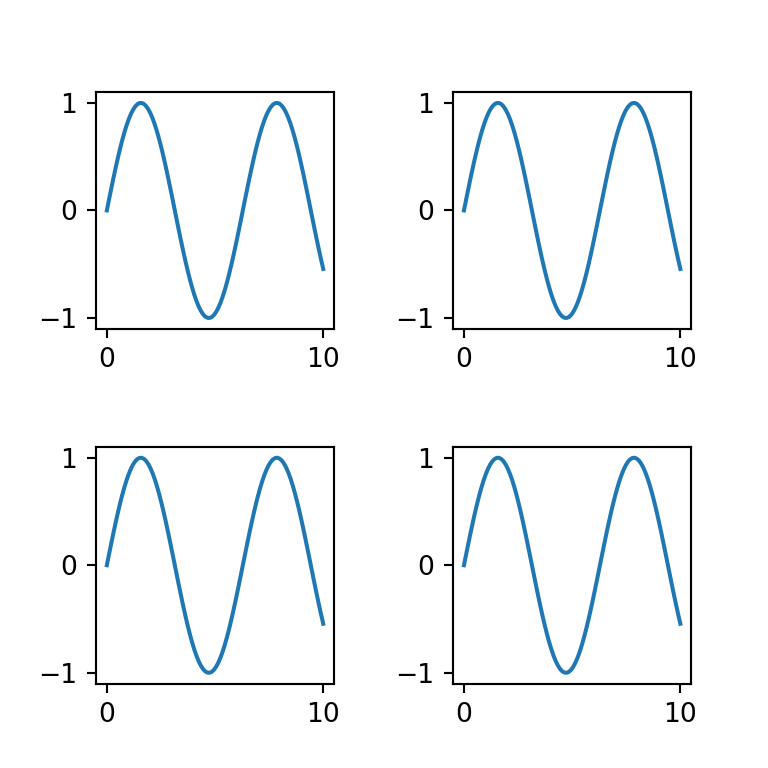
Share axes
Set sharex = True or sharey = True to use the same limits on all the subplots. The tick labels are only shown on the outer subplots, saving space and making comparisons easier.
import numpy as np
import matplotlib.pyplot as plt

rng = np.random.default_rng(2)

fig, axs = plt.subplots(2, 2, sharex = True, sharey = True)

for ax in axs.flat:
    ax.hist(rng.normal(size = 200))
# plt.show()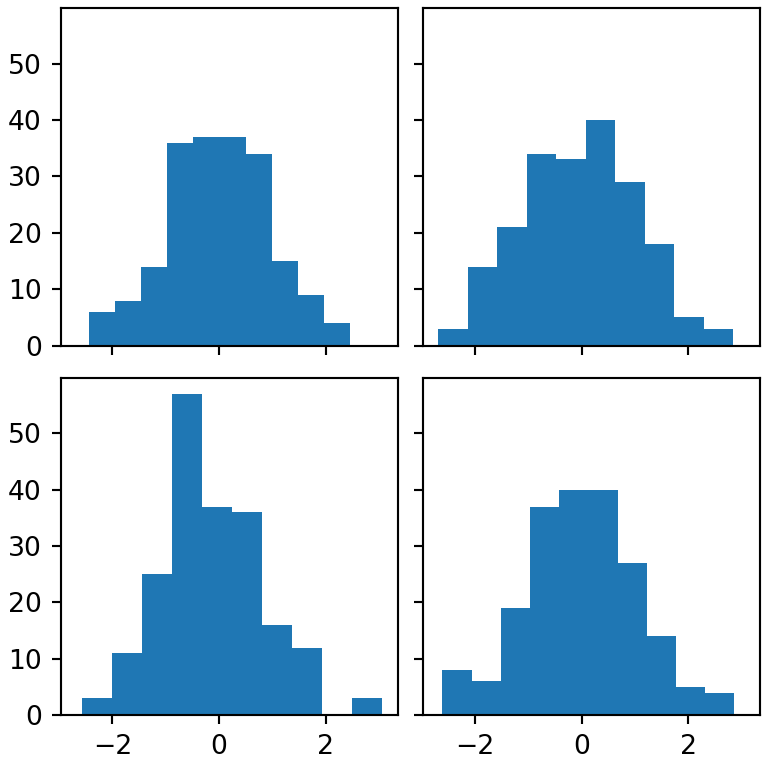
Different widths and heights
The width_ratios and height_ratios arguments set the relative size of the columns and rows of the grid.
import numpy as np
import matplotlib.pyplot as plt

rng = np.random.default_rng(3)
y = rng.normal(size = 300)

fig, (ax1, ax2) = plt.subplots(1, 2, sharey = True,
                               width_ratios = [3, 1])

ax1.plot(y)
ax2.hist(y, orientation = "horizontal")
# plt.show()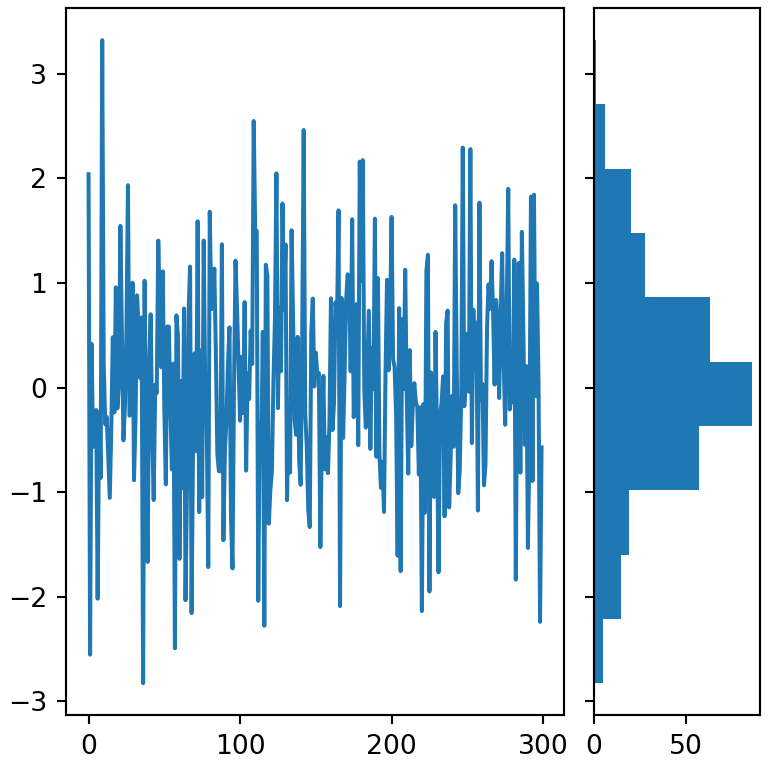
Complex layouts with subplot_mosaic
For layouts where a subplot spans several rows or columns use subplot_mosaic. Each letter of the layout is a subplot, and repeating a letter makes the subplot bigger. The axes are returned in a dictionary.
import numpy as np
import matplotlib.pyplot as plt

rng = np.random.default_rng(4)

fig, axd = plt.subplot_mosaic([["A", "A"],
                               ["B", "C"]],
                              layout = "constrained")

axd["A"].plot(rng.normal(size = 50).cumsum())
axd["B"].hist(rng.normal(size = 200))
axd["C"].scatter(rng.normal(size = 30), rng.normal(size = 30))
# plt.show()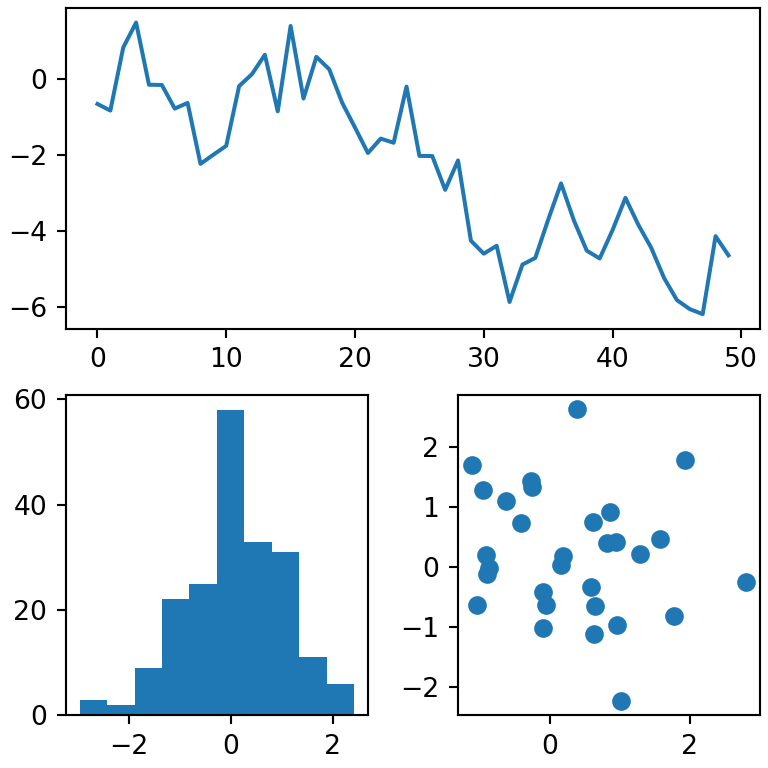
Titles for each subplot
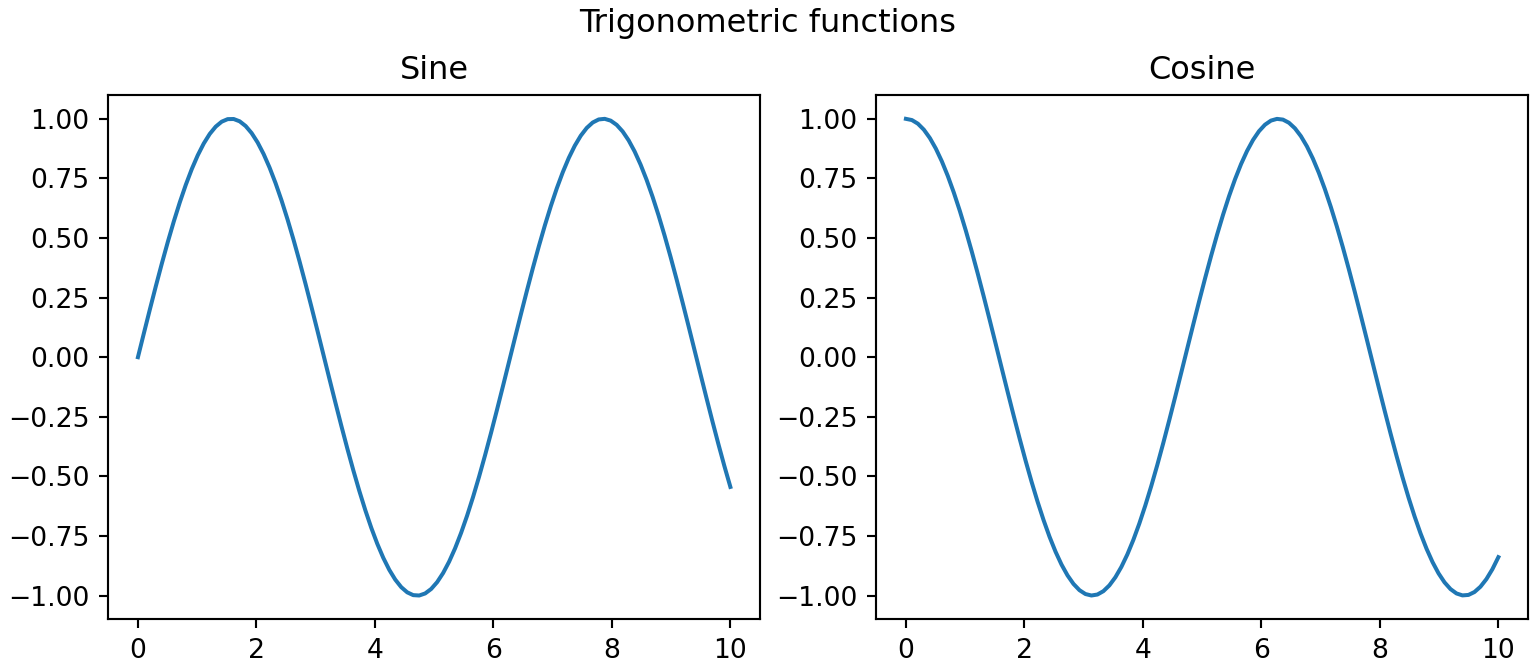
Use set_title on each axes to add a title to every subplot and fig.suptitle to add a main title to the figure. Read more about titles in matplotlib.
import numpy as np
import matplotlib.pyplot as plt

x = np.linspace(0, 10, 100)

fig, (ax1, ax2) = plt.subplots(1, 2, figsize = (8, 3.5))

ax1.plot(x, np.sin(x))
ax1.set_title("Sine")
ax2.plot(x, np.cos(x))
ax2.set_title("Cosine")

fig.suptitle("Trigonometric functions")
# plt.show()
Remove an empty subplot
If the grid has more cells than plots, remove the empty ones with fig.delaxes or hide them with ax.axis("off").
import numpy as np
import matplotlib.pyplot as plt

x = np.linspace(0, 10, 100)

fig, axs = plt.subplots(2, 2)

for i, ax in enumerate(axs.flat[:3]):
    ax.plot(x, np.sin(x + i))

fig.delaxes(axs[1, 1])
# plt.show()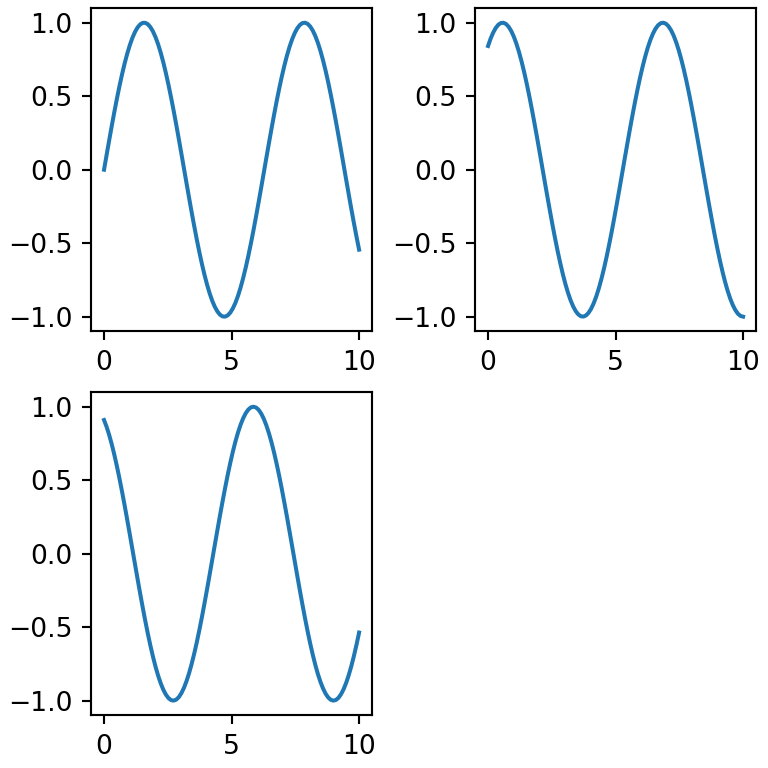
To add a single legend for all the subplots see the legend in matplotlib tutorial.