Markers are the symbols used to represent each data point in matplotlib. They can be added to line charts with plot and are the core of scatter plots made with scatter. In this tutorial you will find the full list of markers and how to customize them.
List of markers in matplotlib
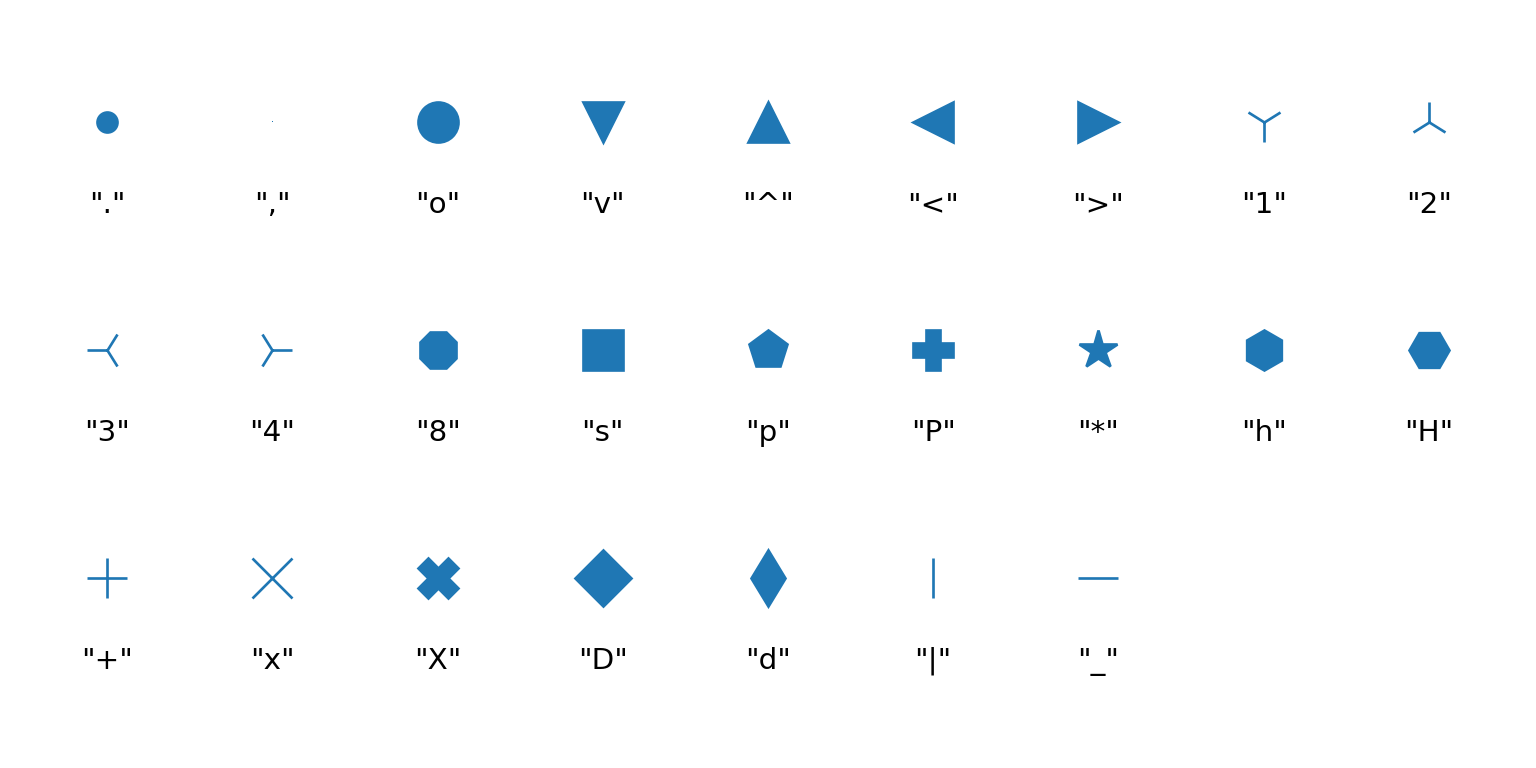
The following image shows all the markers available in matplotlib with the string you need to pass to the marker argument.
import matplotlib.pyplot as plt

markers = [".", ",", "o", "v", "^", "<", ">", "1", "2", "3", "4", "8", "s",
           "p", "P", "*", "h", "H", "+", "x", "X", "D", "d", "|", "_"]

fig, ax = plt.subplots(figsize = (8, 4))

for i, m in enumerate(markers):
    x, y = i % 9, - (i // 9)
    ax.plot(x, y, marker = m, markersize = 15, color = "tab:blue")
    ax.text(x, y - 0.4, f'"{m}"', ha = "center", fontsize = 11)

ax.set_xlim(-0.6, 8.6)
ax.set_ylim(-2.8, 0.5)
ax.axis("off")
# plt.show()| Marker | Description |
|---|---|
“.”
|
point |
“,”
|
pixel |
“o”
|
circle |
“v”
|
triangle down |
“^”
|
triangle up |
“<”
|
triangle left |
“>”
|
triangle right |
“1”
|
tri down |
“2”
|
tri up |
“3”
|
tri left |
“4”
|
tri right |
“8”
|
octagon |
“s”
|
square |
“p”
|
pentagon |
“P”
|
plus (filled) |
“*“
|
star |
“h”
|
hexagon 1 |
“H”
|
hexagon 2 |
“+”
|
plus |
“x”
|
x |
“X”
|
x (filled) |
“D”
|
diamond |
“d”
|
thin diamond |
“|”
|
vertical line |
“_“
|
horizontal line |
In addition, you can use the numbers from 0 to 11 for caret and tick markers, "none" or None for no marker and any mathematical expression between dollar signs, as explained at the end of this tutorial.
Markers in line charts
Use the marker argument of plot to add markers to a line chart. In a format string the marker is set with its character, so "o-" means circles joined by a solid line and "o" only circles.
import matplotlib.pyplot as plt

fig, ax = plt.subplots()
ax.plot([1, 3, 2, 4, 3], marker = "o")
ax.plot([0, 2, 1, 3, 2], marker = "s")
# plt.show()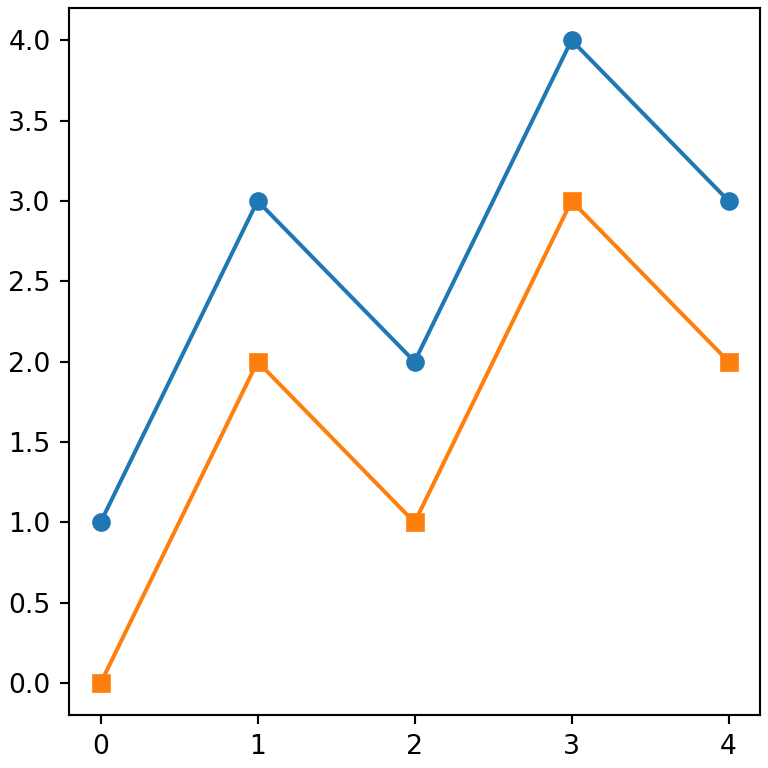
Show a marker every N points
When there are many data points use markevery to draw only some of the markers.
import numpy as np
import matplotlib.pyplot as plt

x = np.linspace(0, 10, 100)

fig, ax = plt.subplots()
ax.plot(x, np.sin(x), marker = "o", markevery = 10)
# plt.show()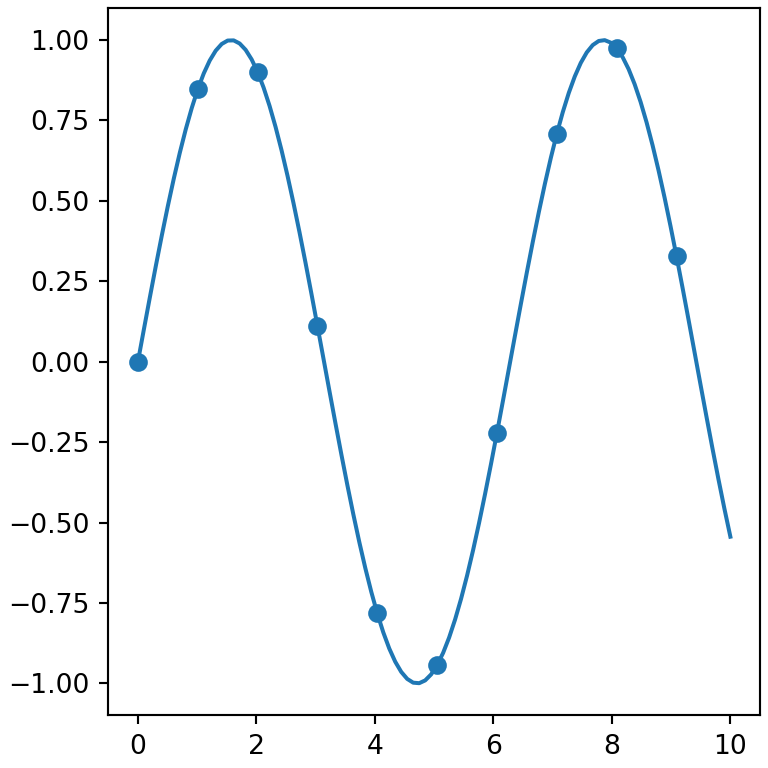
Markers in scatter plots
In scatter the marker is also set with marker, but note that a single call only accepts one marker. To use a different marker per group call scatter once for each group.
import numpy as np
import matplotlib.pyplot as plt

rng = np.random.default_rng(3)

fig, ax = plt.subplots()
ax.scatter(rng.normal(0, 1, 30), rng.normal(0, 1, 30), marker = "o", label = "A")
ax.scatter(rng.normal(2, 1, 30), rng.normal(2, 1, 30), marker = "^", label = "B")
ax.scatter(rng.normal(4, 1, 30), rng.normal(0, 1, 30), marker = "s", label = "C")
ax.legend()
# plt.show()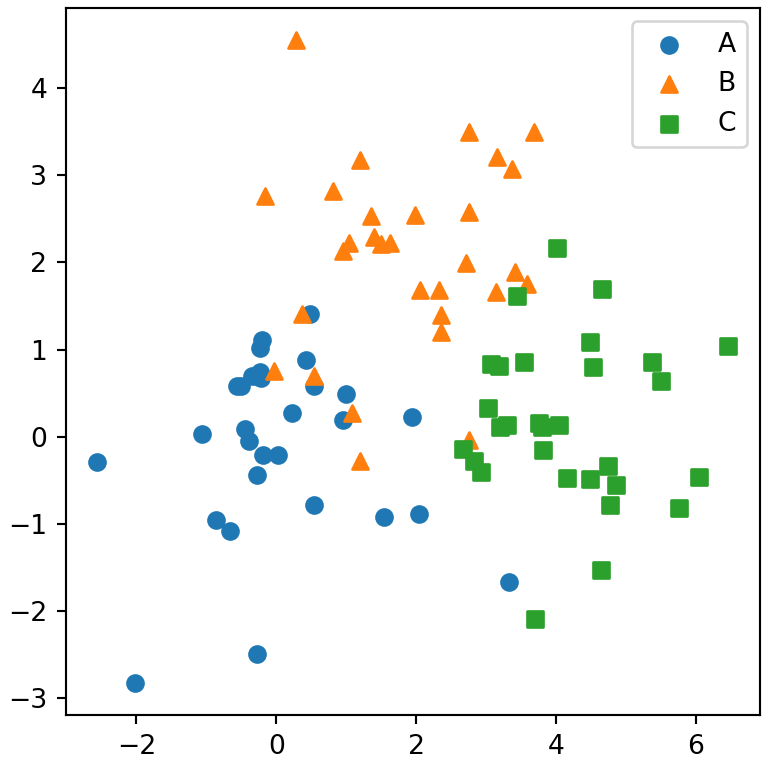
Marker size
The size is set with markersize (or ms) in plot and with s in scatter. Note that s is the area of the marker in points squared, so to double the diameter you need to multiply s by four.
import matplotlib.pyplot as plt

fig, ax = plt.subplots()
ax.plot([1, 2, 3], [1, 2, 3], marker = "o", markersize = 15)
ax.scatter([1, 2, 3], [2, 3, 4], s = 200)
# plt.show()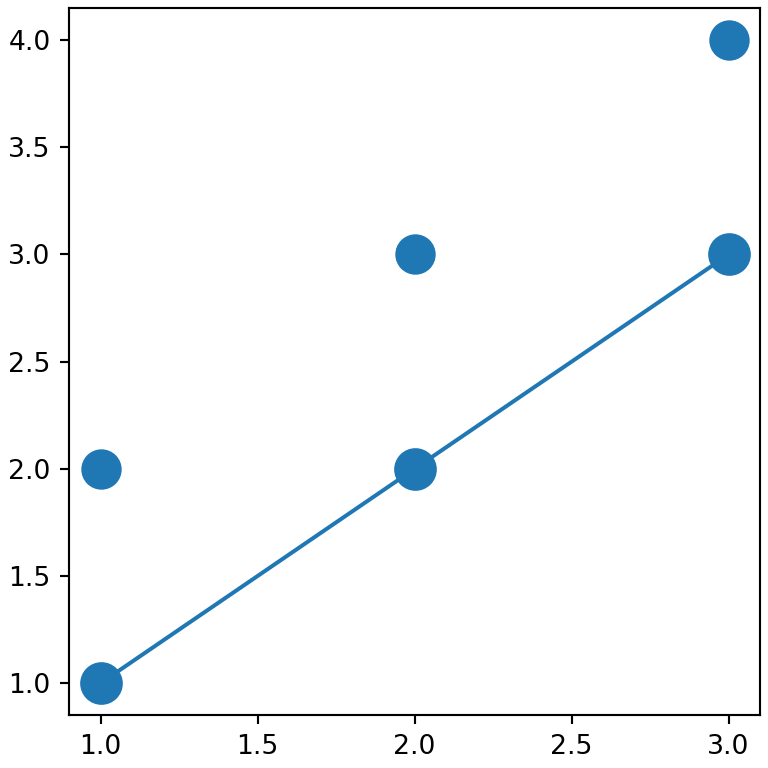
Size based on a variable
In scatter you can pass an array to s to make a bubble chart where the size of each point depends on a variable.
import numpy as np
import matplotlib.pyplot as plt

rng = np.random.default_rng(4)
x, y = rng.uniform(0, 10, (2, 20))
size = rng.uniform(20, 600, 20)

fig, ax = plt.subplots()
ax.scatter(x, y, s = size, alpha = 0.6)
# plt.show()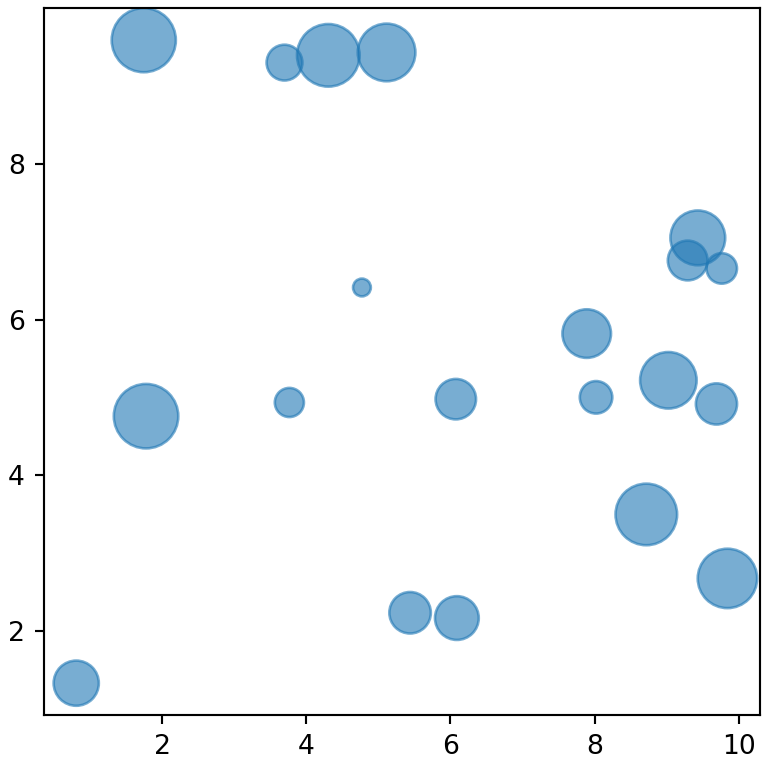
Marker color
Markers have a fill color and a border color. In plot use markerfacecolor (mfc), markeredgecolor (mec) and markeredgewidth (mew). In scatter use color or c, edgecolors and linewidths.
import matplotlib.pyplot as plt

fig, ax = plt.subplots()
ax.plot([1, 3, 2, 4], marker = "o", markersize = 14, color = "gray",
        markerfacecolor = "gold",
        markeredgecolor = "black",
        markeredgewidth = 2)
# plt.show()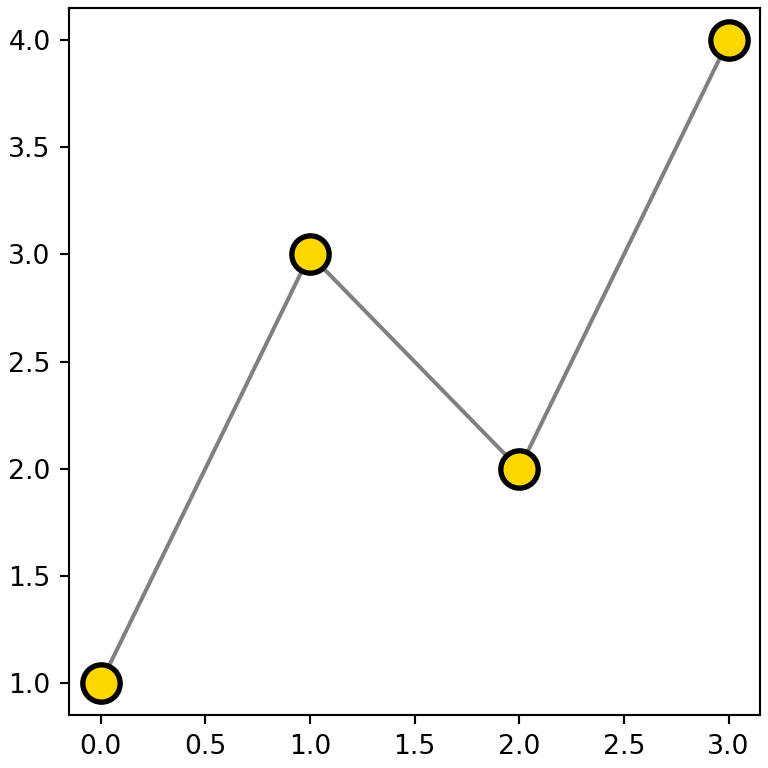
Hollow markers
To draw empty markers set the fill color to "none" and specify a color for the border.
import numpy as np
import matplotlib.pyplot as plt

rng = np.random.default_rng(5)

fig, ax = plt.subplots()
ax.scatter(rng.normal(size = 50), rng.normal(size = 50), s = 80,
           facecolors = "none", edgecolors = "tab:red")
# plt.show()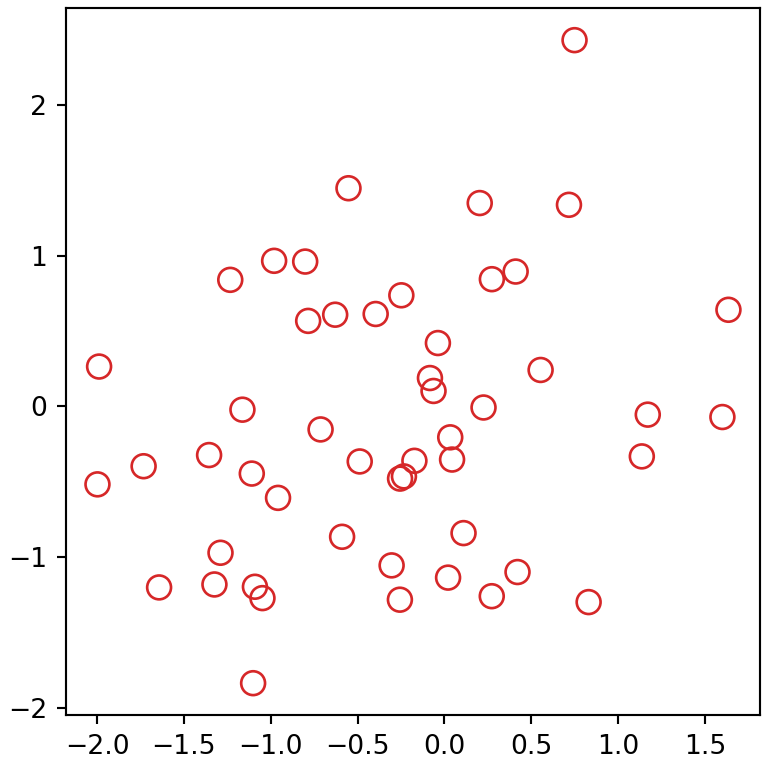
Fill style
The fillstyle argument of plot fills only a part of the marker. Possible values are "full", "left", "right", "bottom", "top" and "none".
import matplotlib.pyplot as plt

styles = ["full", "left", "right", "bottom", "top", "none"]

fig, ax = plt.subplots(figsize = (4, 2))
for i, style in enumerate(styles):
    ax.plot(i, 0, marker = "o", markersize = 20, color = "tab:blue", fillstyle = style)
    ax.text(i, -0.5, style, ha = "center")
ax.set_ylim(-0.8, 0.5)
ax.axis("off")
# plt.show()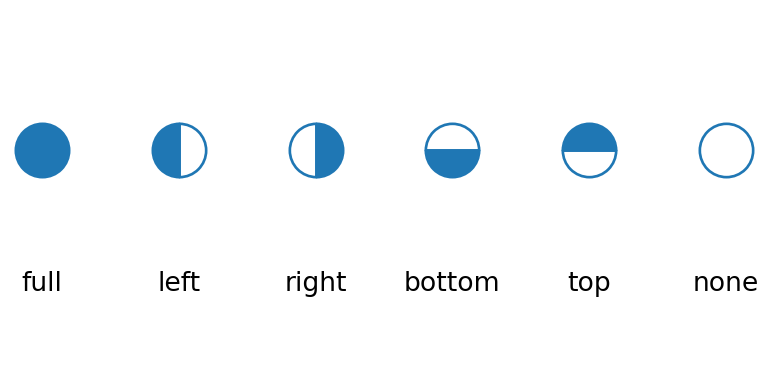
Custom markers
Any mathematical expression or Unicode symbol written between dollar signs can be used as a marker. This allows using letters, numbers or symbols such as hearts or clubs as markers.
import matplotlib.pyplot as plt

fig, ax = plt.subplots()
ax.plot([1, 2, 3], [1, 2, 3], marker = r"$\heartsuit$", markersize = 20, color = "red")
ax.plot([1, 2, 3], [2, 3, 4], marker = r"$\clubsuit$", markersize = 20, color = "black")
ax.plot([1, 2, 3], [3, 4, 5], marker = r"$A$", markersize = 15)
# plt.show()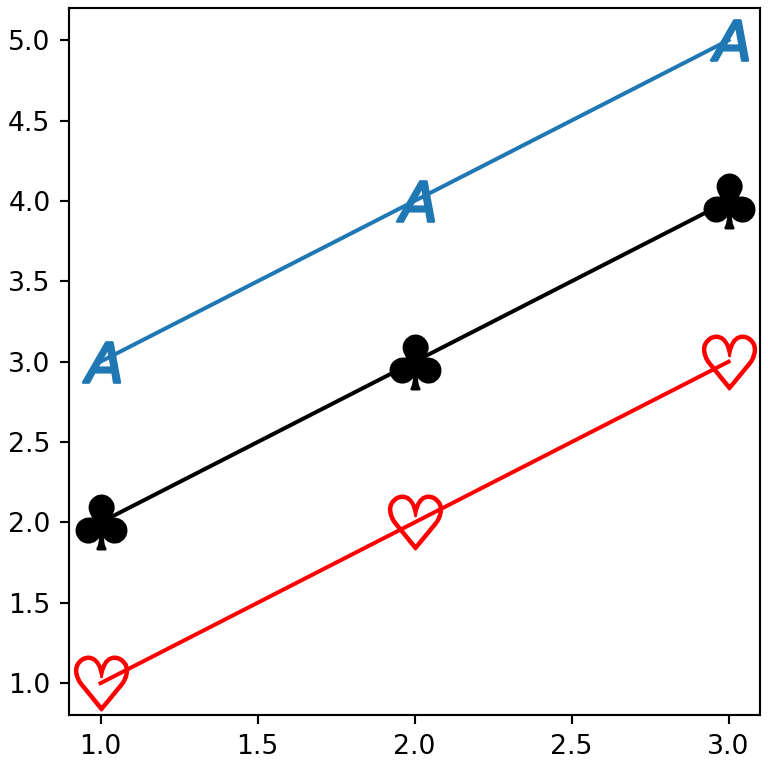
See also the full list of line styles, the named colors you can use for the markers and how to create a scatter plot in matplotlib.