Matplotlib can create animations by updating a figure frame by frame. The FuncAnimation class calls a function for each frame in which you modify the elements of the plot. The result can be displayed in a notebook or saved as a GIF or a video.
Animating a line with FuncAnimation
The usual workflow is: create the figure and the elements you want to animate, write a function that updates them for a given frame and pass it to FuncAnimation together with the number of frames. interval sets the time between frames in milliseconds.
import numpy as np
import matplotlib.pyplot as plt
from matplotlib.animation import FuncAnimation

x = np.linspace(0, 10, 200)

fig, ax = plt.subplots(figsize = (4, 4))
line, = ax.plot(x, np.sin(x))
ax.set_ylim(-1.2, 1.2)

def update(frame):
    line.set_ydata(np.sin(x + frame / 10))
    return line,

ani = FuncAnimation(fig, update, frames = 63, interval = 40)
# plt.show()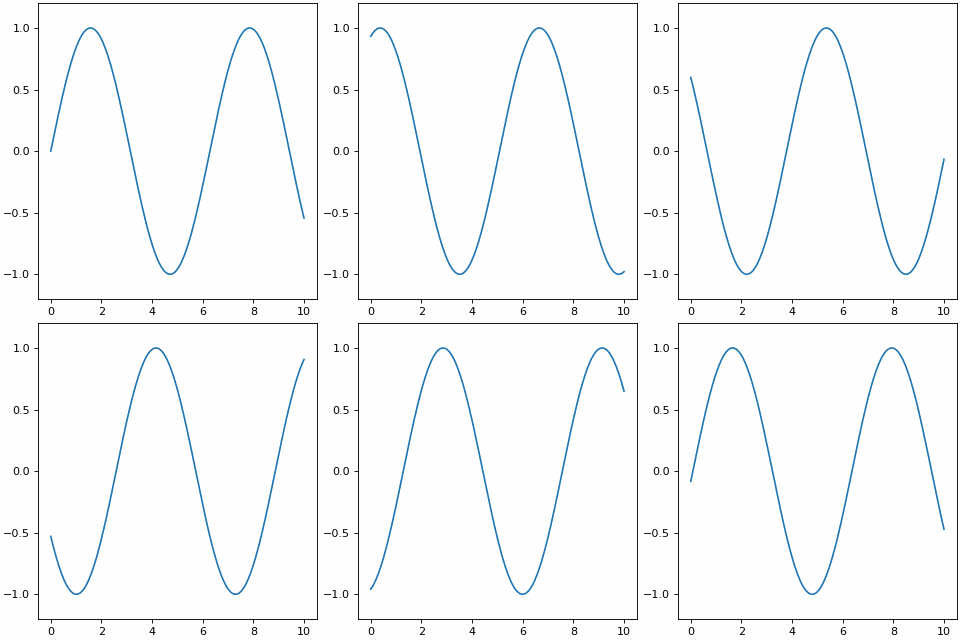
Line that grows over time
Instead of moving the data you can reveal it progressively, updating both the X and Y values of the line with set_data.
import numpy as np
import matplotlib.pyplot as plt
from matplotlib.animation import FuncAnimation

x = np.linspace(0, 10, 100)
y = np.random.default_rng(1).normal(size = 100).cumsum()

fig, ax = plt.subplots(figsize = (4, 4))
line, = ax.plot([], [])
ax.set_xlim(0, 10)
ax.set_ylim(y.min() - 1, y.max() + 1)

def update(frame):
    line.set_data(x[:frame], y[:frame])
    return line,

ani = FuncAnimation(fig, update, frames = len(x) + 1, interval = 40)
# plt.show()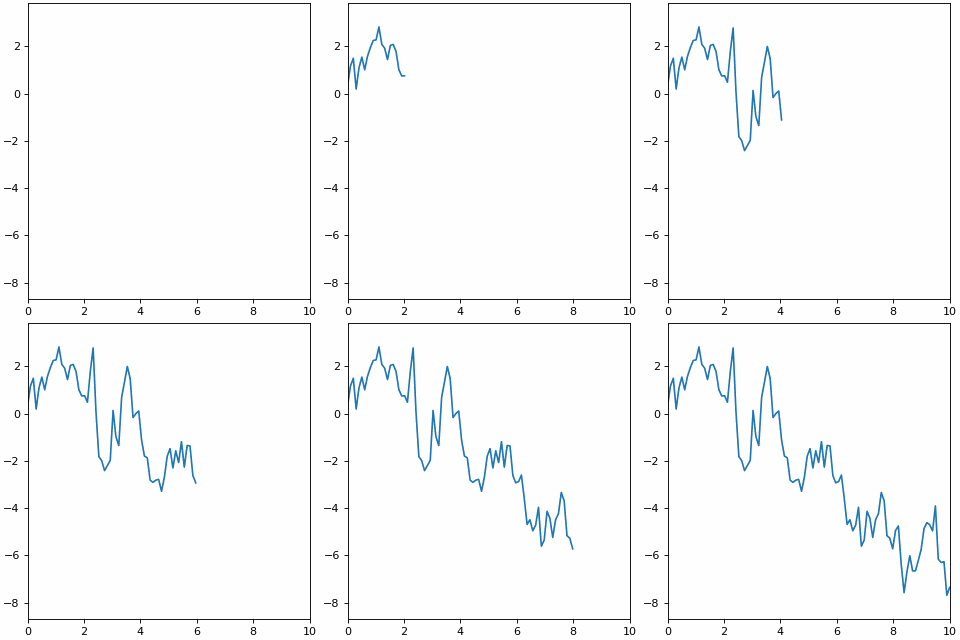
Animated scatter plot
The points of a scatter plot are updated with set_offsets, which receives an array with the X and Y coordinates.
import numpy as np
import matplotlib.pyplot as plt
from matplotlib.animation import FuncAnimation

rng = np.random.default_rng(2)
points = rng.normal(size = (50, 2))

fig, ax = plt.subplots(figsize = (4, 4))
sc = ax.scatter(points[:, 0], points[:, 1])
ax.set_xlim(-4, 4)
ax.set_ylim(-4, 4)

def update(frame):
    points[:] = points + rng.normal(0, 0.05, points.shape)
    sc.set_offsets(points)
    return sc,

ani = FuncAnimation(fig, update, frames = 60, interval = 50)
# plt.show()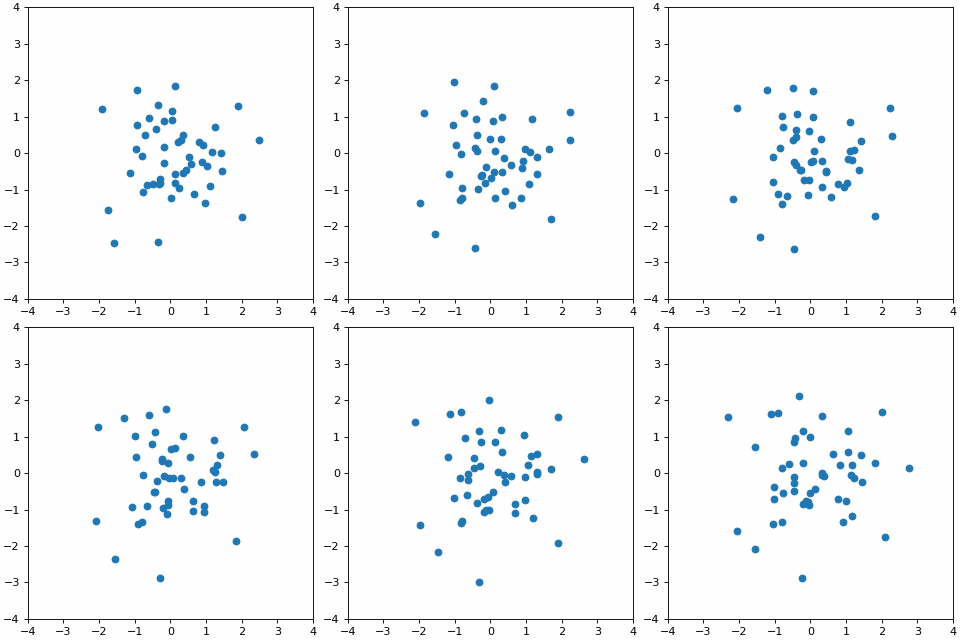
Animated bar chart
For bar charts, update the height of each bar with set_height.
import numpy as np
import matplotlib.pyplot as plt
from matplotlib.animation import FuncAnimation

rng = np.random.default_rng(3)
data = rng.uniform(1, 10, (30, 5)).cumsum(axis = 0)

fig, ax = plt.subplots(figsize = (4, 4))
bars = ax.bar(["A", "B", "C", "D", "E"], data[0])
ax.set_ylim(0, data.max() * 1.05)

def update(frame):
    for bar, height in zip(bars, data[frame]):
        bar.set_height(height)
    ax.set_title(f"Step {frame + 1}")
    return bars

ani = FuncAnimation(fig, update, frames = len(data), interval = 100)
# plt.show()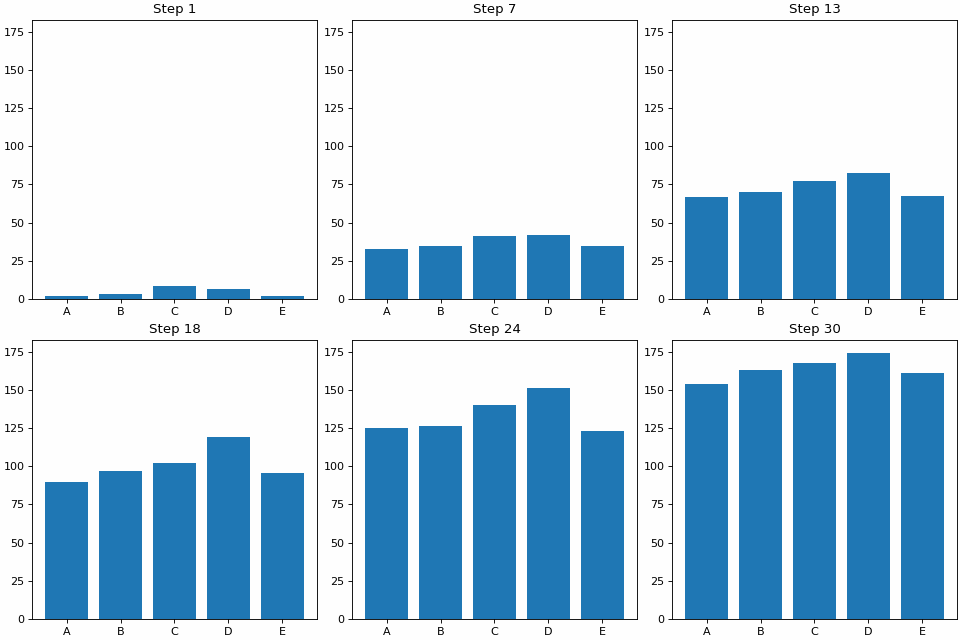
Saving the animation
Save the animation with the save method. GIF files are created with Pillow, which is installed together with matplotlib, while MP4 videos need FFmpeg installed on your system.
from matplotlib.animation import PillowWriter, FFMpegWriter

ani.save("animation.gif", writer = PillowWriter(fps = 25))
ani.save("animation.mp4", writer = FFMpegWriter(fps = 25))
Animations in Jupyter notebooks
In a Jupyter notebook the animation is not displayed with plt.show(). Convert it to HTML instead:
from IPython.display import HTML

HTML(ani.to_jshtml())
Keep a reference to the animation object (ani = FuncAnimation(...)). If the object is deleted, the animation stops. To learn how to export static charts see saving figures in matplotlib.