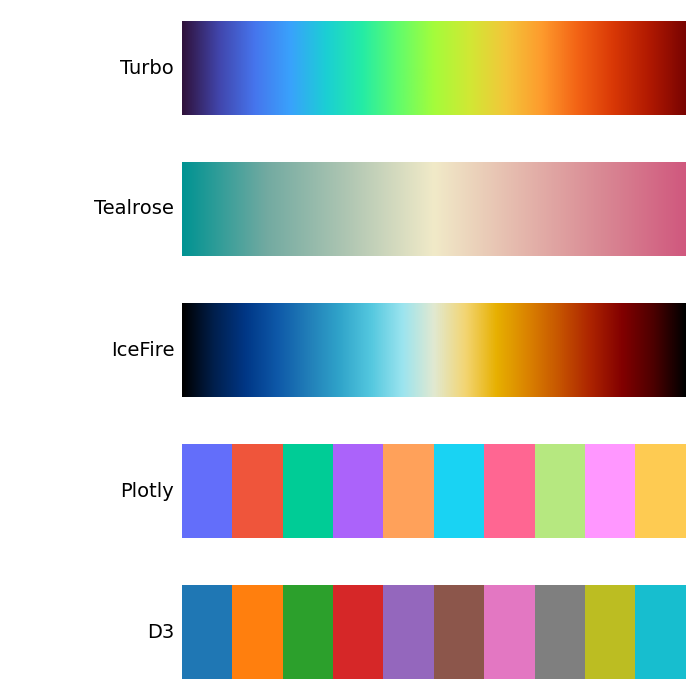
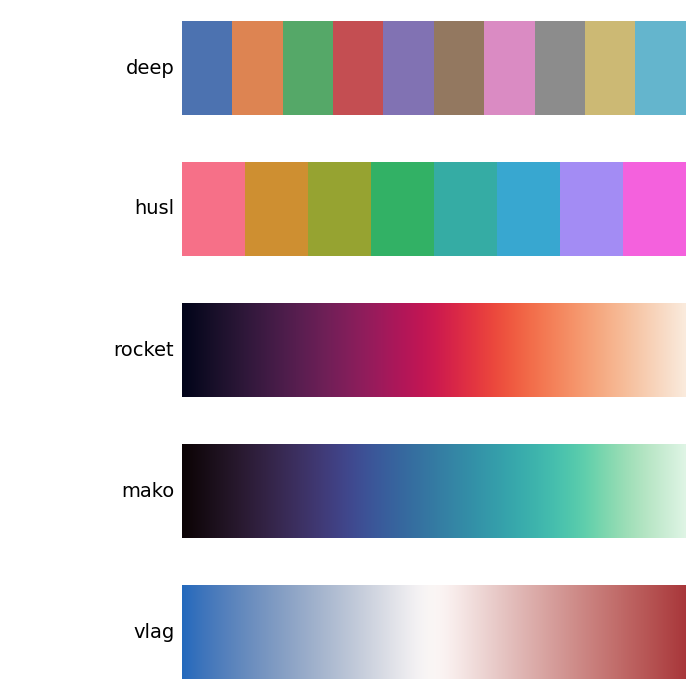
Matplotlib provides dozens of built-in colormaps: continuous or discrete color scales that you pass to the cmap argument whenever you map a numeric or categorical variable to color, for example in imshow, scatter, pcolormesh or a seaborn heatmap. This is different from the named colors page, which lists single, fixed colors instead of scales. Seaborn and plotly also ship their own color scales, not covered here — see the seaborn color palettes and plotly color scales pages.
import matplotlib.pyplot as plt
import numpy as np
data = np.random.rand(10, 10)
plt.imshow(data, cmap = “viridis”)
plt.colorbar()
plt.show()
Click on any colormap below to copy its name. Add a _r suffix (for example "viridis_r") to reverse the order of any of them.
Perceptually uniform sequential
viridis
cmap
plasma
cmap
inferno
cmap
magma
cmap
cividis
cmap
Sequential
Greys
cmap
Purples
cmap
Blues
cmap
Greens
cmap
Oranges
cmap
Reds
cmap
YlOrBr
cmap
YlOrRd
cmap
OrRd
cmap
PuRd
cmap
RdPu
cmap
BuPu
cmap
GnBu
cmap
PuBu
cmap
YlGnBu
cmap
PuBuGn
cmap
BuGn
cmap
YlGn
cmap
Sequential (2)
binary
cmap
gist_yarg
cmap
gist_gray
cmap
gray
cmap
bone
cmap
pink
cmap
spring
cmap
summer
cmap
autumn
cmap
winter
cmap
cool
cmap
Wistia
cmap
hot
cmap
afmhot
cmap
gist_heat
cmap
copper
cmap
Diverging
PiYG
cmap
PRGn
cmap
BrBG
cmap
PuOr
cmap
RdGy
cmap
RdBu
cmap
RdYlBu
cmap
RdYlGn
cmap
Spectral
cmap
coolwarm
cmap
bwr
cmap
seismic
cmap
Cyclic
twilight
cmap
twilight_shifted
cmap
hsv
cmap
Qualitative
Pastel1
cmap
Pastel2
cmap
Paired
cmap
Accent
cmap
Dark2
cmap
Set1
cmap
Set2
cmap
Set3
cmap
tab10
cmap
tab20
cmap
tab20b
cmap
tab20c
cmap
Miscellaneous
flag
cmap
prism
cmap
ocean
cmap
gist_earth
cmap
terrain
cmap
gist_stern
cmap
gnuplot
cmap
gnuplot2
cmap
CMRmap
cmap
cubehelix
cmap
brg
cmap
gist_rainbow
cmap
rainbow
cmap
jet
cmap
turbo
cmap
nipy_spectral
cmap
gist_ncar
cmap