By default matplotlib creates figures of 6.4 x 4.8 inches. This tutorial explains how to change the size of a figure, how to specify it in centimeters or pixels and how the resolution (DPI) affects the final size of the image.
Changing the figure size with figsize
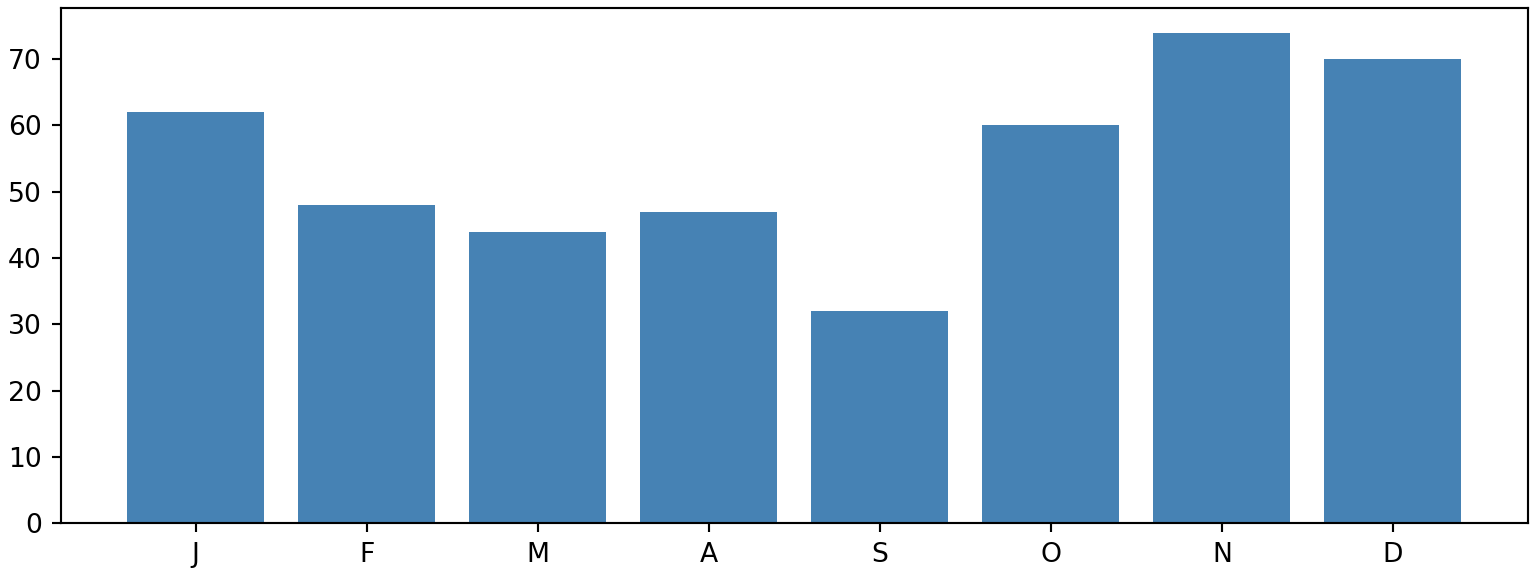
The figsize argument sets the width and height of the figure in inches. It is available in plt.subplots and plt.figure.
import matplotlib.pyplot as plt

months = ["J", "F", "M", "A", "M", "J", "J", "A", "S", "O", "N", "D"]
rain = [62, 48, 41, 47, 44, 22, 9, 12, 32, 60, 74, 70]

fig, ax = plt.subplots(figsize = (8, 3))
ax.bar(months, rain, color = "steelblue")
# plt.show()
Square figure
Use the same value for the width and the height to create a square figure. If you also need the plot area to be square regardless of the labels use ax.set_box_aspect(1).
import matplotlib.pyplot as plt

months = ["J", "F", "M", "A", "M", "J", "J", "A", "S", "O", "N", "D"]
rain = [62, 48, 41, 47, 44, 22, 9, 12, 32, 60, 74, 70]

fig, ax = plt.subplots(figsize = (4, 4), facecolor = "#EEF2F7")
ax.bar(months, rain, color = "steelblue")
ax.set_title("figsize = (4, 4)", fontsize = 16, family = "monospace")
# plt.show()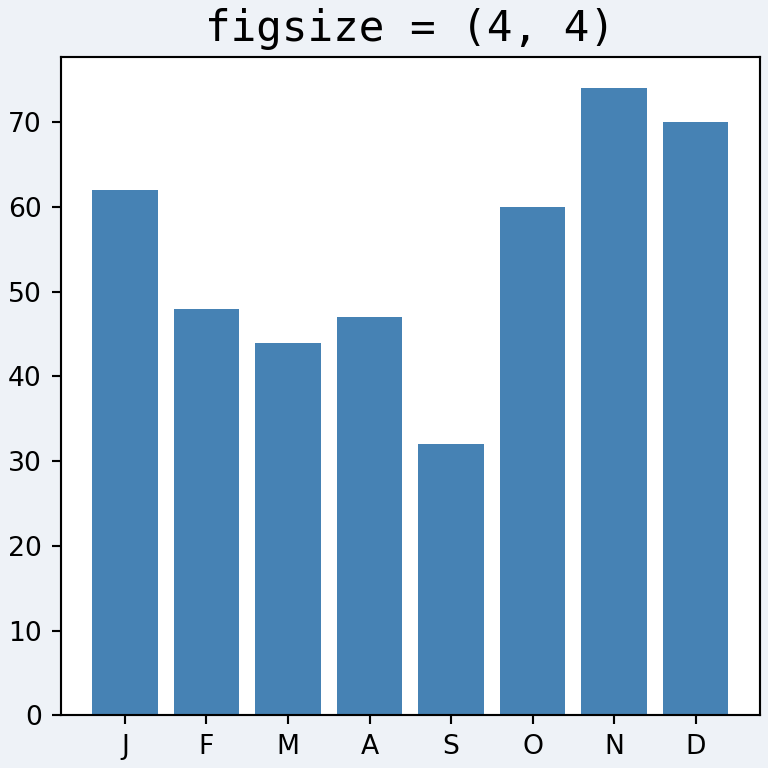
Using plt.figure
If you work with the pyplot interface you can set the size when creating the figure with plt.figure.
import matplotlib.pyplot as plt

plt.figure(figsize = (10, 5))
plt.plot([1, 2, 3], [1, 4, 9])
# plt.show()
Change the size of an existing figure
The set_size_inches method changes the size of a figure that has already been created. This is useful when the figure was created by another function, such as a seaborn or pandas plot.
import matplotlib.pyplot as plt

fig, ax = plt.subplots()
ax.plot([1, 2, 3], [1, 4, 9])

fig.set_size_inches(10, 4)
# plt.show()
Figure size in centimeters or pixels
Matplotlib only accepts inches, but you can easily convert other units. One inch equals 2.54 centimeters, so divide the size in centimeters by 2.54.
import matplotlib.pyplot as plt

cm = 1 / 2.54

fig, ax = plt.subplots(figsize = (15 * cm, 10 * cm))
ax.plot([1, 2, 3], [1, 4, 9])
# plt.show()
The size in pixels is the size in inches multiplied by the DPI (dots per inch). To create an image of exactly 800 x 400 pixels with 100 DPI you need a figure of 8 x 4 inches:
import matplotlib.pyplot as plt

px = 1 / plt.rcParams["figure.dpi"]

fig, ax = plt.subplots(figsize = (800 * px, 400 * px))
ax.plot([1, 2, 3], [1, 4, 9])
# plt.show()
Resolution (DPI)
The dpi argument controls the resolution of the figure. A higher DPI produces a bigger and sharper image with the same proportions, and the texts and lines also grow. The default value is 100.
import matplotlib.pyplot as plt

months = ["J", "F", "M", "A", "M", "J", "J", "A", "S", "O", "N", "D"]
rain = [62, 48, 41, 47, 44, 22, 9, 12, 32, 60, 74, 70]

fig, ax = plt.subplots(figsize = (4, 4), dpi = 50)
ax.bar(months, rain, color = "steelblue")
# plt.show()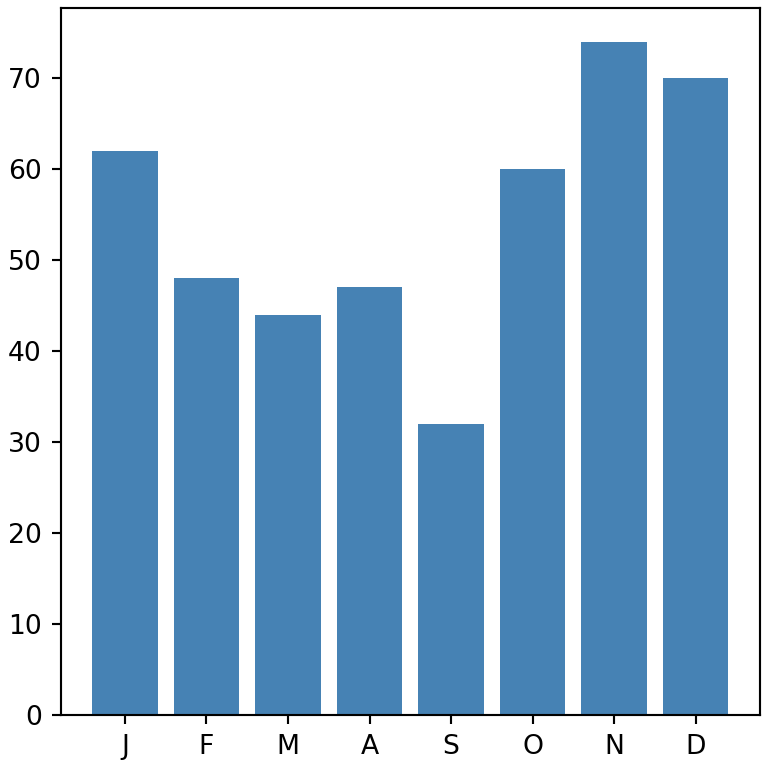
To change the resolution of the file you save, use the dpi argument of savefig, explained in the tutorial about saving figures in matplotlib.
Change the default figure size
To use the same size for all the figures of a script or a notebook change the figure.figsize and figure.dpi parameters with rcParams. All the figures created afterwards will have this size.
import matplotlib.pyplot as plt

plt.rcParams["figure.figsize"] = (8, 5)
plt.rcParams["figure.dpi"] = 120
When a figure has several subplots, the size is shared among all of them. See the subplots in matplotlib tutorial to learn how to adjust the size and the spacing of each subplot.