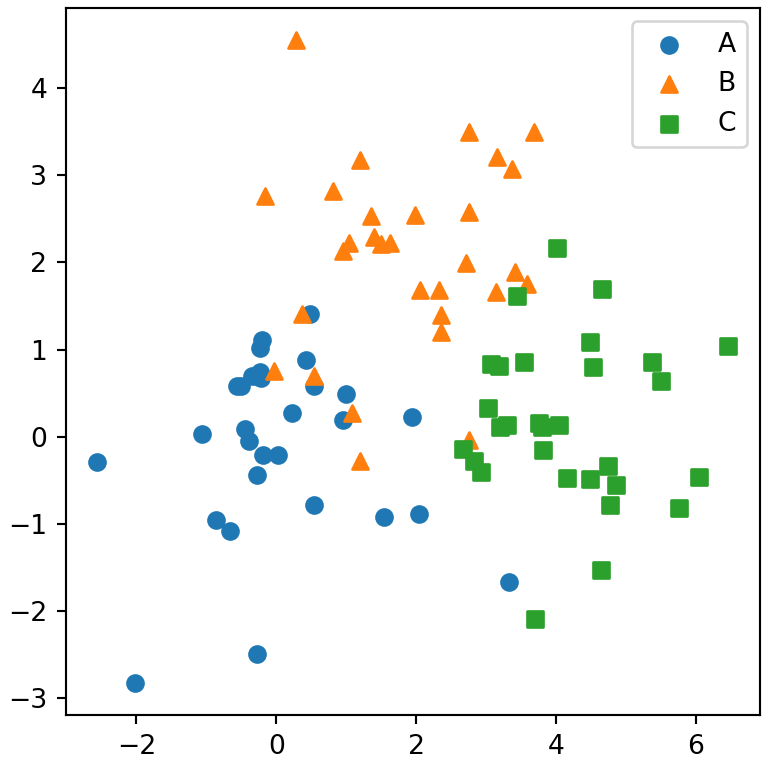
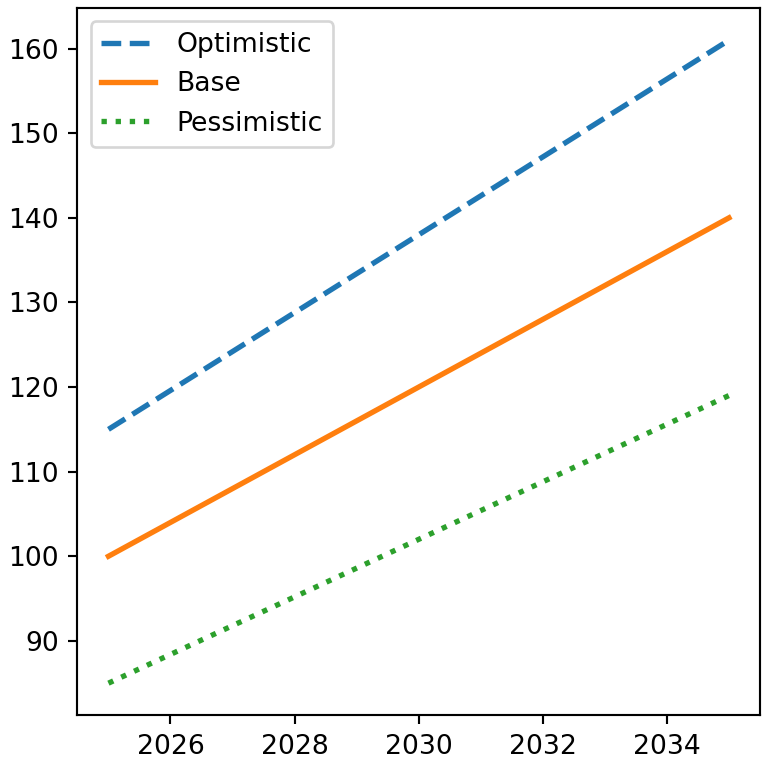
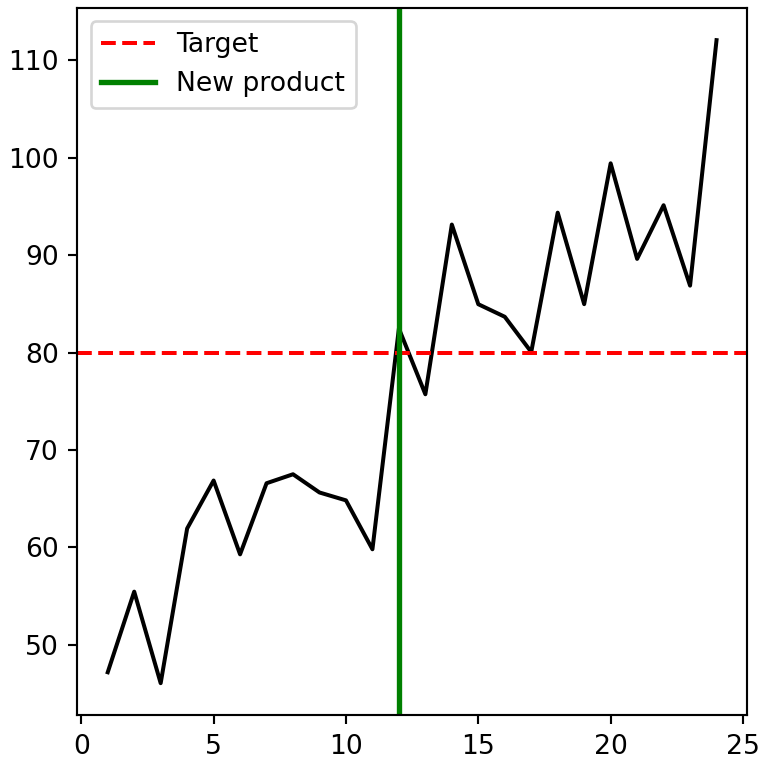
A legend explains what each line, group of points or bar of a chart represents. In matplotlib you can add a legend with plt.legend or ax.legend, and customize its position, appearance and content with the arguments described in this tutorial.
Adding a legend with legend
The easiest way to add a legend in matplotlib is setting a label for each element of the plot and then calling legend. Elements without a label won’t be displayed on the legend.
import matplotlib.pyplot as plt

months = ["Jan", "Feb", "Mar", "Apr", "May", "Jun"]
shop_a = [20, 24, 27, 25, 30, 34]
shop_b = [15, 18, 17, 21, 23, 22]
shop_c = [10, 12, 15, 14, 16, 19]

fig, ax = plt.subplots()
ax.plot(months, shop_a, label = "Shop A")
ax.plot(months, shop_b, label = "Shop B")

ax.legend()
# plt.show()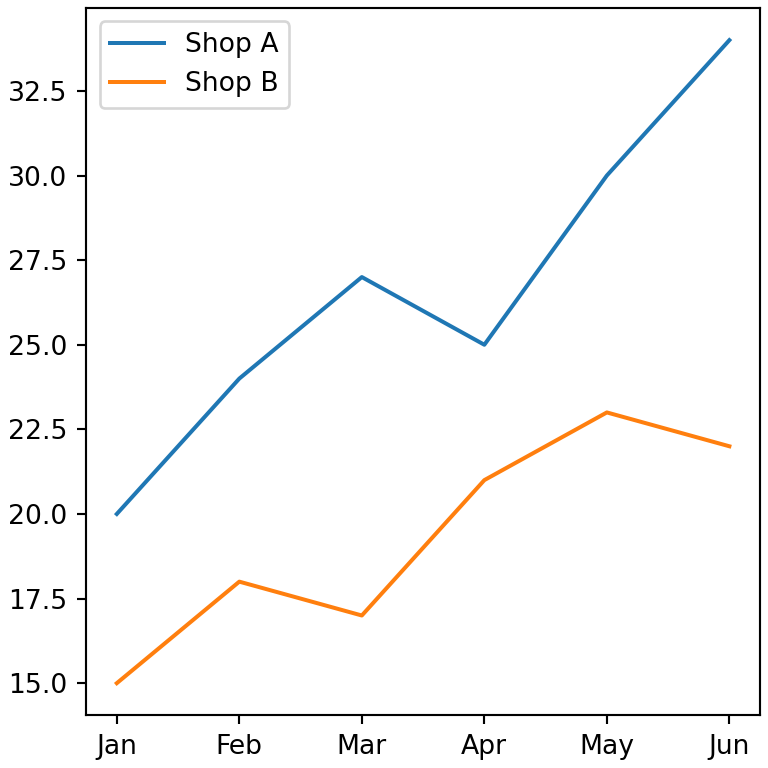
Labels inside legend
Alternatively, you can pass the labels directly to legend as a list, in the same order in which the elements were plotted.
import matplotlib.pyplot as plt

months = ["Jan", "Feb", "Mar", "Apr", "May", "Jun"]
shop_a = [20, 24, 27, 25, 30, 34]
shop_b = [15, 18, 17, 21, 23, 22]
shop_c = [10, 12, 15, 14, 16, 19]

fig, ax = plt.subplots()
ax.plot(months, shop_a)
ax.plot(months, shop_b)

ax.legend(["Shop A", "Shop B"])
# plt.show()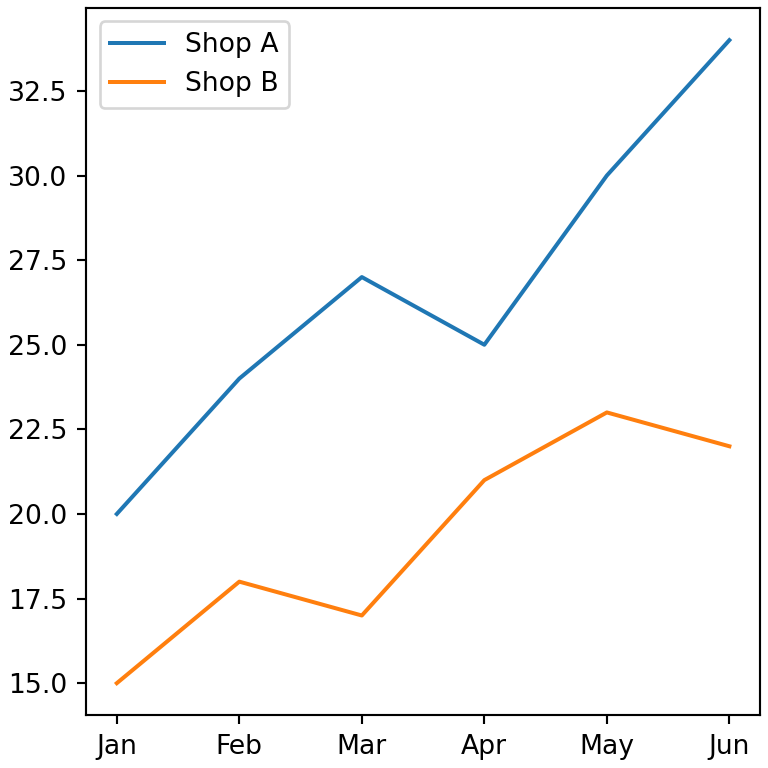
Legend position
By default matplotlib places the legend in the location with the least overlap with the data (loc = "best"). Use the loc argument to choose another position.
import matplotlib.pyplot as plt

months = ["Jan", "Feb", "Mar", "Apr", "May", "Jun"]
shop_a = [20, 24, 27, 25, 30, 34]
shop_b = [15, 18, 17, 21, 23, 22]
shop_c = [10, 12, 15, 14, 16, 19]

fig, ax = plt.subplots()
ax.plot(months, shop_a, label = "Shop A")
ax.plot(months, shop_b, label = "Shop B")

ax.legend(loc = "lower right")
# plt.show()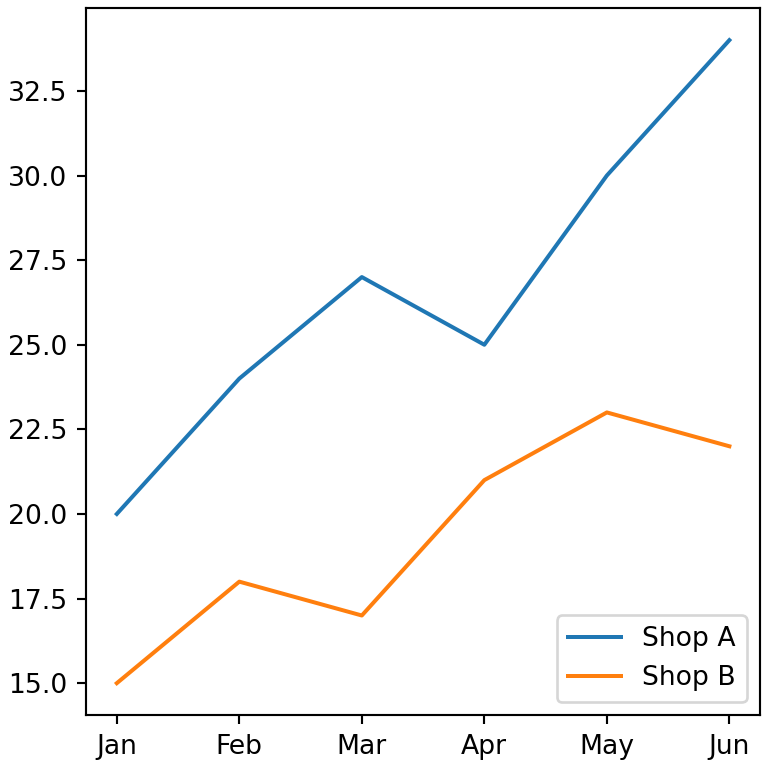
The possible values for loc are "best", "upper right", "upper left", "lower left", "lower right", "right", "center left", "center right", "lower center", "upper center" and "center". You can also pass a tuple with the coordinates of the lower left corner of the legend in axes coordinates, such as loc = (0.1, 0.6).
Legend outside the plot
To place the legend outside the plot combine loc with bbox_to_anchor. The anchor sets the point of the axes where the legend will be placed and loc which corner of the legend is placed on that point. Use bbox_inches = "tight" when saving the figure so the legend is not cropped.
import matplotlib.pyplot as plt

months = ["Jan", "Feb", "Mar", "Apr", "May", "Jun"]
shop_a = [20, 24, 27, 25, 30, 34]
shop_b = [15, 18, 17, 21, 23, 22]
shop_c = [10, 12, 15, 14, 16, 19]

fig, ax = plt.subplots()
ax.plot(months, shop_a, marker = "o", label = "Shop A")
ax.plot(months, shop_b, marker = "o", label = "Shop B")
ax.plot(months, shop_c, marker = "o", label = "Shop C")

ax.legend(loc = "upper left", bbox_to_anchor = (1, 1),
          title = "Shops", fontsize = 12)
# plt.show()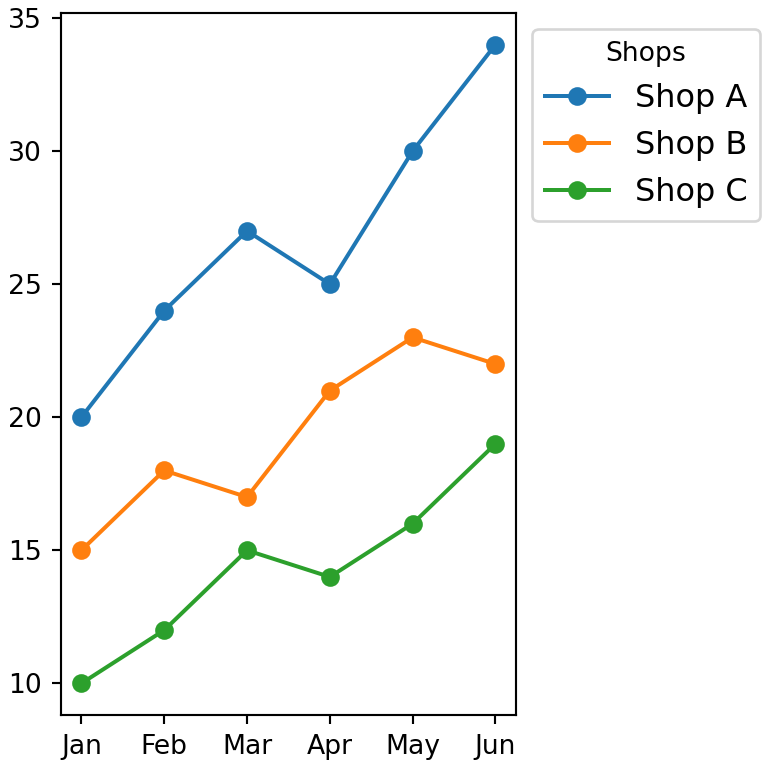
Legend below the plot
A legend below the plot is usually displayed horizontally. Set the number of columns with ncol, equal to the number of elements.
import matplotlib.pyplot as plt

months = ["Jan", "Feb", "Mar", "Apr", "May", "Jun"]
shop_a = [20, 24, 27, 25, 30, 34]
shop_b = [15, 18, 17, 21, 23, 22]
shop_c = [10, 12, 15, 14, 16, 19]

fig, ax = plt.subplots()
ax.plot(months, shop_a, label = "Shop A")
ax.plot(months, shop_b, label = "Shop B")
ax.plot(months, shop_c, label = "Shop C")

ax.legend(loc = "upper center", bbox_to_anchor = (0.5, -0.1),
          ncol = 3)
# plt.show()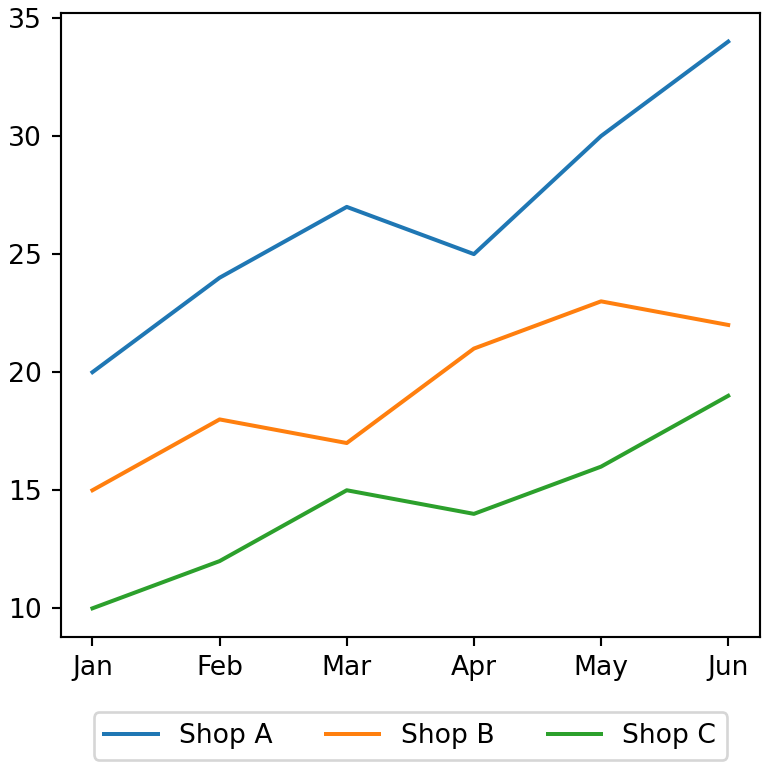
Legend customization
Legend title
Add a title to the legend with the title argument and change its size with title_fontsize.
import matplotlib.pyplot as plt

months = ["Jan", "Feb", "Mar", "Apr", "May", "Jun"]
shop_a = [20, 24, 27, 25, 30, 34]
shop_b = [15, 18, 17, 21, 23, 22]
shop_c = [10, 12, 15, 14, 16, 19]

fig, ax = plt.subplots()
ax.plot(months, shop_a, label = "Shop A")
ax.plot(months, shop_b, label = "Shop B")

ax.legend(title = "Shops", title_fontsize = 12)
# plt.show()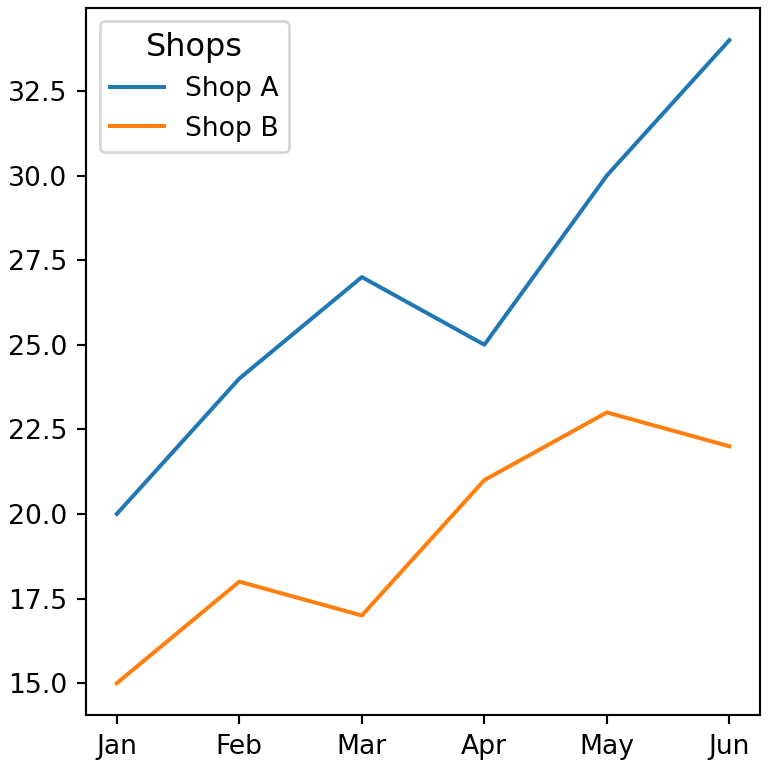
Font size
The fontsize argument controls the size of the labels. It accepts a number or a string such as "small", "medium" or "large".
import matplotlib.pyplot as plt

months = ["Jan", "Feb", "Mar", "Apr", "May", "Jun"]
shop_a = [20, 24, 27, 25, 30, 34]
shop_b = [15, 18, 17, 21, 23, 22]
shop_c = [10, 12, 15, 14, 16, 19]

fig, ax = plt.subplots()
ax.plot(months, shop_a, label = "Shop A")
ax.plot(months, shop_b, label = "Shop B")

ax.legend(fontsize = 14)
# plt.show()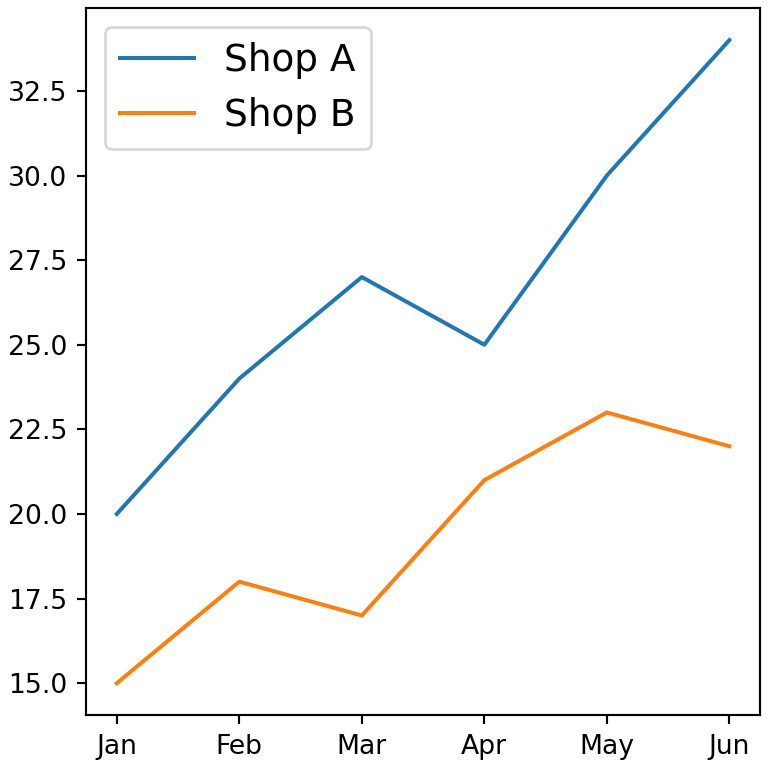
Frame and background
Customize the box of the legend with facecolor (background), edgecolor (border), framealpha (transparency) and shadow, or remove the box with frameon = False.
import matplotlib.pyplot as plt

months = ["Jan", "Feb", "Mar", "Apr", "May", "Jun"]
shop_a = [20, 24, 27, 25, 30, 34]
shop_b = [15, 18, 17, 21, 23, 22]
shop_c = [10, 12, 15, 14, 16, 19]

fig, ax = plt.subplots()
ax.plot(months, shop_a, label = "Shop A")
ax.plot(months, shop_b, label = "Shop B")

ax.legend(facecolor = "lightyellow", edgecolor = "black",
          framealpha = 1, shadow = True)
# plt.show()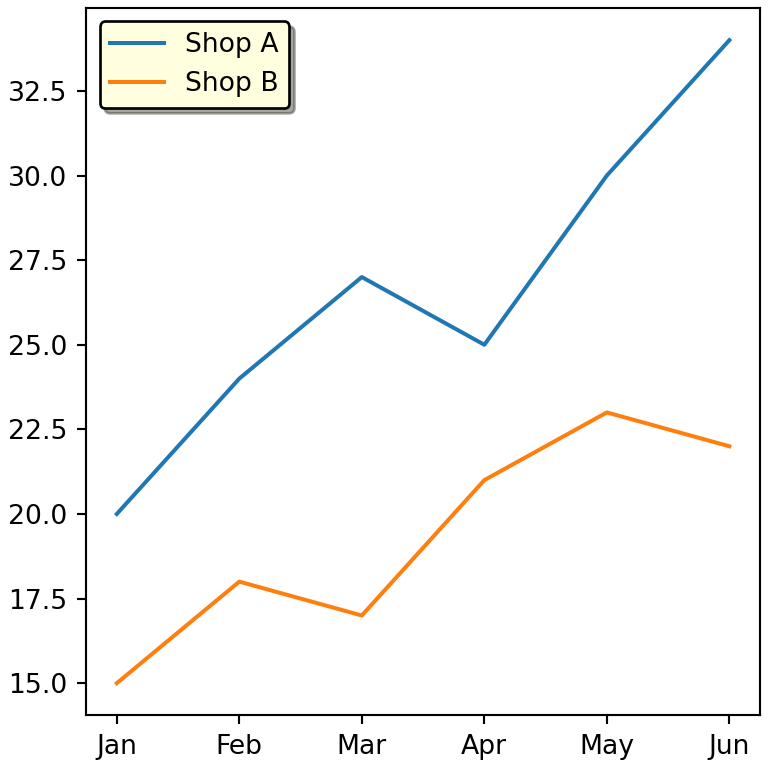
Legend without box
import matplotlib.pyplot as plt

months = ["Jan", "Feb", "Mar", "Apr", "May", "Jun"]
shop_a = [20, 24, 27, 25, 30, 34]
shop_b = [15, 18, 17, 21, 23, 22]
shop_c = [10, 12, 15, 14, 16, 19]

fig, ax = plt.subplots()
ax.plot(months, shop_a, label = "Shop A")
ax.plot(months, shop_b, label = "Shop B")

ax.legend(frameon = False)
# plt.show()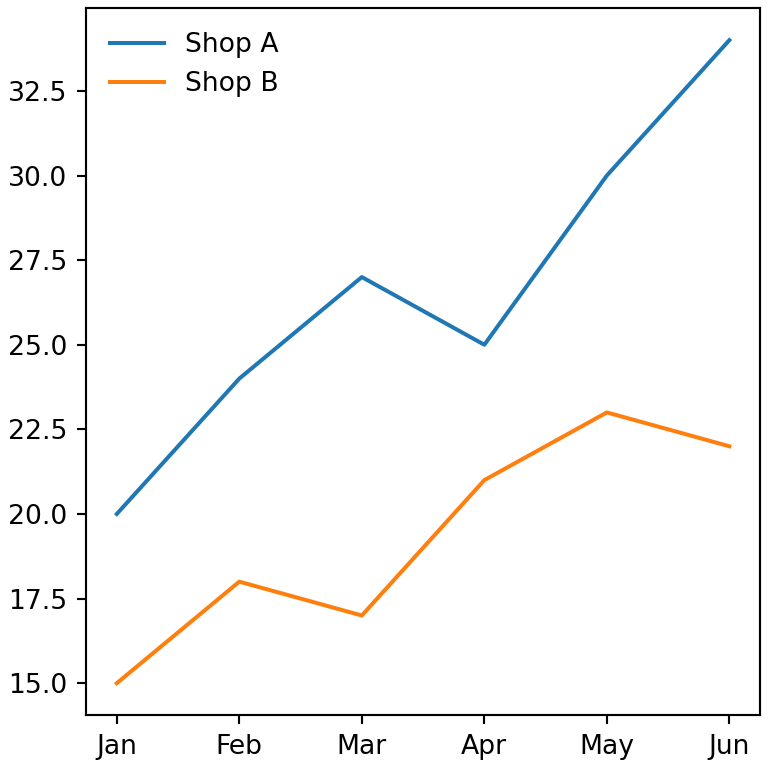
Symbol size and spacing
When the markers of a scatter plot are small, use markerscale to enlarge them only in the legend. Other useful arguments are labelspacing (vertical space between entries), handlelength (length of the lines) and borderpad.
import numpy as np
import matplotlib.pyplot as plt

rng = np.random.default_rng(1)

fig, ax = plt.subplots()
ax.scatter(rng.normal(0, 1, 50), rng.normal(0, 1, 50), s = 10, label = "Group A")
ax.scatter(rng.normal(2, 1, 50), rng.normal(2, 1, 50), s = 10, label = "Group B")

ax.legend(markerscale = 3, labelspacing = 1.2)
# plt.show()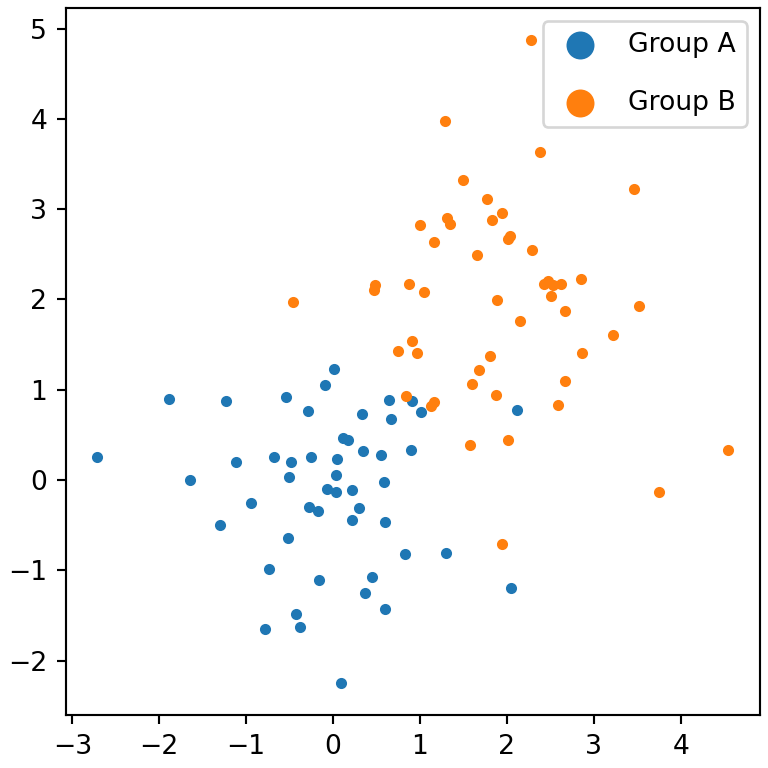
Reverse the order of the legend
Use reverse = True (matplotlib 3.7 or newer) to reverse the order of the items. For any other order get the handles and labels with get_legend_handles_labels and reorder them.
import matplotlib.pyplot as plt

months = ["Jan", "Feb", "Mar", "Apr", "May", "Jun"]
shop_a = [20, 24, 27, 25, 30, 34]
shop_b = [15, 18, 17, 21, 23, 22]
shop_c = [10, 12, 15, 14, 16, 19]

fig, ax = plt.subplots()
ax.plot(months, shop_a, label = "Shop A")
ax.plot(months, shop_b, label = "Shop B")
ax.plot(months, shop_c, label = "Shop C")

ax.legend(reverse = True)
# plt.show()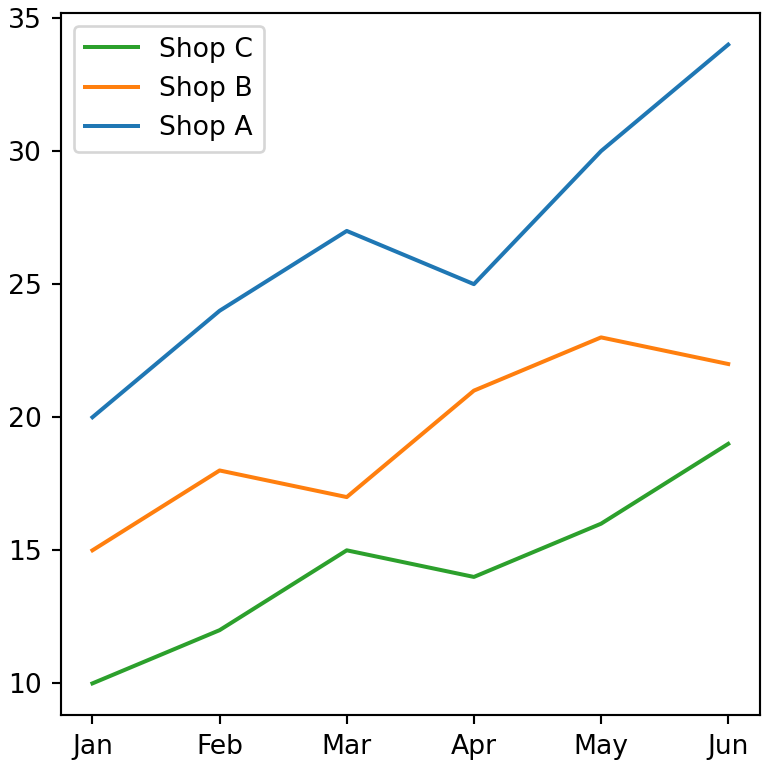
Custom legends
Sometimes the legend needs elements that are not in the plot, for instance when the colors of the points depend on a variable. In this scenario you can create the elements of the legend manually with Line2D (lines and markers) or Patch (filled areas) and pass them to the handles argument.
import matplotlib.pyplot as plt
from matplotlib.lines import Line2D
from matplotlib.patches import Patch

fig, ax = plt.subplots()
ax.bar(["A", "B", "C"], [3, 5, 2], color = ["tab:blue", "tab:blue", "tab:red"])
ax.axhline(4, color = "black", linestyle = "--")

handles = [Patch(color = "tab:blue", label = "Normal"),
           Patch(color = "tab:red", label = "Alert"),
           Line2D([0], [0], color = "black", linestyle = "--", label = "Target")]

ax.legend(handles = handles)
# plt.show()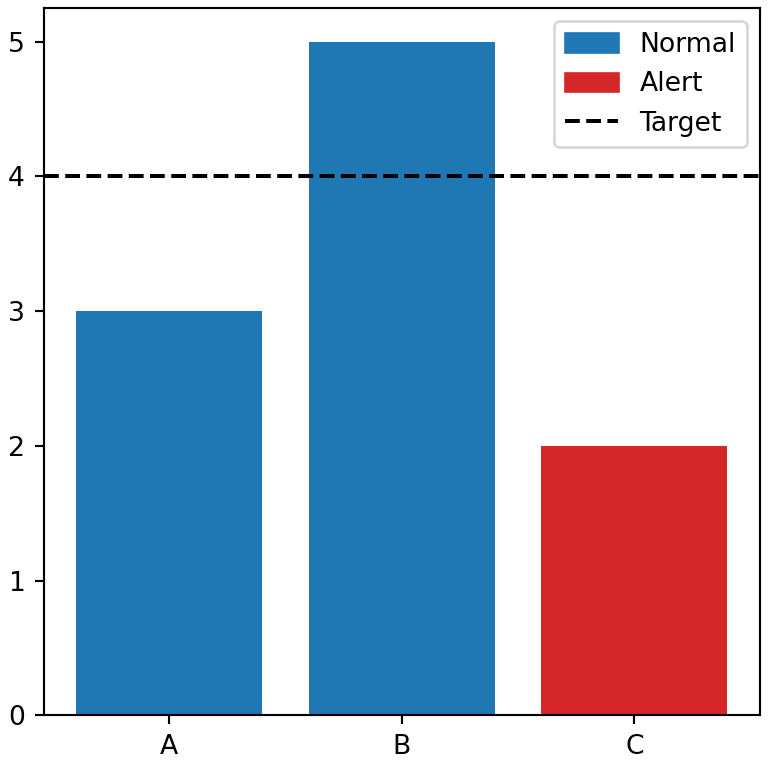
One legend for several subplots
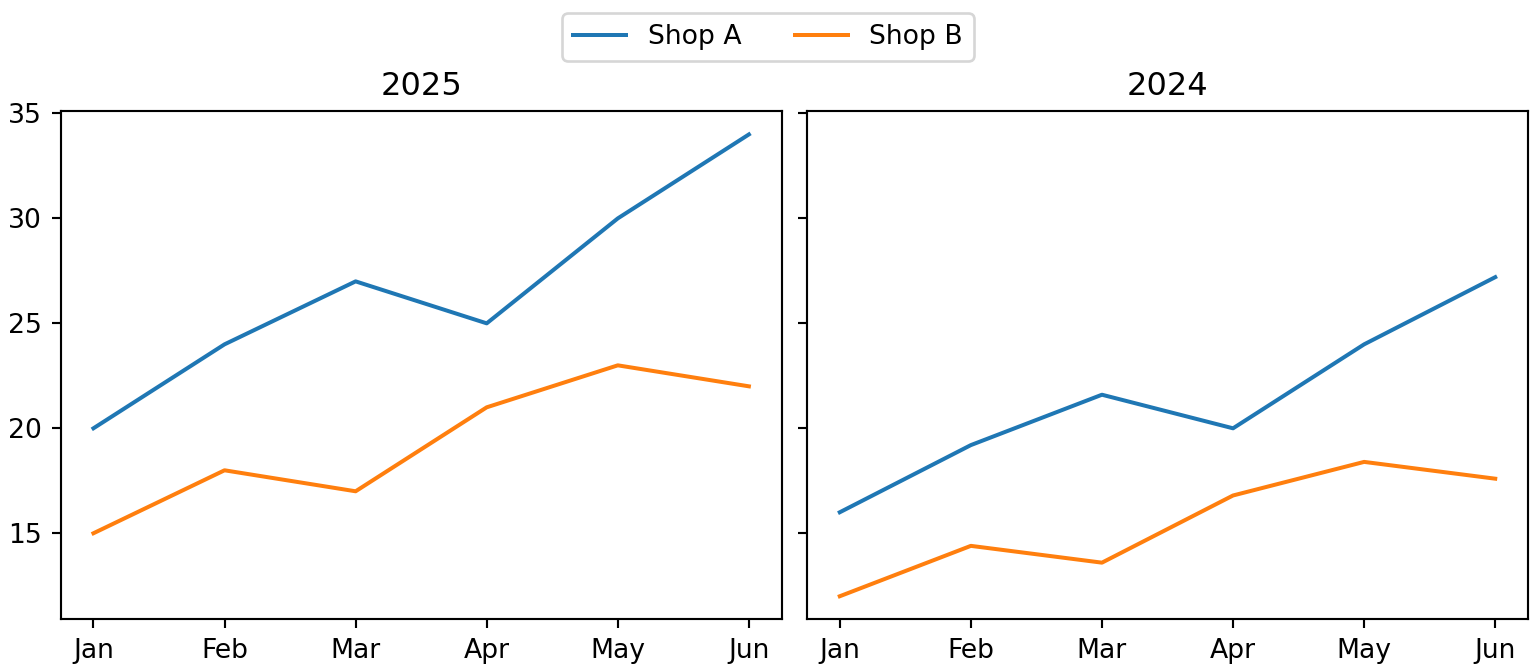
When all the subplots share the same groups, use fig.legend to add a single legend for the whole figure instead of one legend per subplot. With layout = "constrained" you can use locations like "outside upper center" or "outside right upper" (matplotlib 3.7 or newer) to place the legend outside the subplots without overlapping them.
import matplotlib.pyplot as plt

months = ["Jan", "Feb", "Mar", "Apr", "May", "Jun"]
shop_a = [20, 24, 27, 25, 30, 34]
shop_b = [15, 18, 17, 21, 23, 22]
shop_c = [10, 12, 15, 14, 16, 19]

fig, (ax1, ax2) = plt.subplots(1, 2, figsize = (8, 3.5), layout = "constrained", sharey = True)
ax1.plot(months, shop_a, label = "Shop A")
ax1.plot(months, shop_b, label = "Shop B")
ax1.set_title("2025")
ax2.plot(months, [v * 0.8 for v in shop_a])
ax2.plot(months, [v * 0.8 for v in shop_b])
ax2.set_title("2024")

fig.legend(loc = "outside upper center", ncol = 2)
# plt.show()
Remove the legend
Some functions, like the plot method of pandas or several seaborn functions, add a legend automatically. To remove it call ax.get_legend().remove() or pass legend = False to the function that creates the plot. To hide a single element of the legend set its label to a string starting with an underscore, such as label = "_nolegend_".
ax.get_legend().remove()Learn also how to add titles and texts and annotations to your plots, or how to choose the colors of each group.