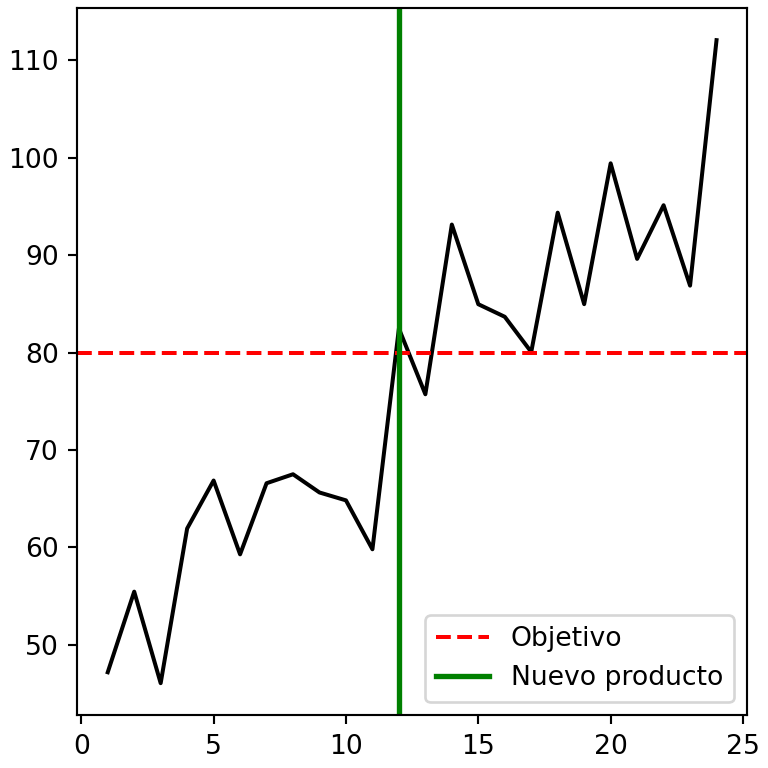
Una leyenda explica qué representa cada línea, grupo de puntos o barra de un gráfico. En matplotlib puedes agregar una leyenda con plt.legend o ax.legend y personalizar su posición, su aspecto y su contenido con los argumentos que se explican en este tutorial.
Agregar una leyenda con legend
La forma más sencilla de agregar una leyenda en matplotlib es asignar una etiqueta (label) a cada elemento del gráfico y después llamar a legend. Los elementos sin etiqueta no aparecerán en la leyenda.
import matplotlib.pyplot as plt

months = ["Ene", "Feb", "Mar", "Abr", "May", "Jun"]
shop_a = [20, 24, 27, 25, 30, 34]
shop_b = [15, 18, 17, 21, 23, 22]
shop_c = [10, 12, 15, 14, 16, 19]

fig, ax = plt.subplots()
ax.plot(months, shop_a, label = "Tienda A")
ax.plot(months, shop_b, label = "Tienda B")

ax.legend()
# plt.show()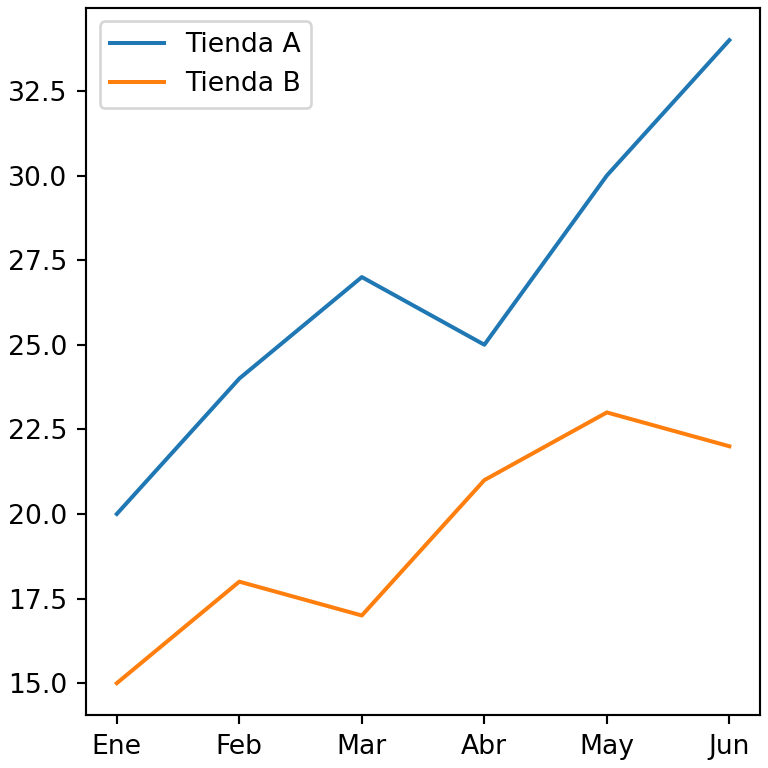
Etiquetas dentro de legend
También puedes pasar las etiquetas directamente a legend en forma de lista, en el mismo orden en el que se dibujaron los elementos.
import matplotlib.pyplot as plt

months = ["Ene", "Feb", "Mar", "Abr", "May", "Jun"]
shop_a = [20, 24, 27, 25, 30, 34]
shop_b = [15, 18, 17, 21, 23, 22]
shop_c = [10, 12, 15, 14, 16, 19]

fig, ax = plt.subplots()
ax.plot(months, shop_a)
ax.plot(months, shop_b)

ax.legend(["Tienda A", "Tienda B"])
# plt.show()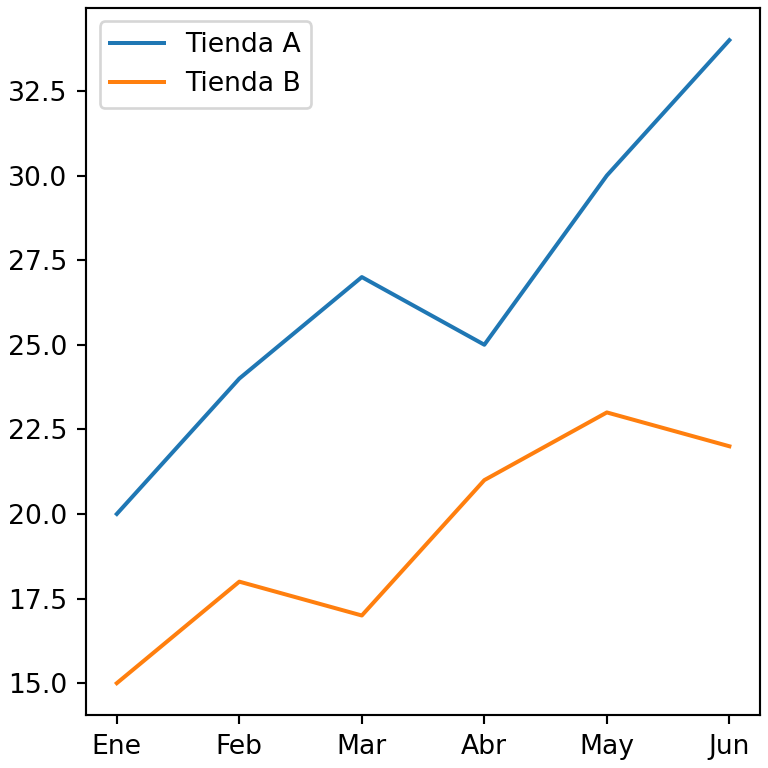
Posición de la leyenda
Por defecto matplotlib coloca la leyenda en la posición en la que menos se solapa con los datos (loc = "best"). Utiliza el argumento loc para elegir otra posición.
import matplotlib.pyplot as plt

months = ["Ene", "Feb", "Mar", "Abr", "May", "Jun"]
shop_a = [20, 24, 27, 25, 30, 34]
shop_b = [15, 18, 17, 21, 23, 22]
shop_c = [10, 12, 15, 14, 16, 19]

fig, ax = plt.subplots()
ax.plot(months, shop_a, label = "Tienda A")
ax.plot(months, shop_b, label = "Tienda B")

ax.legend(loc = "lower right")
# plt.show()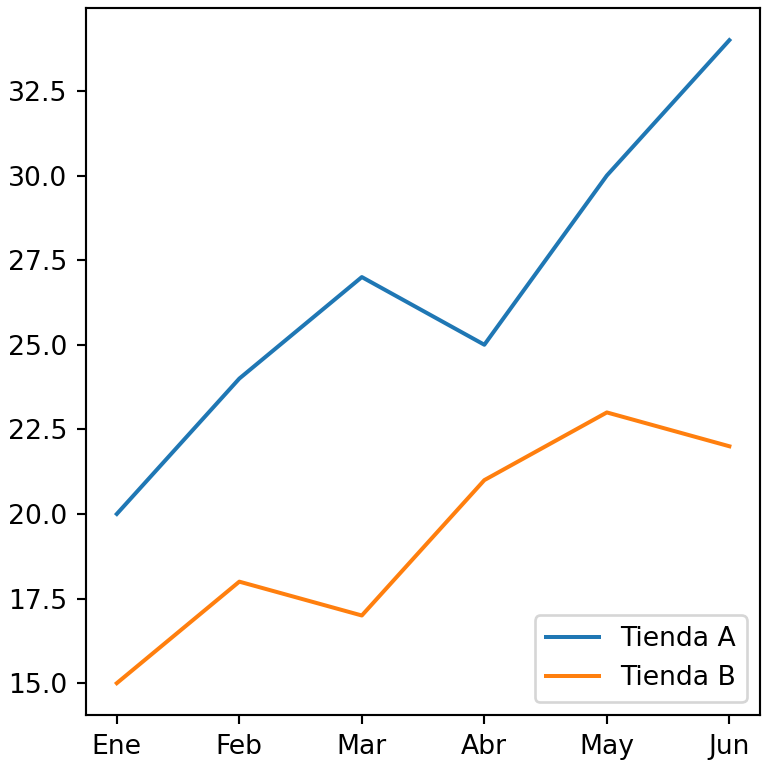
Los valores posibles de loc son "best", "upper right", "upper left", "lower left", "lower right", "right", "center left", "center right", "lower center", "upper center" y "center". También puedes pasar una tupla con las coordenadas de la esquina inferior izquierda de la leyenda en coordenadas de los ejes, como loc = (0.1, 0.6).
Leyenda fuera del gráfico
Para colocar la leyenda fuera del gráfico combina loc con bbox_to_anchor. El ancla indica el punto de los ejes donde se colocará la leyenda y loc qué esquina de la leyenda se sitúa en ese punto. Utiliza bbox_inches = "tight" al guardar la figura para que la leyenda no quede recortada.
import matplotlib.pyplot as plt

months = ["Ene", "Feb", "Mar", "Abr", "May", "Jun"]
shop_a = [20, 24, 27, 25, 30, 34]
shop_b = [15, 18, 17, 21, 23, 22]
shop_c = [10, 12, 15, 14, 16, 19]

fig, ax = plt.subplots()
ax.plot(months, shop_a, marker = "o", label = "Tienda A")
ax.plot(months, shop_b, marker = "o", label = "Tienda B")
ax.plot(months, shop_c, marker = "o", label = "Tienda C")

ax.legend(loc = "upper left", bbox_to_anchor = (1, 1),
          title = "Tiendas", fontsize = 12)
# plt.show()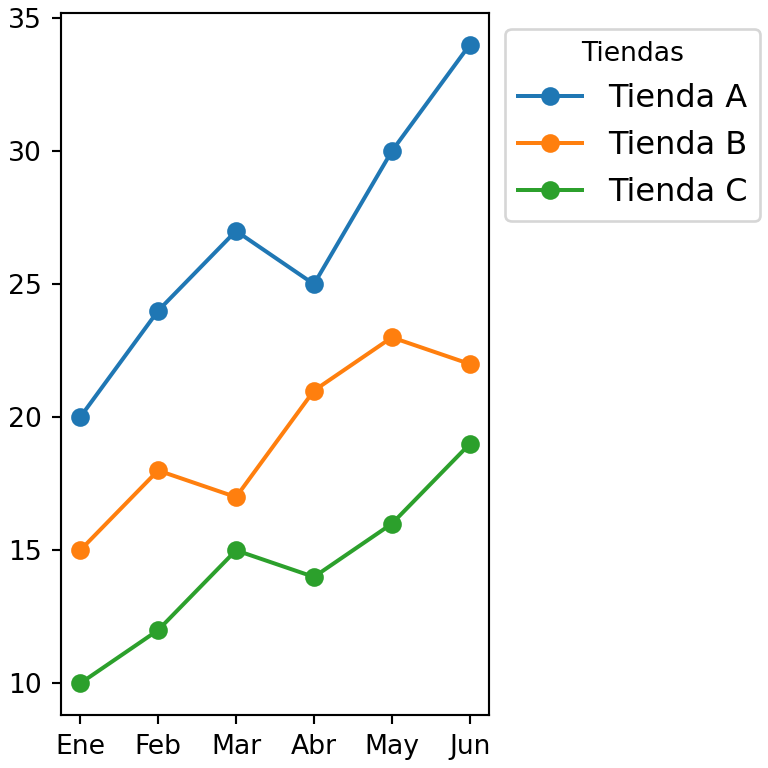
Leyenda debajo del gráfico
Una leyenda debajo del gráfico suele mostrarse en horizontal. Establece el número de columnas con ncol, igual al número de elementos.
import matplotlib.pyplot as plt

months = ["Ene", "Feb", "Mar", "Abr", "May", "Jun"]
shop_a = [20, 24, 27, 25, 30, 34]
shop_b = [15, 18, 17, 21, 23, 22]
shop_c = [10, 12, 15, 14, 16, 19]

fig, ax = plt.subplots()
ax.plot(months, shop_a, label = "Tienda A")
ax.plot(months, shop_b, label = "Tienda B")
ax.plot(months, shop_c, label = "Tienda C")

ax.legend(loc = "upper center", bbox_to_anchor = (0.5, -0.1),
          ncol = 3)
# plt.show()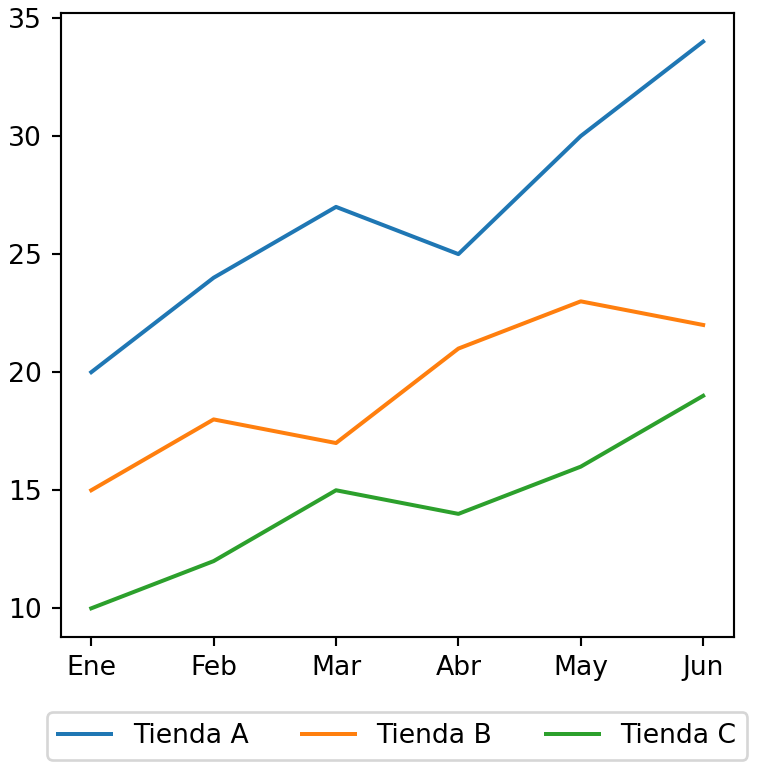
Personalización de la leyenda
Título de la leyenda
Agrega un título a la leyenda con el argumento title y cambia su tamaño con title_fontsize.
import matplotlib.pyplot as plt

months = ["Ene", "Feb", "Mar", "Abr", "May", "Jun"]
shop_a = [20, 24, 27, 25, 30, 34]
shop_b = [15, 18, 17, 21, 23, 22]
shop_c = [10, 12, 15, 14, 16, 19]

fig, ax = plt.subplots()
ax.plot(months, shop_a, label = "Tienda A")
ax.plot(months, shop_b, label = "Tienda B")

ax.legend(title = "Tiendas", title_fontsize = 12)
# plt.show()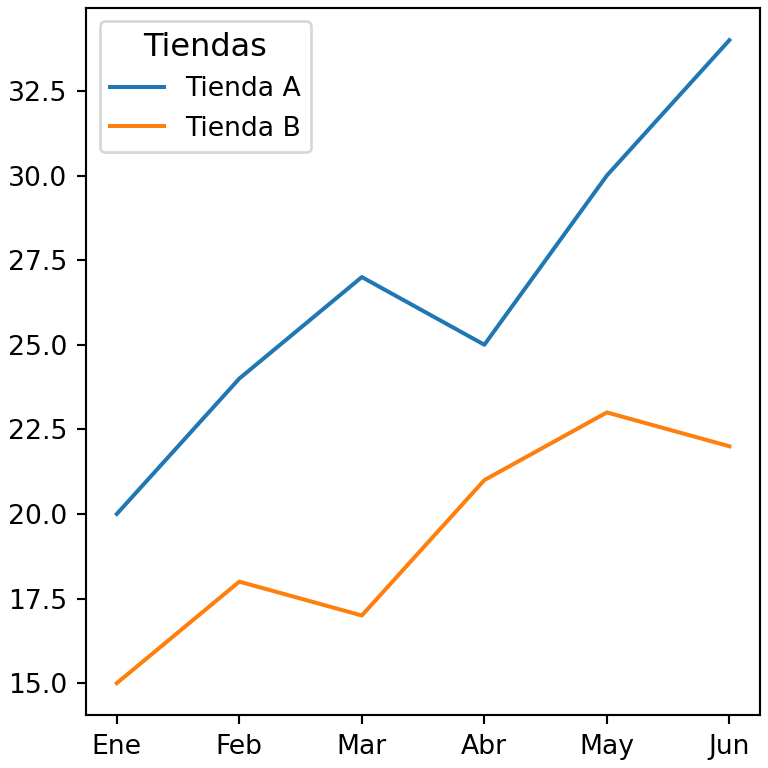
Tamaño de fuente
El argumento fontsize controla el tamaño de las etiquetas. Admite un número o una cadena de texto como "small", "medium" o "large".
import matplotlib.pyplot as plt

months = ["Ene", "Feb", "Mar", "Abr", "May", "Jun"]
shop_a = [20, 24, 27, 25, 30, 34]
shop_b = [15, 18, 17, 21, 23, 22]
shop_c = [10, 12, 15, 14, 16, 19]

fig, ax = plt.subplots()
ax.plot(months, shop_a, label = "Tienda A")
ax.plot(months, shop_b, label = "Tienda B")

ax.legend(fontsize = 14)
# plt.show()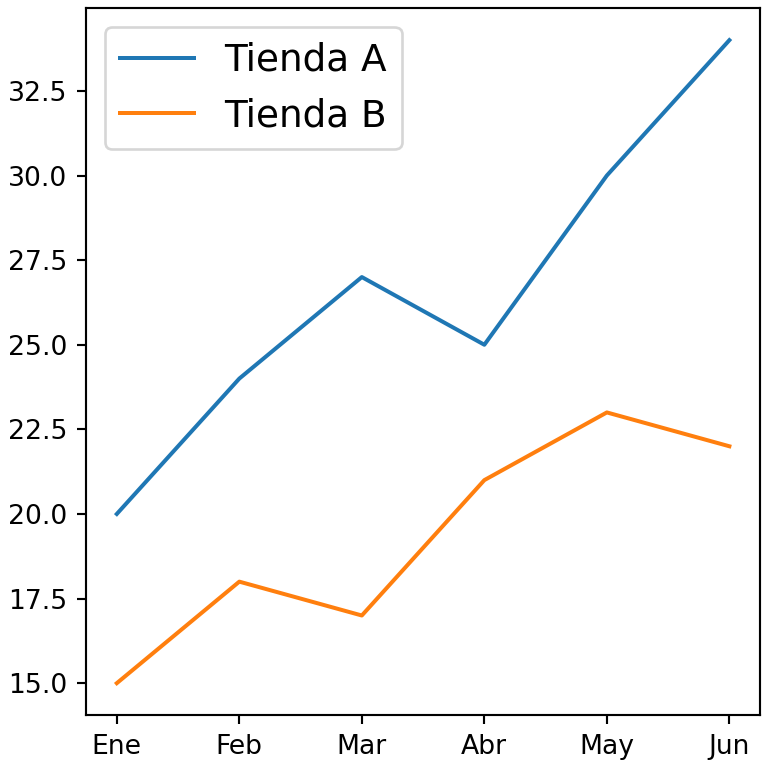
Borde y fondo
Personaliza la caja de la leyenda con facecolor (fondo), edgecolor (borde), framealpha (transparencia) y shadow, o elimina la caja con frameon = False.
import matplotlib.pyplot as plt

months = ["Ene", "Feb", "Mar", "Abr", "May", "Jun"]
shop_a = [20, 24, 27, 25, 30, 34]
shop_b = [15, 18, 17, 21, 23, 22]
shop_c = [10, 12, 15, 14, 16, 19]

fig, ax = plt.subplots()
ax.plot(months, shop_a, label = "Tienda A")
ax.plot(months, shop_b, label = "Tienda B")

ax.legend(facecolor = "lightyellow", edgecolor = "black",
          framealpha = 1, shadow = True)
# plt.show()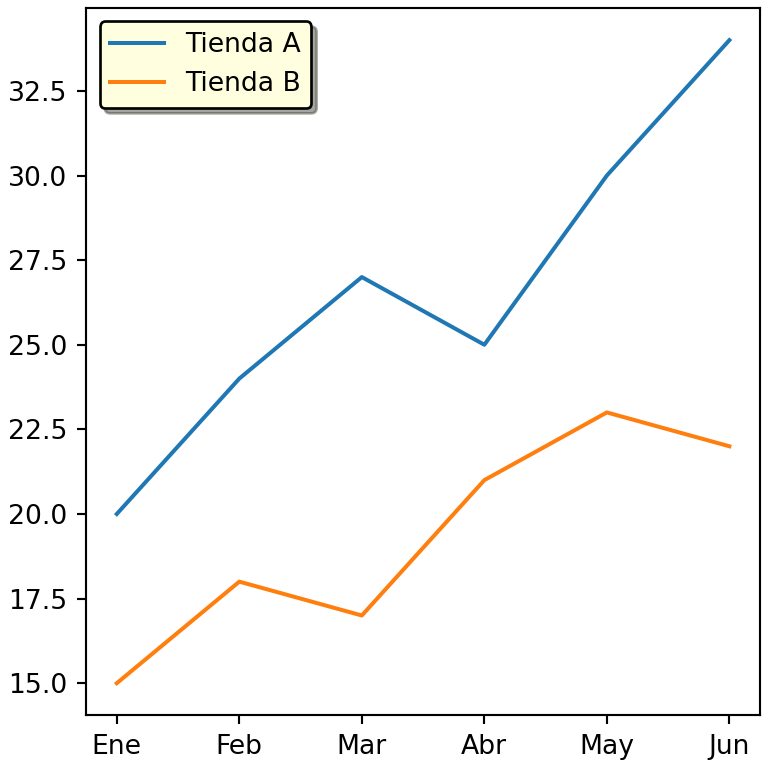
Leyenda sin caja
import matplotlib.pyplot as plt

months = ["Ene", "Feb", "Mar", "Abr", "May", "Jun"]
shop_a = [20, 24, 27, 25, 30, 34]
shop_b = [15, 18, 17, 21, 23, 22]
shop_c = [10, 12, 15, 14, 16, 19]

fig, ax = plt.subplots()
ax.plot(months, shop_a, label = "Tienda A")
ax.plot(months, shop_b, label = "Tienda B")

ax.legend(frameon = False)
# plt.show()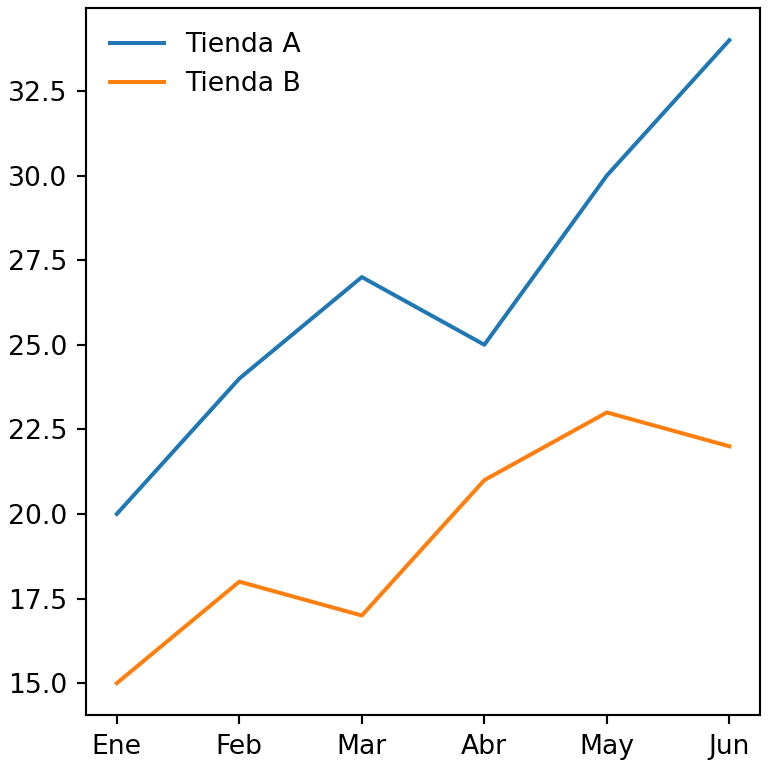
Tamaño de los símbolos y espaciado
Cuando los puntos de un gráfico de dispersión son pequeños, utiliza markerscale para agrandarlos solo en la leyenda. Otros argumentos útiles son labelspacing (espacio vertical entre elementos), handlelength (longitud de las líneas) y borderpad.
import numpy as np
import matplotlib.pyplot as plt

rng = np.random.default_rng(1)

fig, ax = plt.subplots()
ax.scatter(rng.normal(0, 1, 50), rng.normal(0, 1, 50), s = 10, label = "Grupo A")
ax.scatter(rng.normal(2, 1, 50), rng.normal(2, 1, 50), s = 10, label = "Grupo B")

ax.legend(markerscale = 3, labelspacing = 1.2)
# plt.show()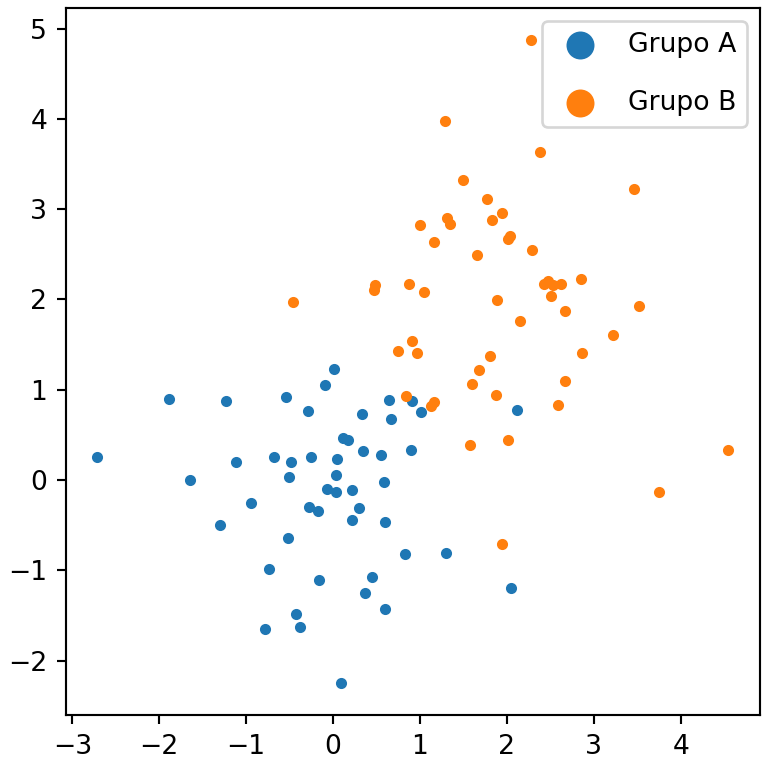
Invertir el orden de la leyenda
Utiliza reverse = True (matplotlib 3.7 o posterior) para invertir el orden de los elementos. Para cualquier otro orden obtén los símbolos y las etiquetas con get_legend_handles_labels y reordénalos.
import matplotlib.pyplot as plt

months = ["Ene", "Feb", "Mar", "Abr", "May", "Jun"]
shop_a = [20, 24, 27, 25, 30, 34]
shop_b = [15, 18, 17, 21, 23, 22]
shop_c = [10, 12, 15, 14, 16, 19]

fig, ax = plt.subplots()
ax.plot(months, shop_a, label = "Tienda A")
ax.plot(months, shop_b, label = "Tienda B")
ax.plot(months, shop_c, label = "Tienda C")

ax.legend(reverse = True)
# plt.show()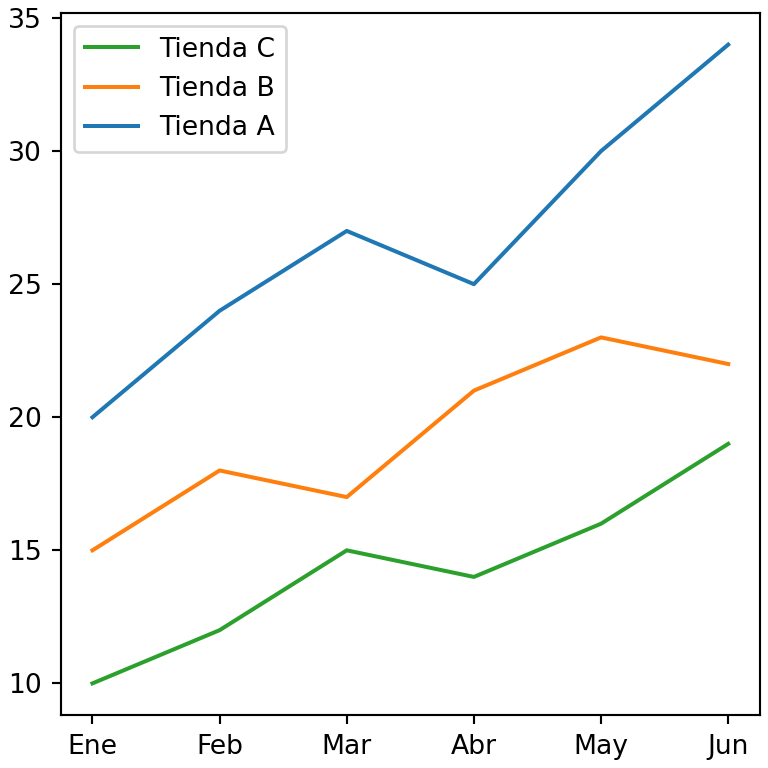
Leyendas personalizadas
A veces la leyenda necesita elementos que no están en el gráfico, por ejemplo cuando el color de los puntos depende de una variable. En este caso puedes crear los elementos de la leyenda manualmente con Line2D (líneas y marcadores) o Patch (áreas rellenas) y pasarlos al argumento handles.
import matplotlib.pyplot as plt
from matplotlib.lines import Line2D
from matplotlib.patches import Patch

fig, ax = plt.subplots()
ax.bar(["A", "B", "C"], [3, 5, 2], color = ["tab:blue", "tab:blue", "tab:red"])
ax.axhline(4, color = "black", linestyle = "--")

handles = [Patch(color = "tab:blue", label = "Normal"),
           Patch(color = "tab:red", label = "Alerta"),
           Line2D([0], [0], color = "black", linestyle = "--", label = "Objetivo")]

ax.legend(handles = handles)
# plt.show()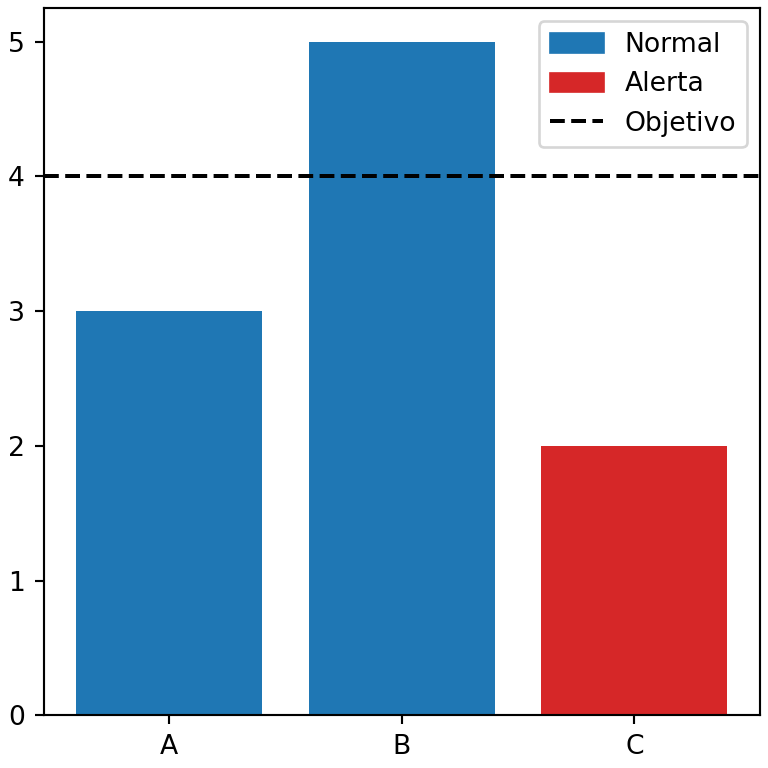
Una leyenda para varios subplots
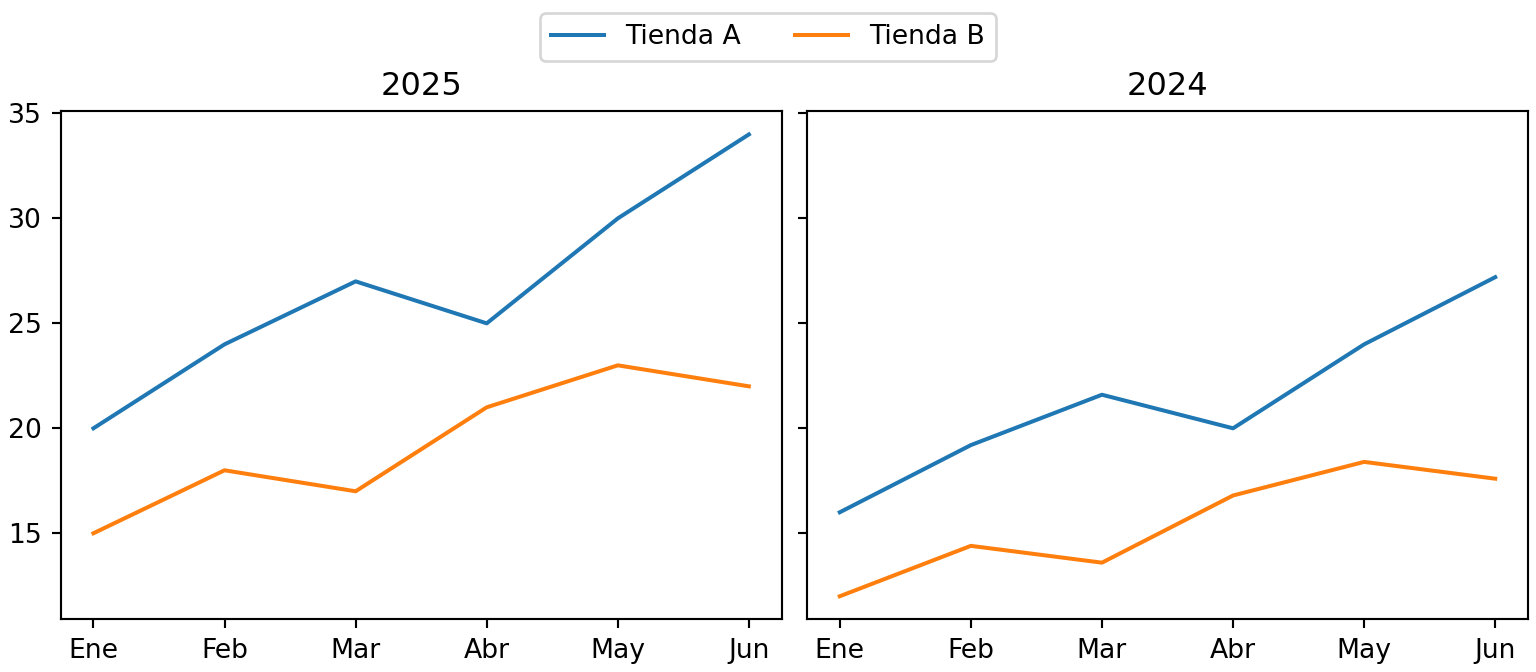
Cuando todos los subplots comparten los mismos grupos, utiliza fig.legend para agregar una única leyenda para toda la figura en lugar de una leyenda por subplot. Con layout = "constrained" puedes usar posiciones como "outside upper center" o "outside right upper" (matplotlib 3.7 o posterior) para colocar la leyenda fuera de los subplots sin solaparse con ellos.
import matplotlib.pyplot as plt

months = ["Ene", "Feb", "Mar", "Abr", "May", "Jun"]
shop_a = [20, 24, 27, 25, 30, 34]
shop_b = [15, 18, 17, 21, 23, 22]
shop_c = [10, 12, 15, 14, 16, 19]

fig, (ax1, ax2) = plt.subplots(1, 2, figsize = (8, 3.5), layout = "constrained", sharey = True)
ax1.plot(months, shop_a, label = "Tienda A")
ax1.plot(months, shop_b, label = "Tienda B")
ax1.set_title("2025")
ax2.plot(months, [v * 0.8 for v in shop_a])
ax2.plot(months, [v * 0.8 for v in shop_b])
ax2.set_title("2024")

fig.legend(loc = "outside upper center", ncol = 2)
# plt.show()
Eliminar la leyenda
Algunas funciones, como el método plot de pandas o varias funciones de seaborn, agregan una leyenda automáticamente. Para eliminarla llama a ax.get_legend().remove() o pasa legend = False a la función que crea el gráfico. Para ocultar un solo elemento de la leyenda asígnale una etiqueta que empiece por guion bajo, como label = "_nolegend_".
ax.get_legend().remove()Aprende también a agregar títulos y textos y anotaciones a tus gráficos o a elegir los colores de cada grupo.