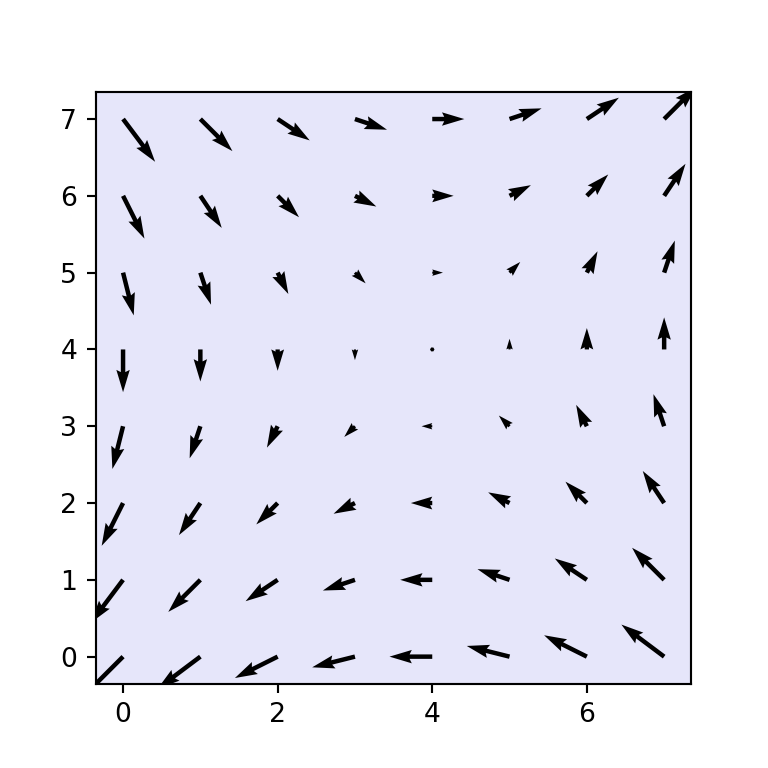
A colorbar is the legend of a color scale: it shows which value corresponds to each color in charts like heat maps, contour plots or scatter plots colored by a numeric variable.
Adding a colorbar
Pass the object returned by the plotting function (imshow, scatter, contourf, pcolormesh…) to fig.colorbar or plt.colorbar. The colors of the bar are taken from the colormap of that object.
import numpy as np
import matplotlib.pyplot as plt

data = np.random.default_rng(1).random((10, 10))

fig, ax = plt.subplots()
im = ax.imshow(data, cmap = "viridis")

fig.colorbar(im, ax = ax)
# plt.show()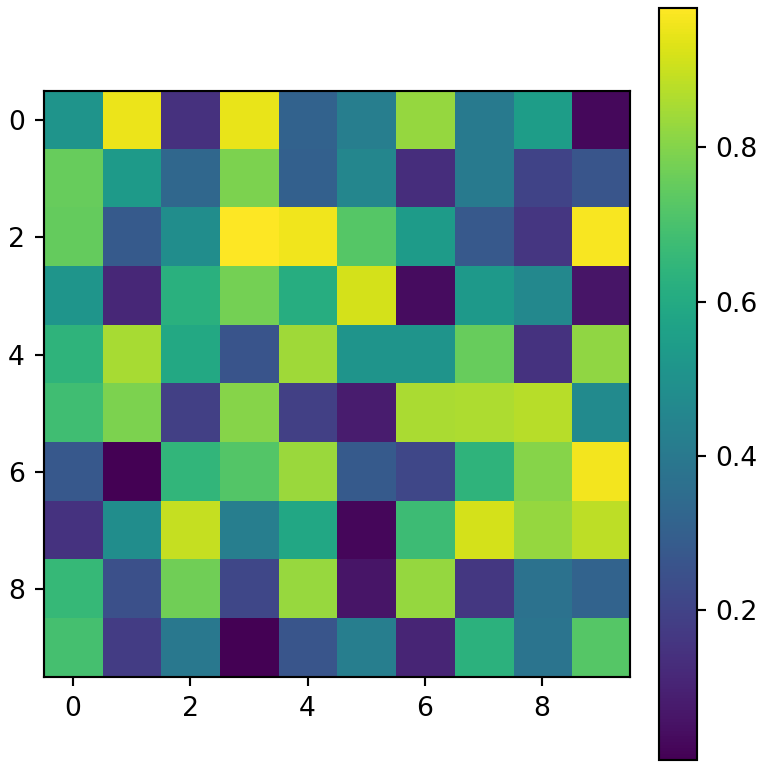
Colorbar for a scatter plot
In a scatter plot, color the points by a numeric variable with the c argument and a colormap.
import numpy as np
import matplotlib.pyplot as plt

rng = np.random.default_rng(2)
x, y = rng.normal(size = (2, 100))

fig, ax = plt.subplots()
sc = ax.scatter(x, y, c = x + y, cmap = "plasma")

fig.colorbar(sc, ax = ax)
# plt.show()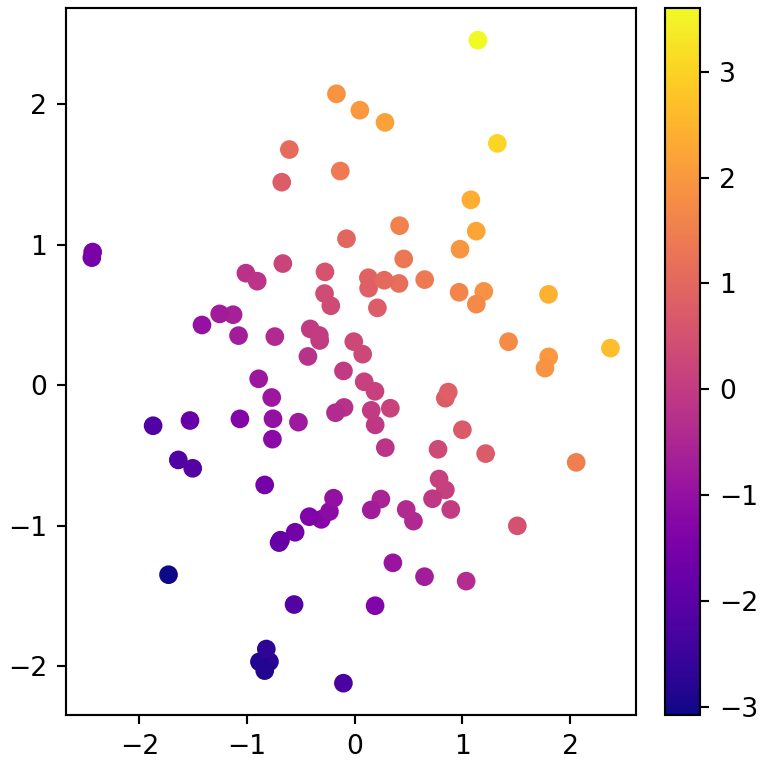
Colorbar label
Add a title to the colorbar with the label argument or with set_label, which also accepts text properties such as size or rotation.
import numpy as np
import matplotlib.pyplot as plt

data = np.random.default_rng(1).random((10, 10))

fig, ax = plt.subplots()
im = ax.imshow(data)

cbar = fig.colorbar(im, ax = ax)
cbar.set_label("Temperature (ºC)", size = 12)
# plt.show()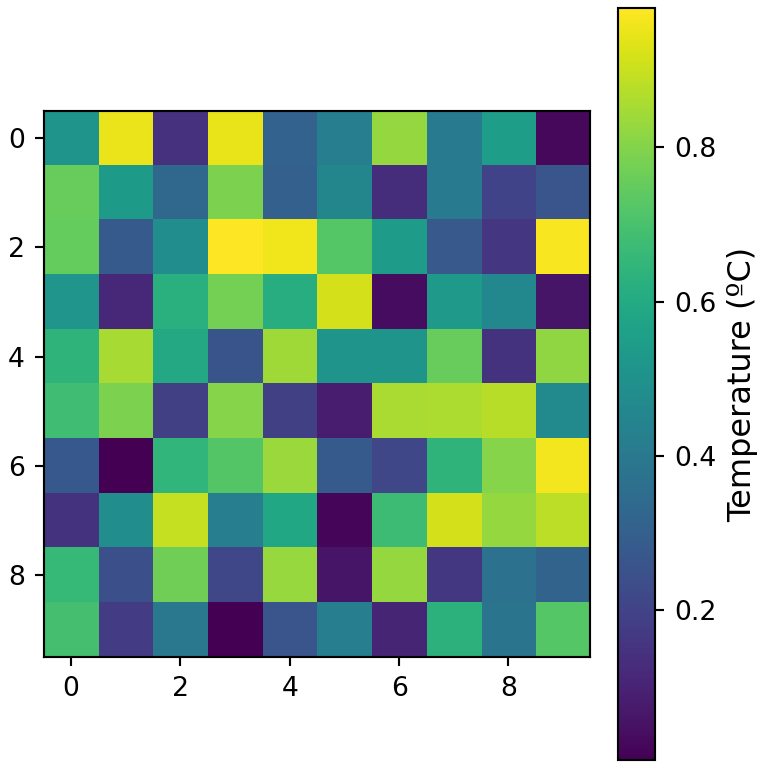
Orientation, size and position
Use location ("right", "left", "top" or "bottom") to place the colorbar, shrink to make it shorter, aspect to change the ratio between its length and its width and pad to set the distance to the plot.
import numpy as np
import matplotlib.pyplot as plt

data = np.random.default_rng(1).random((10, 10))

fig, ax = plt.subplots()
im = ax.imshow(data)

fig.colorbar(im, ax = ax, location = "bottom",
             shrink = 0.8, aspect = 30, pad = 0.08)
# plt.show()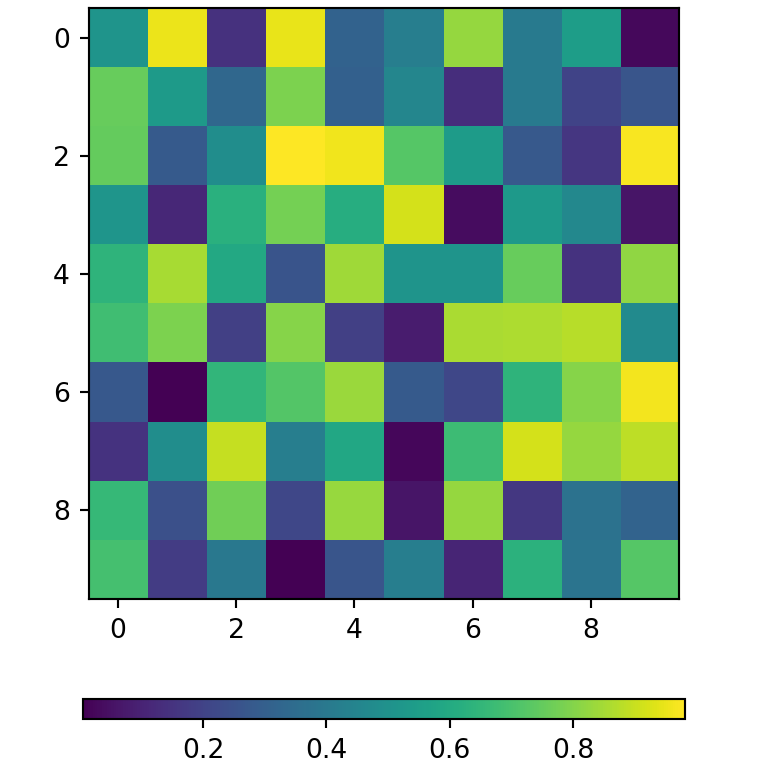
Colorbar ticks
Set the position of the ticks with the ticks argument and replace them with custom labels with set_ticklabels. The extend argument adds triangles at the ends to indicate that there are values outside the range.
import numpy as np
import matplotlib.pyplot as plt

data = np.random.default_rng(1).random((10, 10))

fig, ax = plt.subplots()
im = ax.imshow(data, vmin = 0, vmax = 1)

cbar = fig.colorbar(im, ax = ax, ticks = [0, 0.5, 1], extend = "both")
cbar.set_ticklabels(["Low", "Medium", "High"])
# plt.show()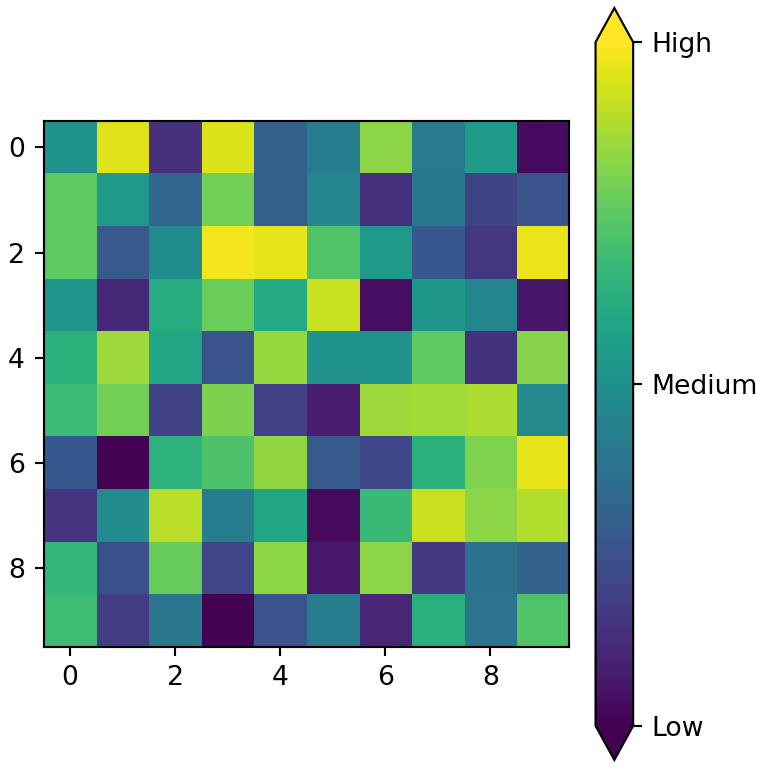
Discrete colorbar
To group the values into intervals with one color each, create a BoundaryNorm with the limits of the intervals and pass it to the norm argument.
import numpy as np
import matplotlib.pyplot as plt

data = np.random.default_rng(1).random((10, 10))
import matplotlib as mpl

bounds = [0, 0.25, 0.5, 0.75, 1]
norm = mpl.colors.BoundaryNorm(bounds, plt.get_cmap("viridis").N)

fig, ax = plt.subplots()
im = ax.imshow(data, cmap = "viridis", norm = norm)

fig.colorbar(im, ax = ax, ticks = bounds)
# plt.show()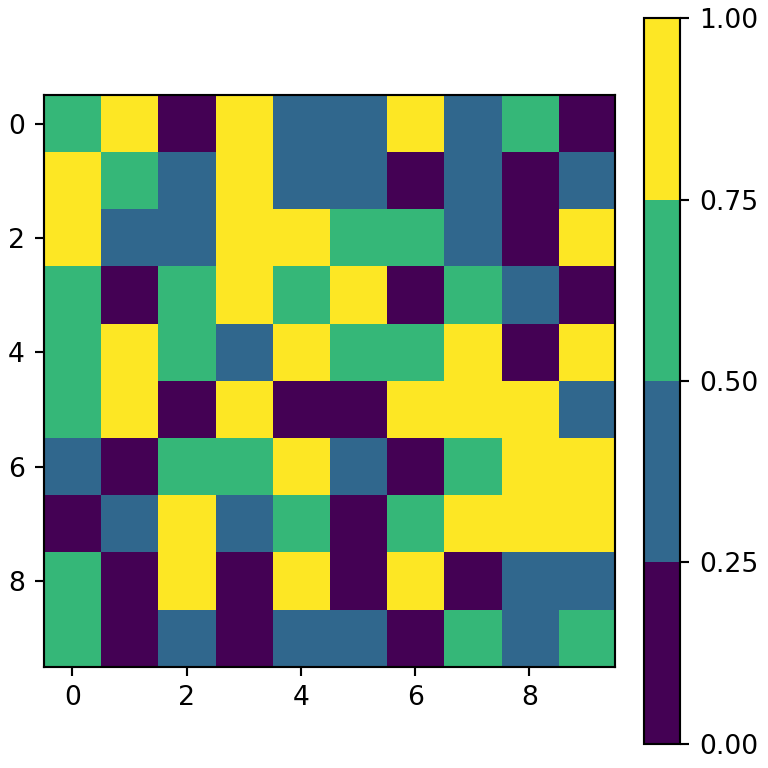
One colorbar for several subplots
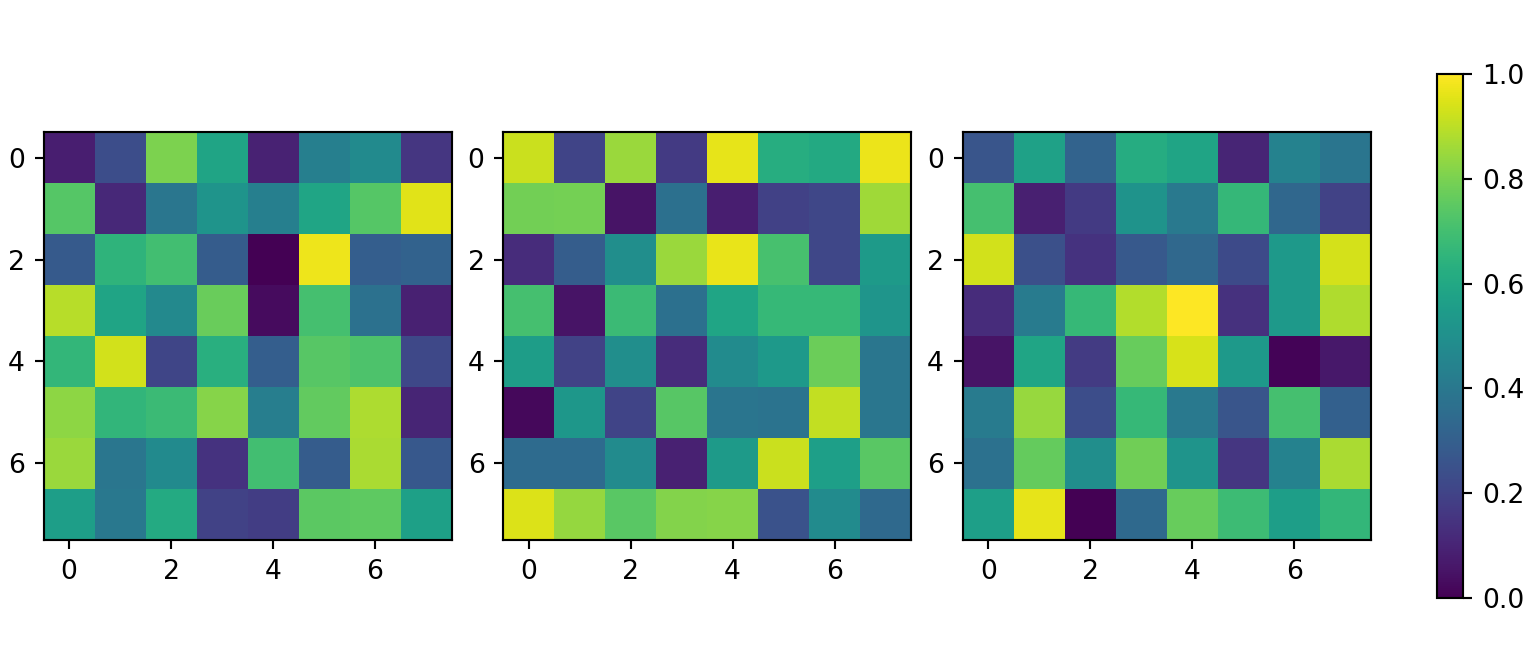
When several subplots share the same scale, set the same vmin and vmax in all of them and pass the list of axes to fig.colorbar. The colorbar will be placed next to all of them.
import numpy as np
import matplotlib.pyplot as plt

rng = np.random.default_rng(3)

fig, axs = plt.subplots(1, 3, figsize = (8, 3.5))

for ax in axs:
    im = ax.imshow(rng.random((8, 8)), vmin = 0, vmax = 1)

fig.colorbar(im, ax = axs, shrink = 0.8)
# plt.show()
Check the full list of matplotlib colormaps to choose the colors of the scale, or see how to create a heat map in matplotlib.