Matplotlib uses DejaVu Sans as the default font. You can change the font and its size for a single text element or for all the texts of your charts at once.
Font size
Every text function (title, xlabel, ylabel, text, legend…) accepts a fontsize (or size) argument, either a number in points or a relative size such as "small", "large" or "x-large".
import matplotlib.pyplot as plt

genres = ["Fantasy", "Crime", "Romance", "Sci-fi", "History"]
sales = [320, 280, 240, 190, 120]

fig, ax = plt.subplots()
ax.bar(genres, sales)

ax.set_title("Book sales", fontsize = 20)
ax.set_xlabel("Genre", fontsize = 14)
ax.tick_params(labelsize = 8)
# plt.show()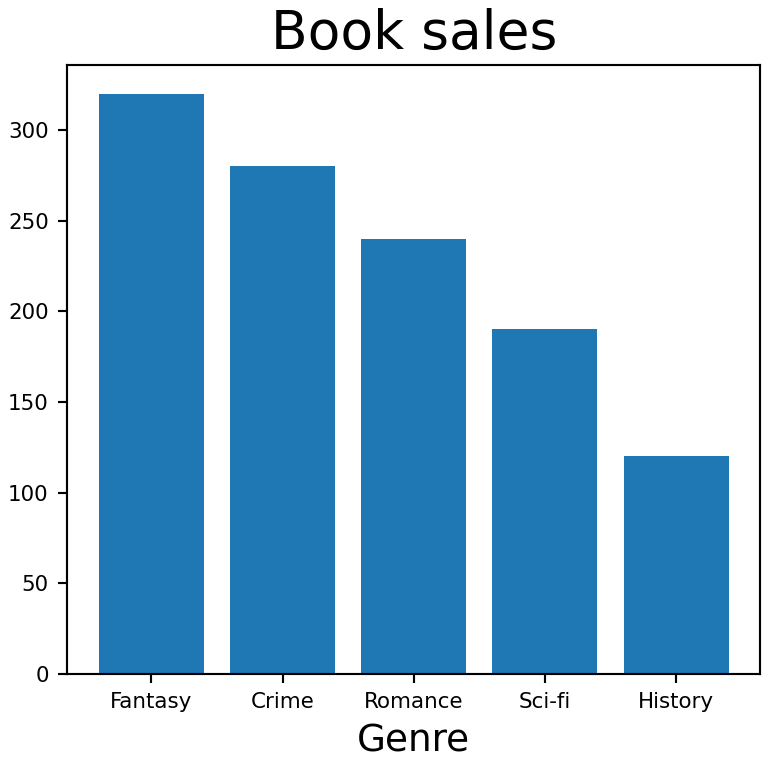
Change all the font sizes
To change the size of all the texts at once, modify font.size in rcParams. Specific elements can be adjusted with keys such as axes.titlesize, axes.labelsize, xtick.labelsize or legend.fontsize.
import matplotlib.pyplot as plt

plt.rcParams["font.size"] = 14
plt.rcParams["axes.titlesize"] = 18
plt.rcParams["xtick.labelsize"] = 10
Font family
The fontfamily (or family) argument accepts the name of a font installed on your computer or a generic family: "serif", "sans-serif", "monospace", "cursive" or "fantasy".
import matplotlib.pyplot as plt

genres = ["Fantasy", "Crime", "Romance", "Sci-fi", "History"]
sales = [320, 280, 240, 190, 120]

fig, ax = plt.subplots()
ax.barh(genres, sales, color = "#6D597A")

ax.set_title("Book sales", fontfamily = "serif", fontsize = 24)
ax.set_xlabel("Units sold", fontfamily = "monospace", fontsize = 13)
# plt.show()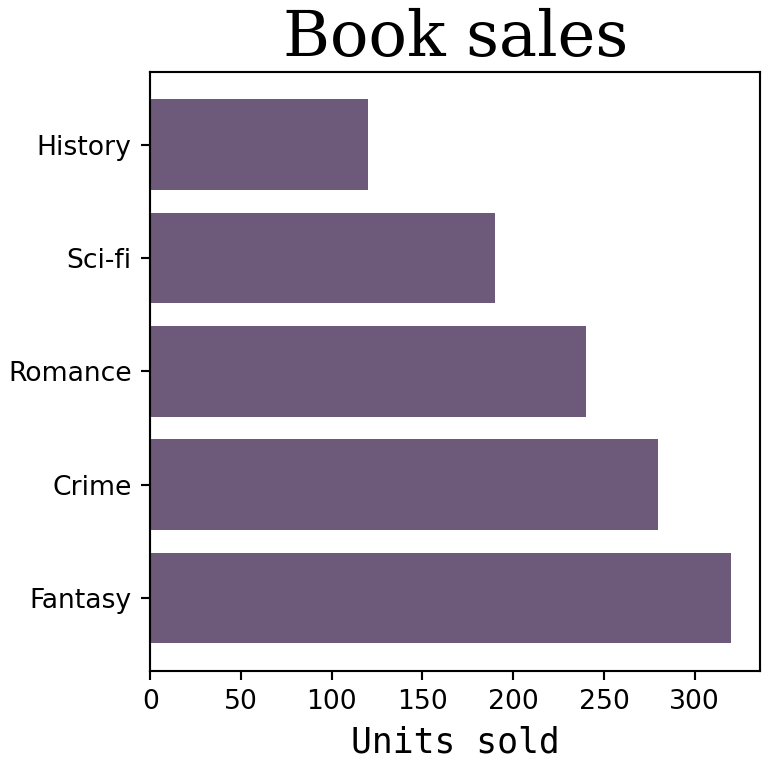
Change the default font
Set font.family in rcParams to use the same font in all the charts. You can pass a list of fonts in order of preference.
import matplotlib.pyplot as plt

plt.rcParams["font.family"] = "serif"
plt.rcParams["font.serif"] = ["Times New Roman", "DejaVu Serif"]
Bold and italic
Use fontweight ("normal", "bold", "light" or a number between 0 and 1000) and fontstyle ("normal", "italic" or "oblique").
import matplotlib.pyplot as plt

genres = ["Fantasy", "Crime", "Romance", "Sci-fi", "History"]
sales = [320, 280, 240, 190, 120]

fig, ax = plt.subplots()
ax.bar(genres, sales)

ax.set_title("Bold title", fontweight = "bold")
ax.set_xlabel("Italic label", fontstyle = "italic")
# plt.show()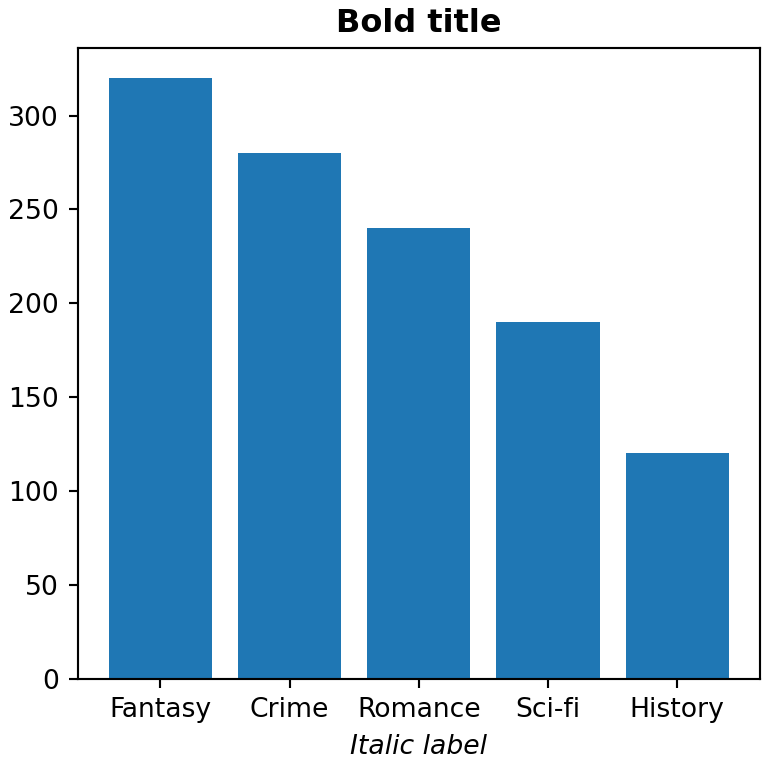
Several properties at once
Store the font properties in a dictionary and pass it with fontdict to reuse them in several elements.
import matplotlib.pyplot as plt

font = {"family": "serif", "color": "darkred", "weight": "bold", "size": 16}

fig, ax = plt.subplots()
ax.set_title("Title", fontdict = font)
ax.set_xlabel("X-axis", fontdict = font)
# plt.show()
List the available fonts
The font_manager module lists the fonts that matplotlib can find on your system. Use any of these names in fontfamily.
from matplotlib import font_manager

fonts = sorted({f.name for f in font_manager.fontManager.ttflist})
print(fonts)
Using a custom font
To use a font that is not installed, such as a font downloaded from Google Fonts, add its .ttf or .otf file with addfont and then use its name as any other font.
import matplotlib.pyplot as plt
from matplotlib import font_manager

font_manager.fontManager.addfont("Roboto-Regular.ttf")
plt.rcParams["font.family"] = "Roboto"

fig, ax = plt.subplots()
ax.set_title("Title with a custom font")
# plt.show()
If matplotlib still uses the default font, check that the name you use matches the name returned by font_manager.FontProperties(fname = "Roboto-Regular.ttf").get_name(). See also how to customize titles and texts.