Sample data
Consider the following data for illustration purposes:
# Data
x = [1, 2, 3, 4, 5, 6, 7]
y = [10, 10, 14, 14, 12, 16, 16]
Step plot in matplotlib with step
A step plot connects points with horizontal and vertical segments instead of a diagonal line, which is more accurate for values that stay constant and then jump at a discrete point, such as a price change or an inventory count. Use ax.step with the same syntax as a regular plot.
import matplotlib.pyplot as plt

fig, ax = plt.subplots()
ax.step(x, y)

# plt.show()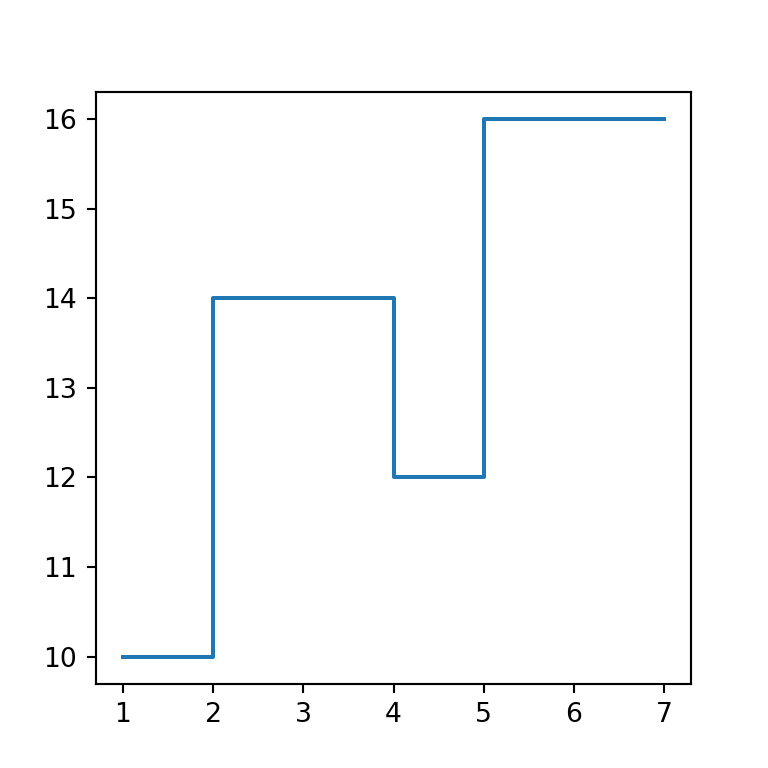
Step position
The where argument controls where the vertical jump happens relative to each point: "pre" (default) steps before the point, "post" steps after it, and "mid" places the jump halfway between two points.
import matplotlib.pyplot as plt

fig, ax = plt.subplots()
ax.step(x, y, where = "post")

# plt.show()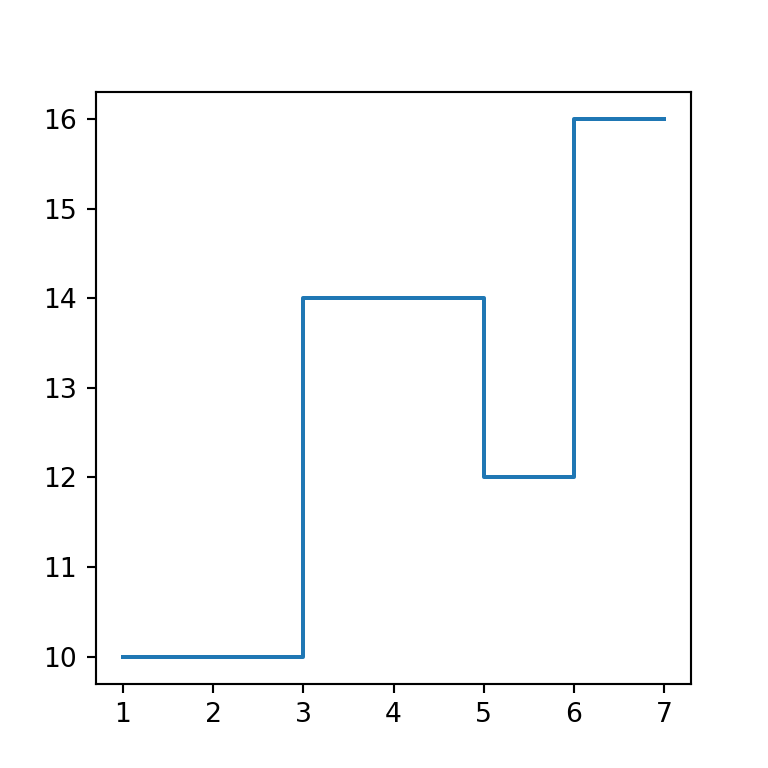
Colors
Customize the line the same way as in a regular line plot, with color, linewidth and linestyle.
import matplotlib.pyplot as plt

fig, ax = plt.subplots()
ax.step(x, y, color = "#C44E52", linewidth = 2)

# plt.show()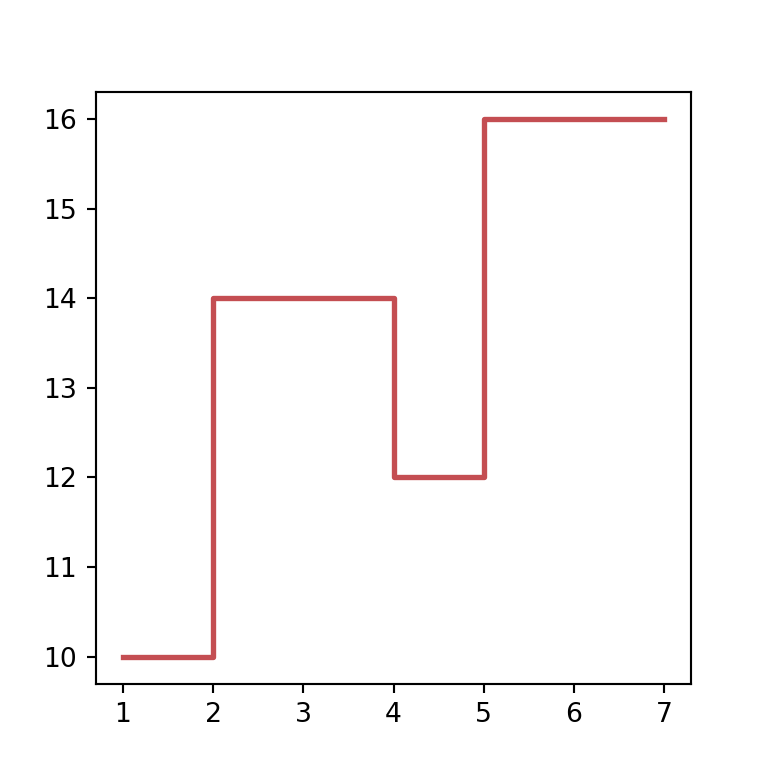
Markers
Add marker to also mark the actual data points on top of the steps.
import matplotlib.pyplot as plt

fig, ax = plt.subplots()
ax.step(x, y, marker = "o")

# plt.show()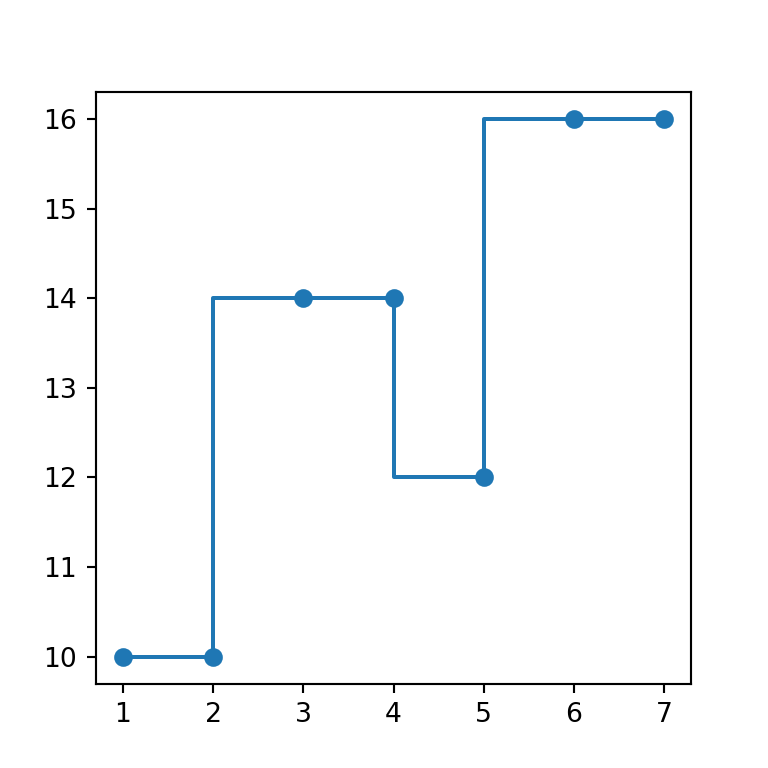
Filled step plot
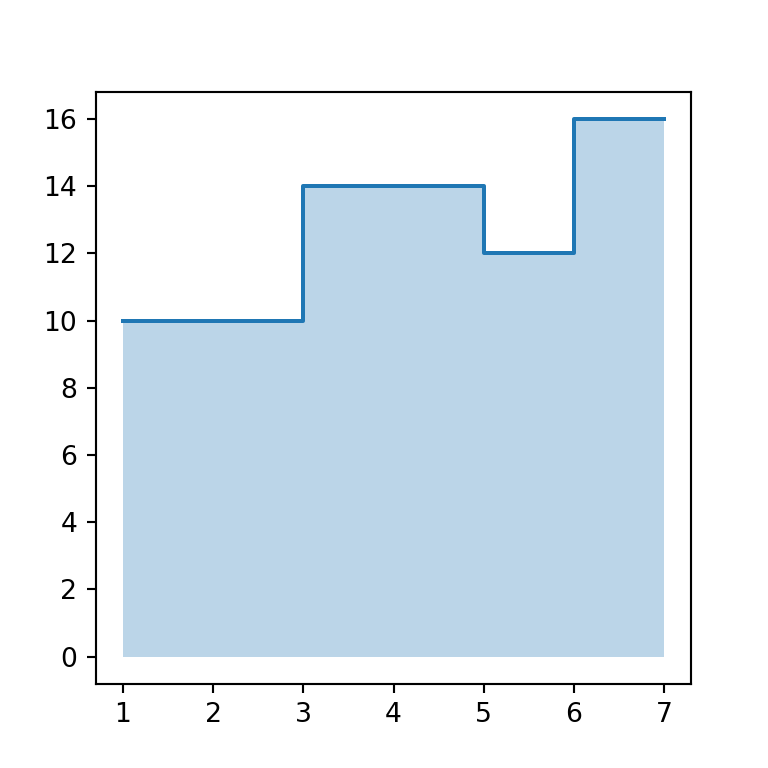
To shade the area under a step plot, use fill_between with a matching step argument instead of ax.fill, which only interpolates diagonally between points.
import matplotlib.pyplot as plt

fig, ax = plt.subplots()
ax.step(x, y, where = "post")
ax.fill_between(x, y, step = "post", alpha = 0.3)

# plt.show()