A streamgraph is a stacked area chart whose areas are placed around a central axis instead of over zero, which gives it an organic, flowing look. It is useful to show how the composition of a total changes over time. The examples show the evolution of the listening share of several music genres.
Streamgraph with stackplot
stackplot stacks the series. Set baseline = "wiggle" to center them and minimize the slope of the layers, which creates the streamgraph.
import numpy as np
import matplotlib.pyplot as plt

years = np.arange(2000, 2026)
t = (years - 2000) / 25
genres = ["Pop", "Rock", "Hip hop", "Electronic", "Latin"]
listens = np.vstack([30 + 5 * np.sin(6 * t),
                     35 - 25 * t,
                     5 + 30 * t,
                     8 + 12 * np.sin(3 * t) ** 2,
                     3 + 25 * t ** 2])

fig, ax = plt.subplots()
ax.stackplot(years, listens, labels = genres, baseline = "wiggle")
ax.legend(loc = "upper left", fontsize = 8)
# plt.show()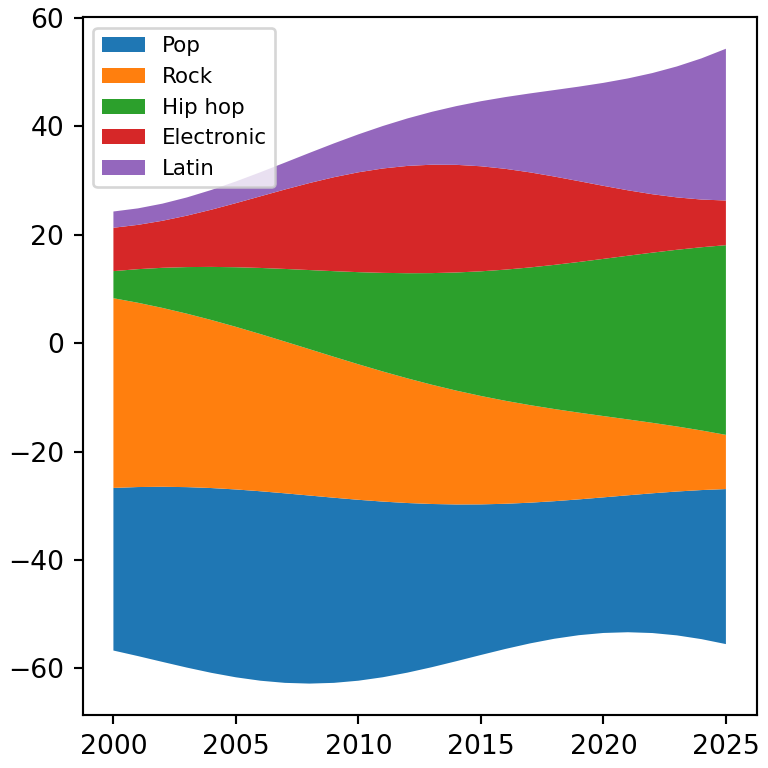
Baselines
Other options of baseline are "zero" (a normal stacked area chart), "sym" (symmetric around zero) and "weighted_wiggle".
import numpy as np
import matplotlib.pyplot as plt

years = np.arange(2000, 2026)
t = (years - 2000) / 25
genres = ["Pop", "Rock", "Hip hop", "Electronic", "Latin"]
listens = np.vstack([30 + 5 * np.sin(6 * t),
                     35 - 25 * t,
                     5 + 30 * t,
                     8 + 12 * np.sin(3 * t) ** 2,
                     3 + 25 * t ** 2])

fig, ax = plt.subplots()
ax.stackplot(years, listens, baseline = "sym")
# plt.show()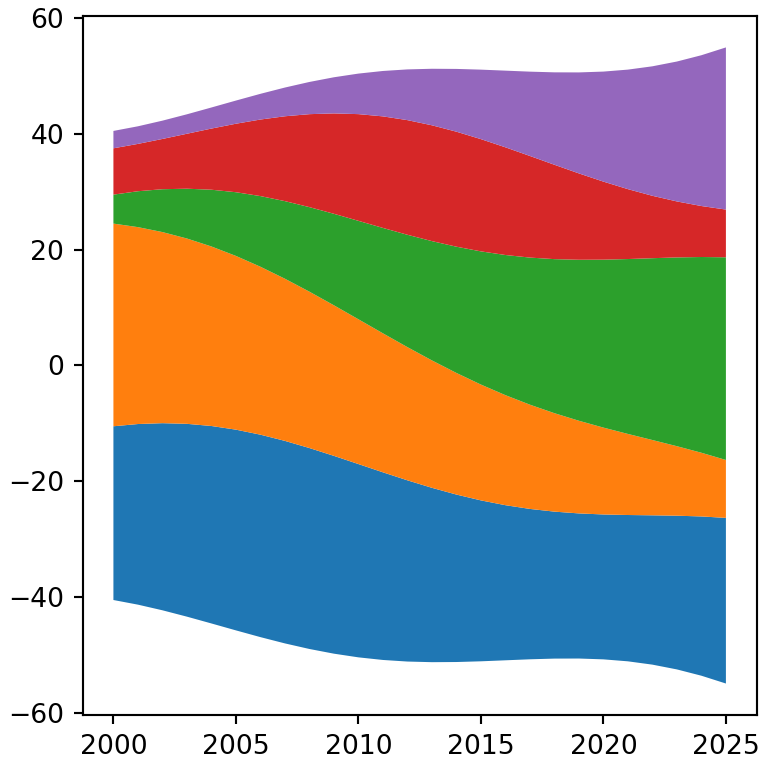
Smooth streams
With few points the streams look angular. Interpolate the data with a spline from scipy to get smooth curves.
import numpy as np
import matplotlib.pyplot as plt

years = np.arange(2000, 2026)
t = (years - 2000) / 25
genres = ["Pop", "Rock", "Hip hop", "Electronic", "Latin"]
listens = np.vstack([30 + 5 * np.sin(6 * t),
                     35 - 25 * t,
                     5 + 30 * t,
                     8 + 12 * np.sin(3 * t) ** 2,
                     3 + 25 * t ** 2])
from scipy.interpolate import make_interp_spline

x_smooth = np.linspace(years.min(), years.max(), 300)
y_smooth = make_interp_spline(years, listens, k = 3, axis = 1)(x_smooth)

fig, ax = plt.subplots()
ax.stackplot(x_smooth, y_smooth, baseline = "wiggle",
             colors = ["#264653", "#2A9D8F", "#E9C46A", "#F4A261", "#E76F51"])
ax.axis("off")
# plt.show()
Labels on the streams
Instead of a legend you can write the name of each group on its stream. The stackplot function returns one polygon per stream, so you can compute where each layer is at a given X value and place the text there.
import numpy as np
import matplotlib.pyplot as plt

years = np.arange(2000, 2026)
t = (years - 2000) / 25
genres = ["Pop", "Rock", "Hip hop", "Electronic", "Latin"]
listens = np.vstack([30 + 5 * np.sin(6 * t),
                     35 - 25 * t,
                     5 + 30 * t,
                     8 + 12 * np.sin(3 * t) ** 2,
                     3 + 25 * t ** 2])

fig, ax = plt.subplots()
ax.stackplot(years, listens, baseline = "wiggle", colors = plt.cm.Set2.colors)

i = 18
bottom = -listens[:, i].sum() / 2
for name, value in zip(genres, listens[:, i]):
    ax.text(years[i], bottom + value / 2, name, ha = "center", va = "center")
    bottom += value
ax.set_yticks([])
# plt.show()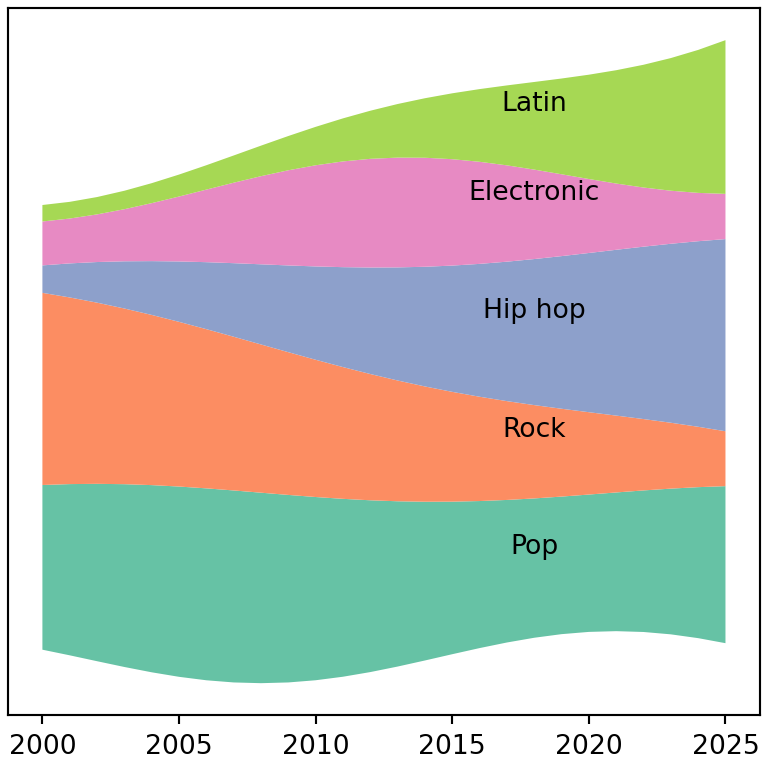
See also how to create a stacked area chart in matplotlib.