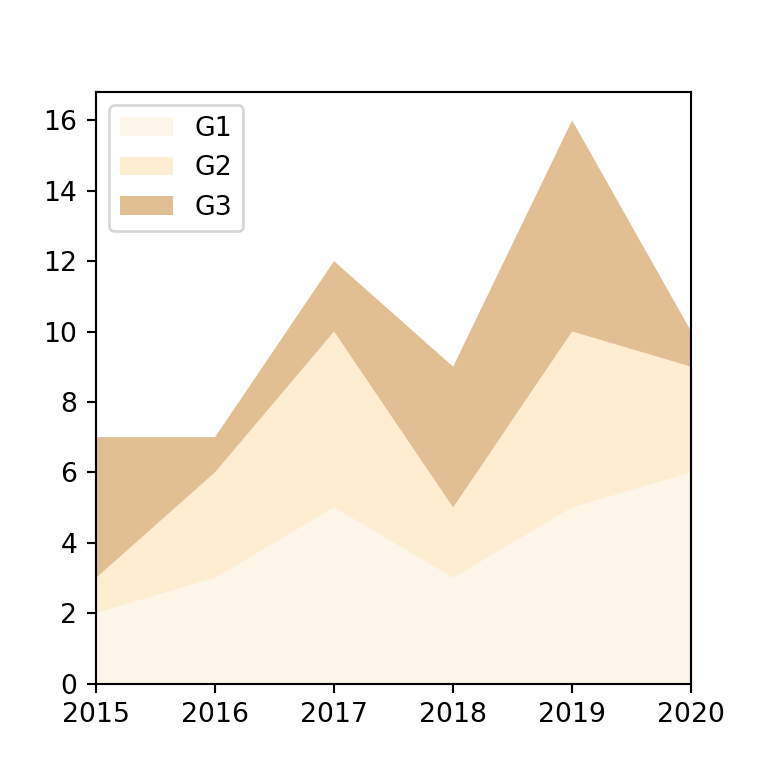
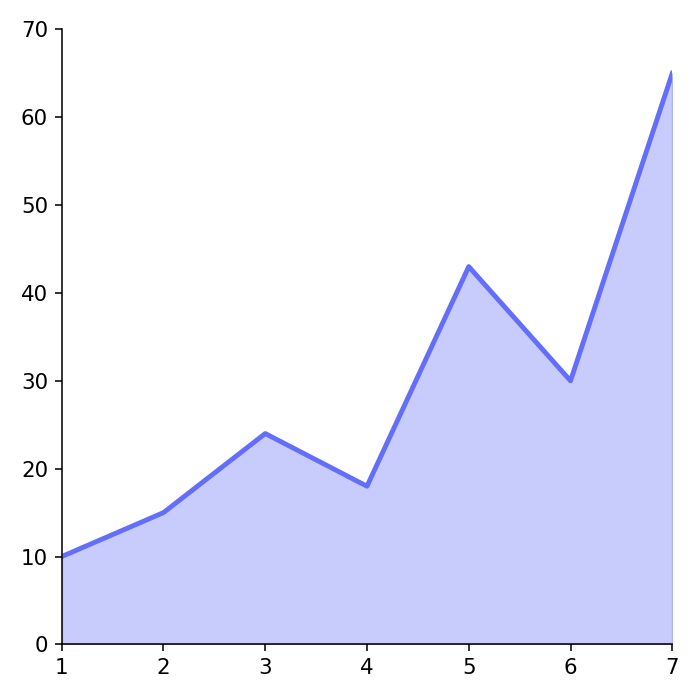
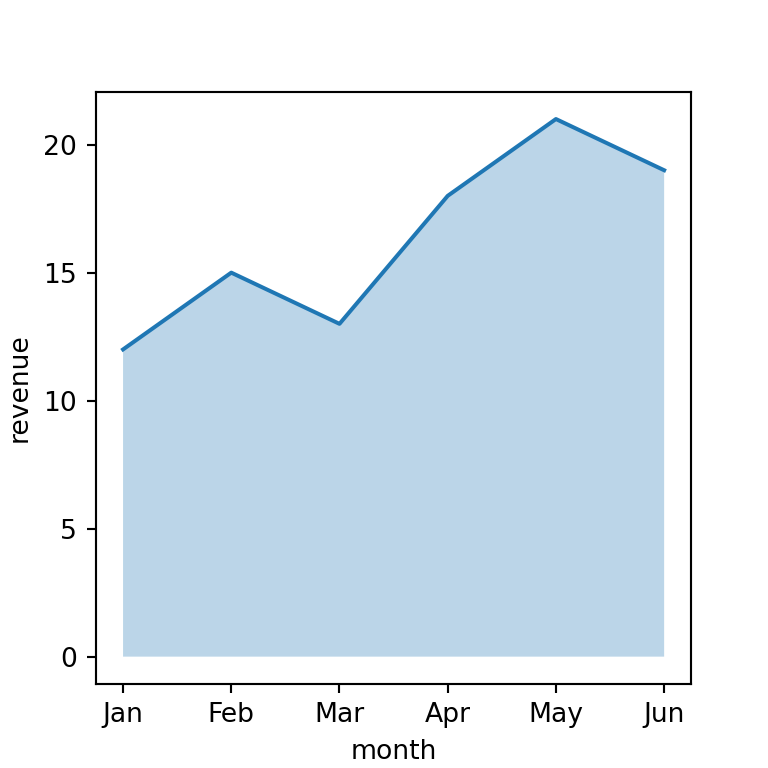
Area charts are line charts with the area below the line filled. In pandas they are created with plot.area and, unlike line charts, the columns are stacked by default.
Stacked area chart
plot.area stacks the columns of the data frame on top of each other, so the top line represents the total.
import numpy as np
import pandas as pd
import matplotlib.pyplot as plt

rng = np.random.default_rng(3)
df = pd.DataFrame(rng.uniform(1, 5, (12, 3)).cumsum(axis = 0),
                  columns = ["A", "B", "C"],
                  index = pd.date_range("2025-01-01", periods = 12, freq = "MS"))

df.plot.area()
# plt.show()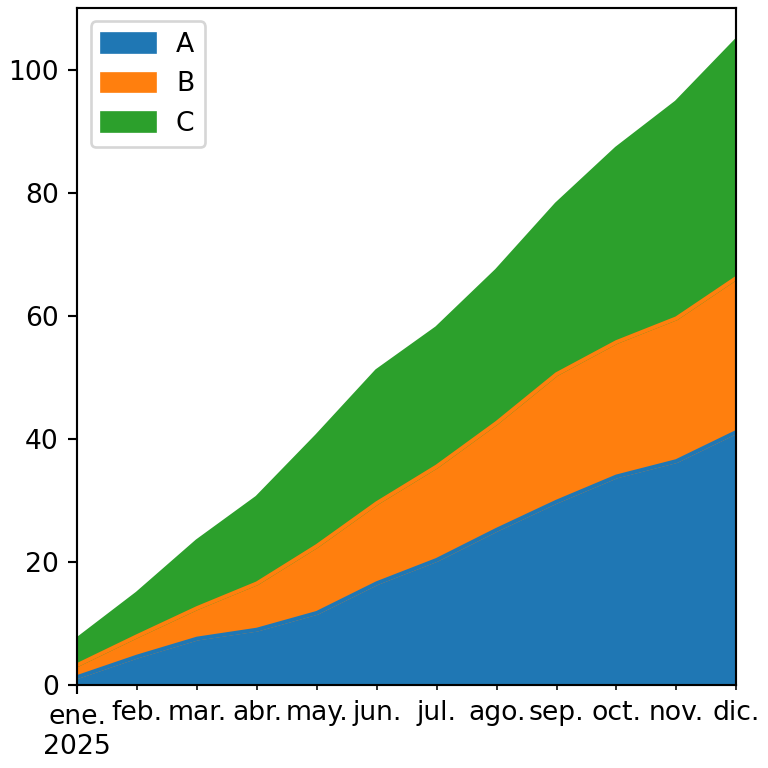
Unstacked area chart
Set stacked = False to draw each area from zero. Use alpha to set some transparency so all the areas are visible.
import numpy as np
import pandas as pd
import matplotlib.pyplot as plt

rng = np.random.default_rng(3)
df = pd.DataFrame(rng.uniform(1, 5, (12, 3)).cumsum(axis = 0),
                  columns = ["A", "B", "C"],
                  index = pd.date_range("2025-01-01", periods = 12, freq = "MS"))

df.plot.area(stacked = False, alpha = 0.4)
# plt.show()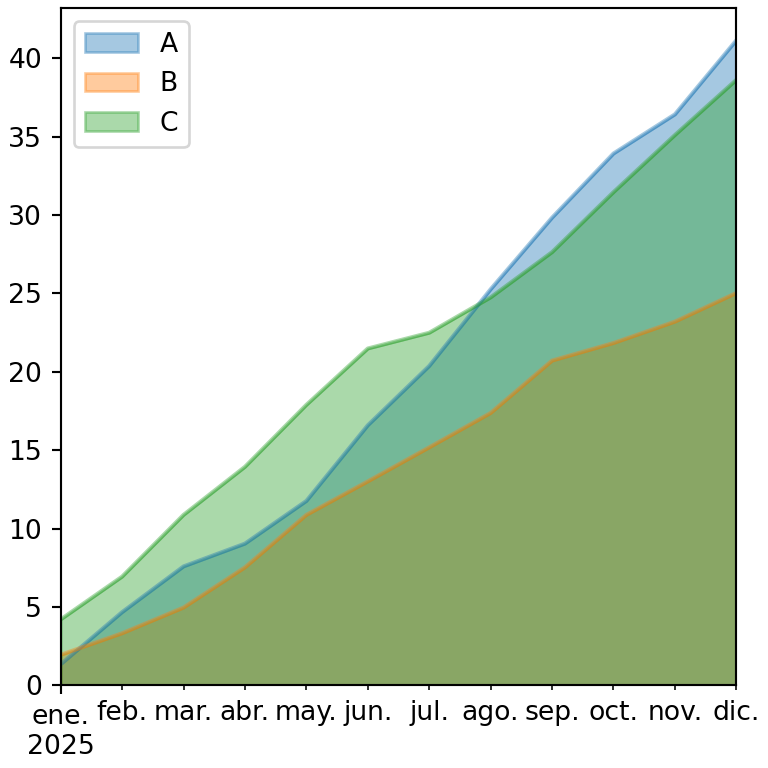
Percentage stacked area chart
Divide each row by its total to represent the share of each column over time.
import numpy as np
import pandas as pd
import matplotlib.pyplot as plt

rng = np.random.default_rng(3)
df = pd.DataFrame(rng.uniform(1, 5, (12, 3)).cumsum(axis = 0),
                  columns = ["A", "B", "C"],
                  index = pd.date_range("2025-01-01", periods = 12, freq = "MS"))

share = df.div(df.sum(axis = 1), axis = 0)

ax = share.plot.area(ylim = (0, 1))
ax.yaxis.set_major_formatter("{x:.0%}")
# plt.show()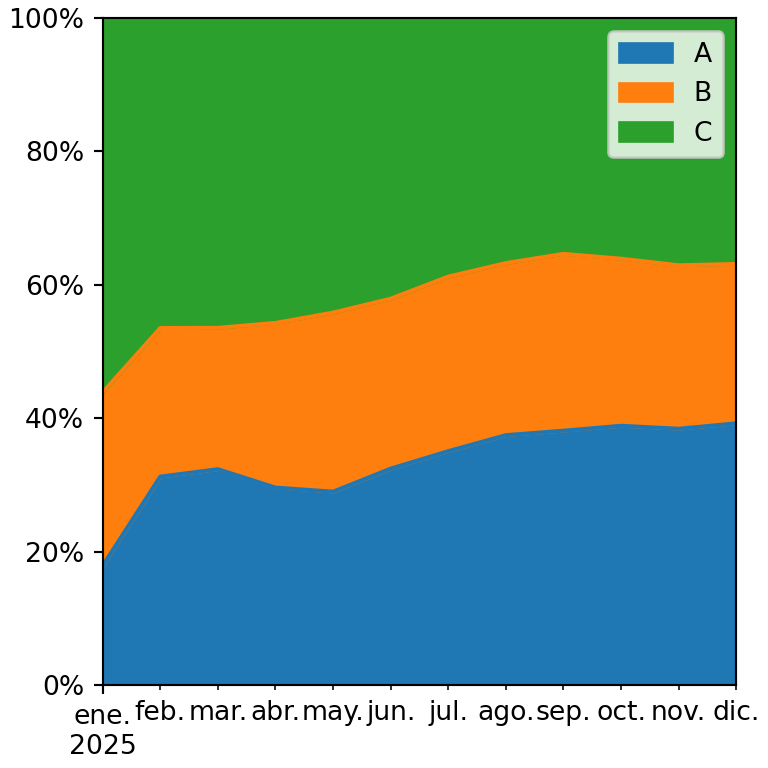
Colors of the areas
Choose the colors with a list or with a colormap.
import numpy as np
import pandas as pd
import matplotlib.pyplot as plt

rng = np.random.default_rng(3)
df = pd.DataFrame(rng.uniform(1, 5, (12, 3)).cumsum(axis = 0),
                  columns = ["A", "B", "C"],
                  index = pd.date_range("2025-01-01", periods = 12, freq = "MS"))

df.plot.area(colormap = "Set2", linewidth = 0)
# plt.show()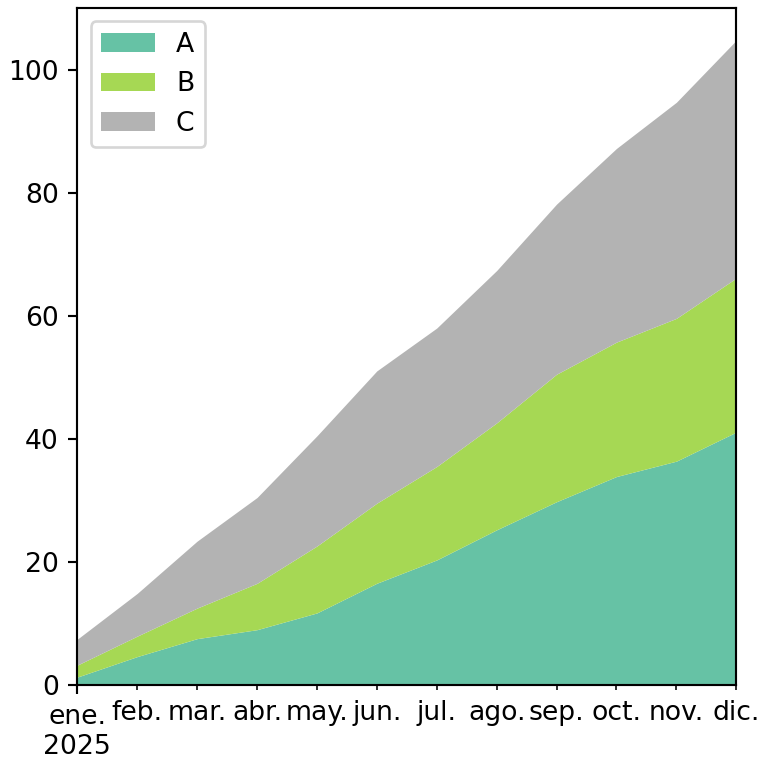
See also how to create an area chart in matplotlib or a stacked area chart in matplotlib.