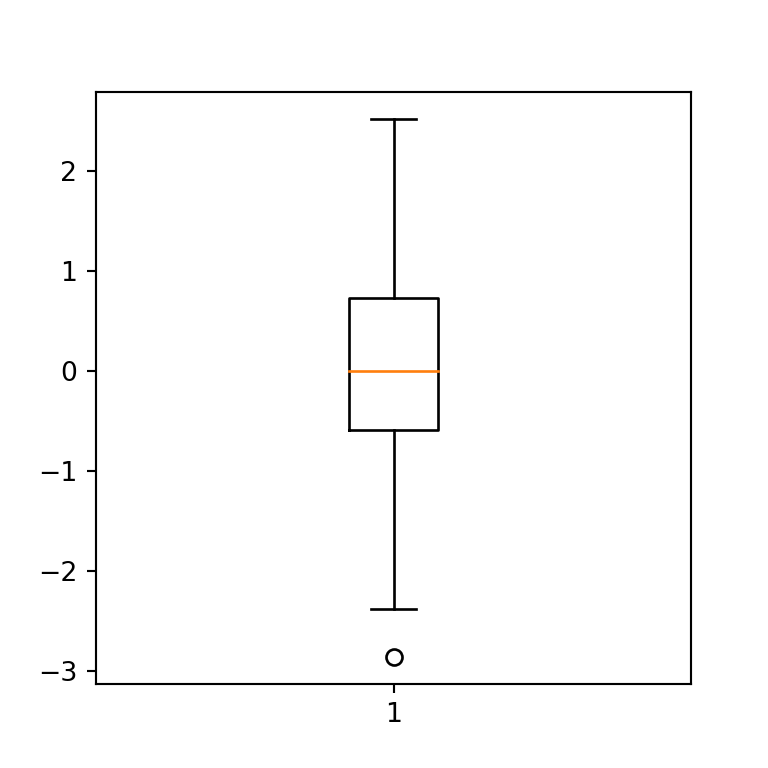
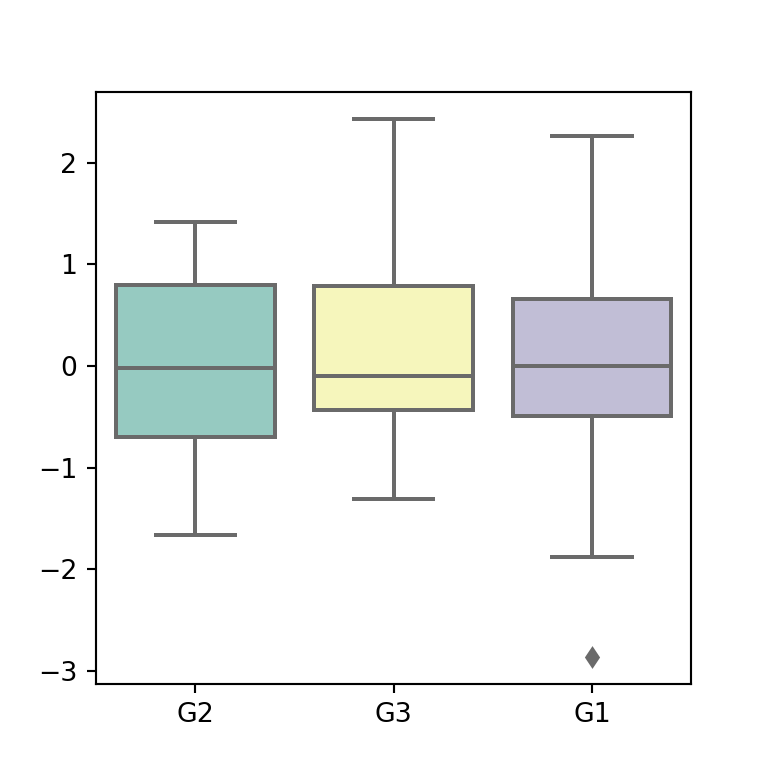
Box plots summarize the distribution of a variable with its quartiles and show the outliers. In pandas they are created with plot.box or with the boxplot method, which also allows creating one box for each group.
Box plot with plot.box
plot.box draws one box for each numeric column of the data frame.
import numpy as np
import pandas as pd
import matplotlib.pyplot as plt

rng = np.random.default_rng(6)
df = pd.DataFrame({"standard": rng.gamma(6, 7, 300),
                   "express": rng.gamma(4, 5, 300),
                   "city": rng.choice(["Madrid", "Barcelona", "Seville"], 300)})

df[["standard", "express"]].plot.box()
# plt.show()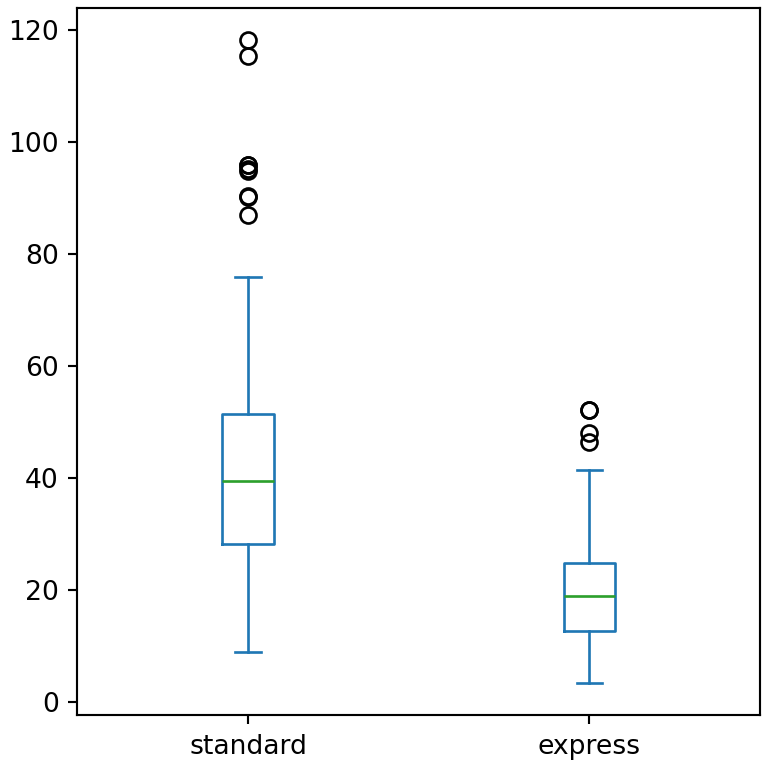
Horizontal box plot
import numpy as np
import pandas as pd
import matplotlib.pyplot as plt

rng = np.random.default_rng(6)
df = pd.DataFrame({"standard": rng.gamma(6, 7, 300),
                   "express": rng.gamma(4, 5, 300),
                   "city": rng.choice(["Madrid", "Barcelona", "Seville"], 300)})

df[["standard", "express"]].plot.box(vert = False)
# plt.show()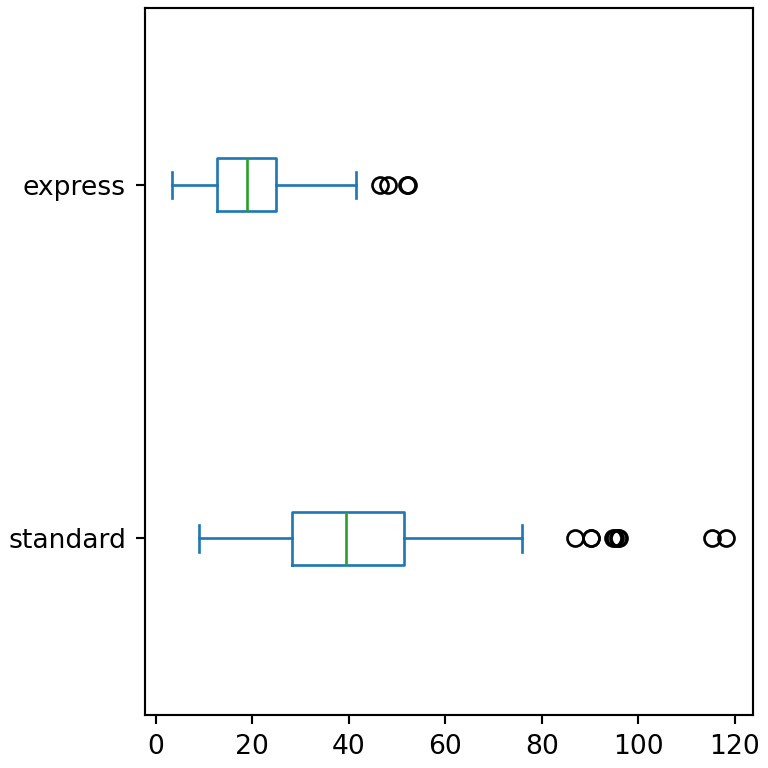
Box plot by group
The boxplot method with the by argument creates a box for each group of a categorical variable.
import numpy as np
import pandas as pd
import matplotlib.pyplot as plt

rng = np.random.default_rng(6)
df = pd.DataFrame({"standard": rng.gamma(6, 7, 300),
                   "express": rng.gamma(4, 5, 300),
                   "city": rng.choice(["Madrid", "Barcelona", "Seville"], 300)})

df.boxplot(column = "standard", by = "city", grid = False)
plt.suptitle("")
# plt.show()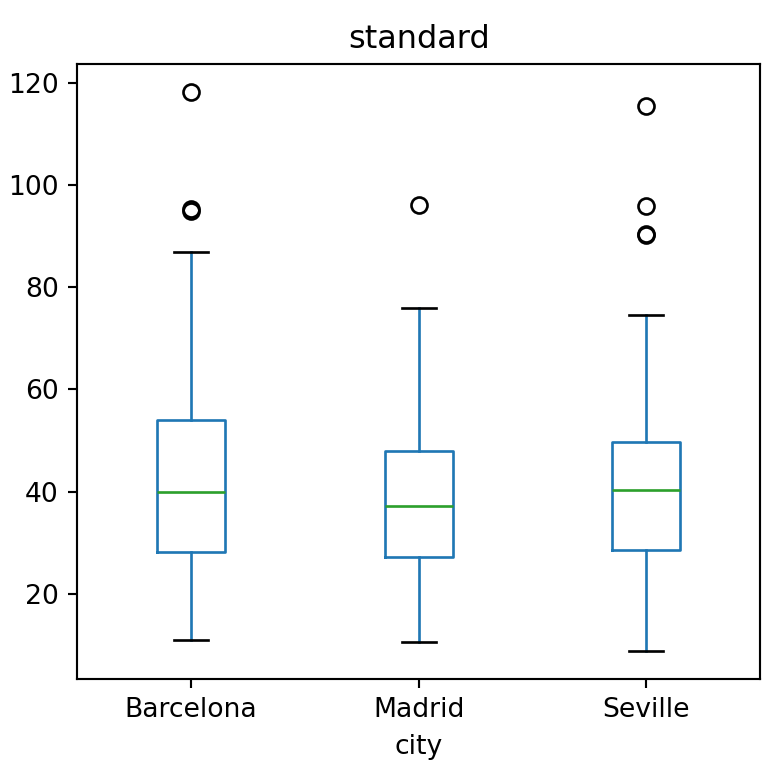
pandas adds an automatic title to the figure when using by. Remove it with plt.suptitle("") as in the previous example.
Colors of the box plot
Pass a dictionary to color to set the color of the boxes, whiskers, medians and caps. Use patch_artist = True to fill the boxes.
import numpy as np
import pandas as pd
import matplotlib.pyplot as plt

rng = np.random.default_rng(6)
df = pd.DataFrame({"standard": rng.gamma(6, 7, 300),
                   "express": rng.gamma(4, 5, 300),
                   "city": rng.choice(["Madrid", "Barcelona", "Seville"], 300)})

df[["standard", "express"]].plot.box(color = {"boxes": "#264653", "whiskers": "#264653",
                                               "medians": "#E76F51", "caps": "#264653"},
                                      patch_artist = True)
# plt.show()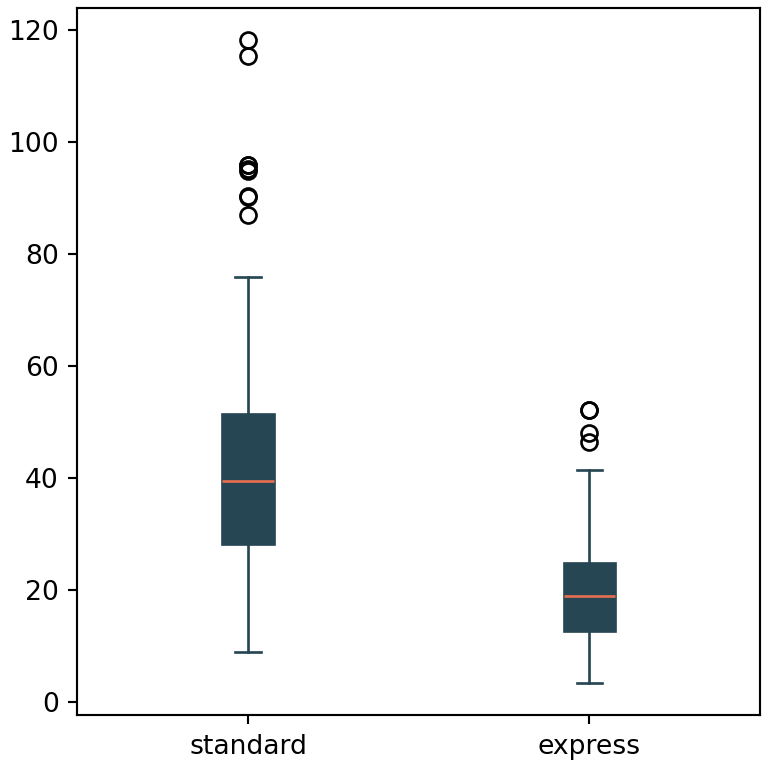
Show the mean
Any argument of the matplotlib boxplot function can be passed to pandas. For instance, showmeans = True adds the mean of each box.
import numpy as np
import pandas as pd
import matplotlib.pyplot as plt

rng = np.random.default_rng(6)
df = pd.DataFrame({"standard": rng.gamma(6, 7, 300),
                   "express": rng.gamma(4, 5, 300),
                   "city": rng.choice(["Madrid", "Barcelona", "Seville"], 300)})

df[["standard", "express"]].plot.box(showmeans = True)
# plt.show()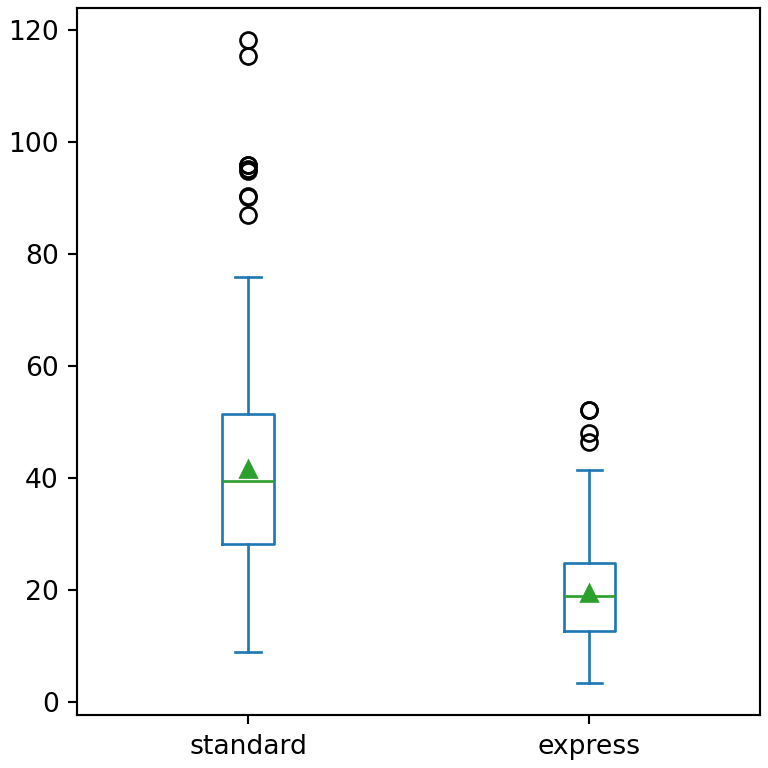
Learn how to create a box plot in matplotlib or in seaborn for more customization options.