The boxplot function in matplotlib
When using matplotlib you can use the boxplot function to create a box plot, as in the example below. Note that in order to make all the examples reproducible we have set a seed and generated a variable named x based on a normal distribution.
import numpy as np
import matplotlib.pyplot as plt

# Seed for reproducibility
np.random.seed(5)

# Data simulation
x = np.random.normal(0, 1, 200)

# Plot
fig, ax = plt.subplots()
ax.boxplot(x)
# plt.show()
Horizontal box plot
The boxplot function provides several arguments to customize the default box plot. In case you want to create an horizontal box plot rather than vertical you can just set the vert argument to False.
import numpy as np
import matplotlib.pyplot as plt

# Seed for reproducibility
np.random.seed(5)

# Data simulation
x = np.random.normal(0, 1, 200)

# Horizontal box plot
fig, ax = plt.subplots()
ax.boxplot(x, vert = False)
# plt.show()
Confidence interval for the median (notch)
If you want to show the 95% confidence interval for the median you can set notch = True, as the interval be represented with ‘notches’ on the box.
import numpy as np
import matplotlib.pyplot as plt

# Seed for reproducibility
np.random.seed(5)

# Data simulation
x = np.random.normal(0, 1, 200)

# Box plot with notch
fig, ax = plt.subplots()
ax.boxplot(x, notch = True)
# plt.show()
Outliers symbol
The default symbol for representing the outliers (or fliers) are circles. However, you can customize the marker and its color passing a dictionary to the flierprops argument, as shown below.
import numpy as np
import matplotlib.pyplot as plt

# Seed for reproducibility
np.random.seed(5)

# Data simulation
x = np.random.normal(0, 1, 200)

# Box plot
fig, ax = plt.subplots()
ax.boxplot(x, flierprops = dict(marker = "s", markerfacecolor = "red"))
# plt.show()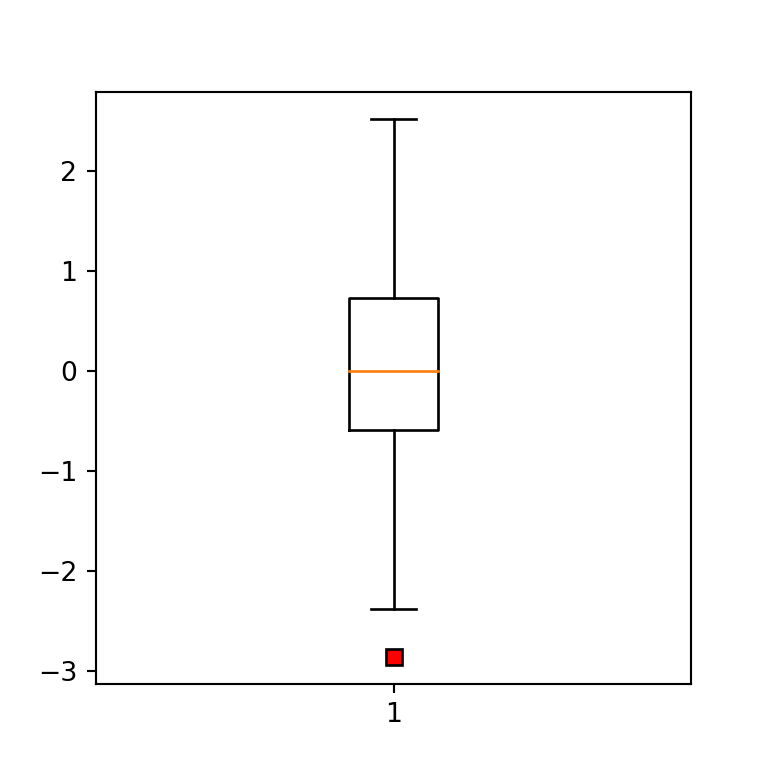
Box plot with mean
The central line of a box plot usually is the median of the data. Nonetheless, if you set the showmeans argument to True the mean will be also represented with a green triangle, and if you also set meanline = True the mean will be represented with a dashed line (the line will be green by default).
import numpy as np
import matplotlib.pyplot as plt

# Seed for reproducibility
np.random.seed(5)

# Data simulation
x = np.random.normal(0, 1, 200)

# Box plot
fig, ax = plt.subplots()
ax.boxplot(x, showmeans = True, meanline = True)
# plt.show()
Remove outliers
If you want to remove the outliers (also known as fliers) from the plot, you can set the showfliers argument to False.
import numpy as np
import matplotlib.pyplot as plt

# Seed for reproducibility
np.random.seed(5)

# Data simulation
x = np.random.normal(0, 1, 200)

# Box plot without outliers
fig, ax = plt.subplots()
ax.boxplot(x, showfliers = False)
# plt.show()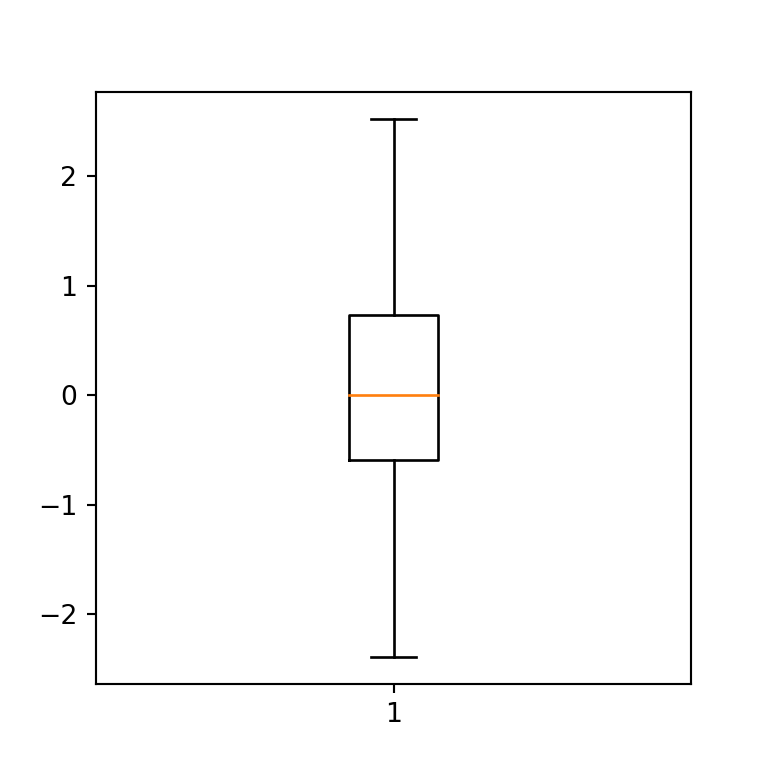
Color customization
Fill color
The fill color of a matplotlib box plot is white by default, but you can override it setting patch_artist = True and passing a dict with facecolor to the boxprops argument, as in the following example.
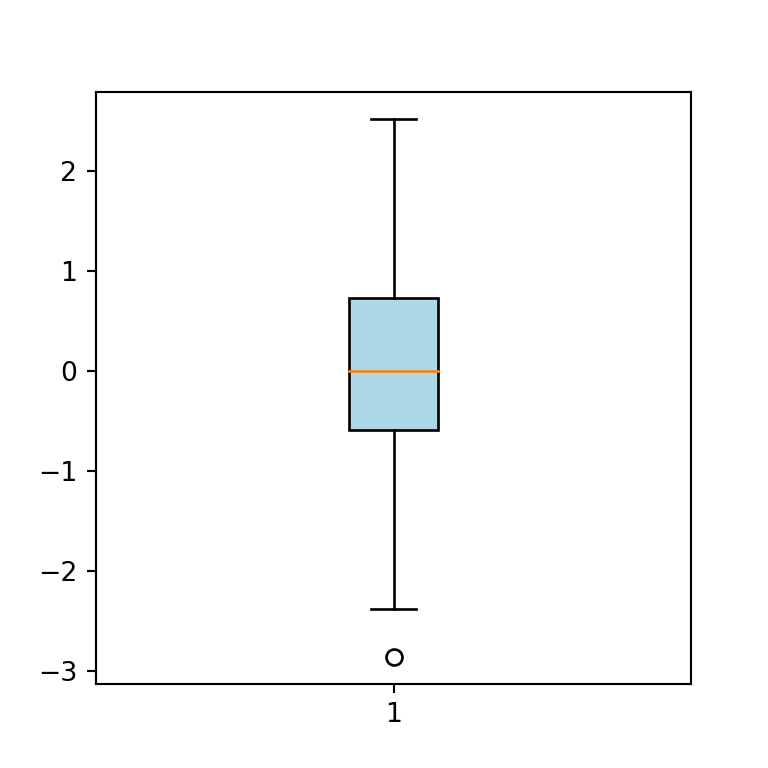
import numpy as np
import matplotlib.pyplot as plt

# Seed for reproducibility
np.random.seed(5)

# Data simulation
x = np.random.normal(0, 1, 200)

# Box plot fill color
fig, ax = plt.subplots()
ax.boxplot(x,
           patch_artist = True,
           boxprops = dict(facecolor = "lightblue"))
# plt.show()
If you don’t set patch_artist = True you will get an error saying: “AttributeError: ‘Line2D’ object has no property ‘facecolor’”
Median line color
The default color for the median line is orange. However, you can change it passing a dict to medianprops. Note that you can also modify the width of the line this way.
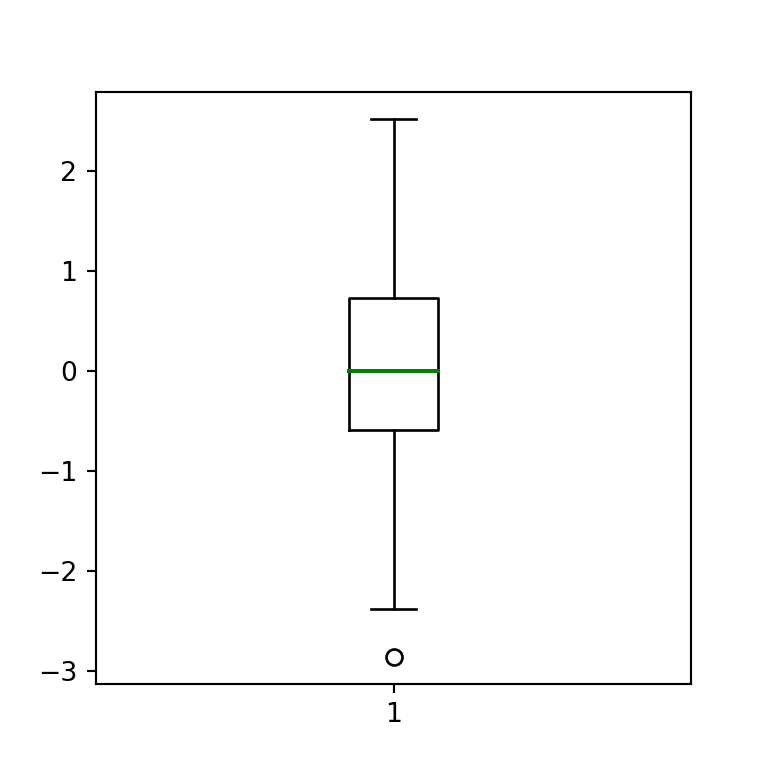
import numpy as np
import matplotlib.pyplot as plt

# Seed for reproducibility
np.random.seed(5)

# Data simulation
x = np.random.normal(0, 1, 200)

# Box plot
fig, ax = plt.subplots()
plt.boxplot(x, medianprops = dict(color = "green", linewidth = 1.5))
# plt.show()
whiskers color
You can also customize the color of the whiskers of the box plot. You just need to pass a dict with a color to whiskerprops.

import numpy as np
import matplotlib.pyplot as plt

# Seed for reproducibility
np.random.seed(5)

# Data simulation
x = np.random.normal(0, 1, 200)

# Box plot
fig, ax = plt.subplots()
plt.boxplot(x, whiskerprops = dict(color = "red", linewidth = 2))
# plt.show()
Whiskers caps color
Finally, you can also set the color not only for the whiskers, but for the whiskers caps with capprops.
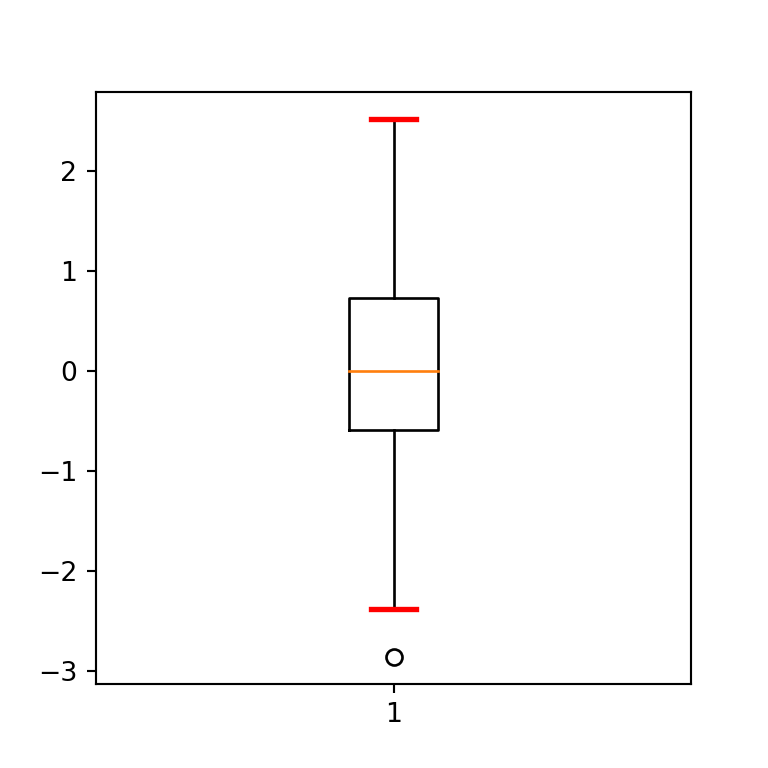
import numpy as np
import matplotlib.pyplot as plt

# Seed for reproducibility
np.random.seed(5)

# Data simulation
x = np.random.normal(0, 1, 200)

# Box plot
fig, ax = plt.subplots()
plt.boxplot(x, capprops = dict(color = "red", linewidth = 2))
# plt.show()


