Sample data
Copy the following code to get the data that will be used in the following examples.
import numpy as np
import seaborn as sns
import random

# Data simulation
rng = np.random.RandomState(5)
variable = rng.normal(0, 1, size = 100)
random.seed(5)
group = random.choices(["G1", "G2", "G3"], k = 100)
group2 = random.choices(["A", "B"], k = 100)
df = {'variable': variable, 'group': group, 'group2': group2}
Box plot in seaborn with boxplot
Passing a numerical variable to the x argument of the boxplot function you can create a box plot in seaborn. Note that your data can be a variable or the column of a data frame.
import seaborn as sns

# Box plot
sns.boxplot(x = variable)

# Equivalent to:
sns.boxplot(x = "variable", data = df)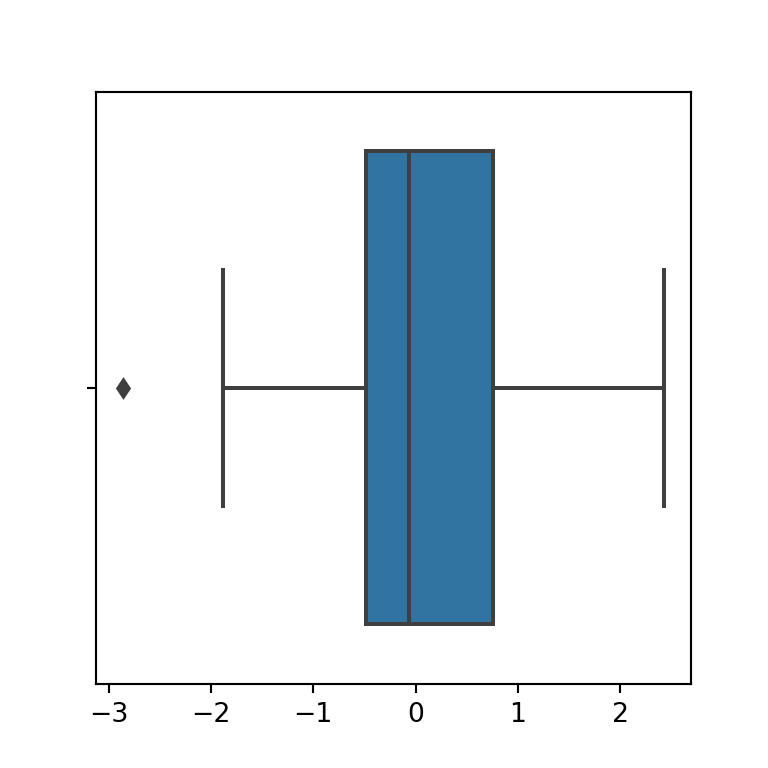
Vertical
If you prefer a vertical box plot you will need to pass your data to the y argument instead of to x.
import seaborn as sns

# Box plot
sns.boxplot(y = variable)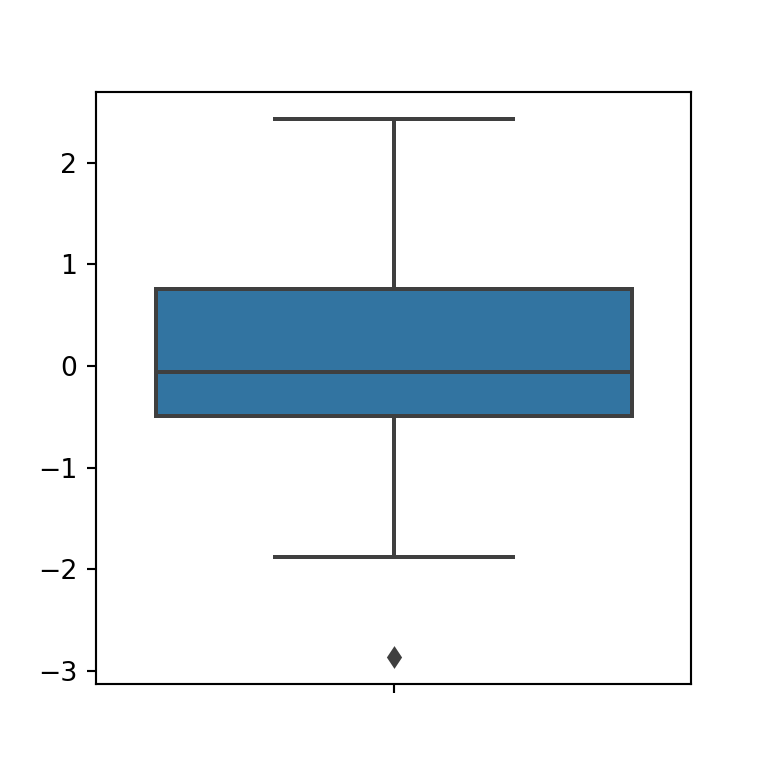
Fill color
The fill color of the box is blue by default, but can be set to any other color with the color argument of the plotting function.
import seaborn as sns

# Box plot
sns.boxplot(x = variable,
            color = "orange")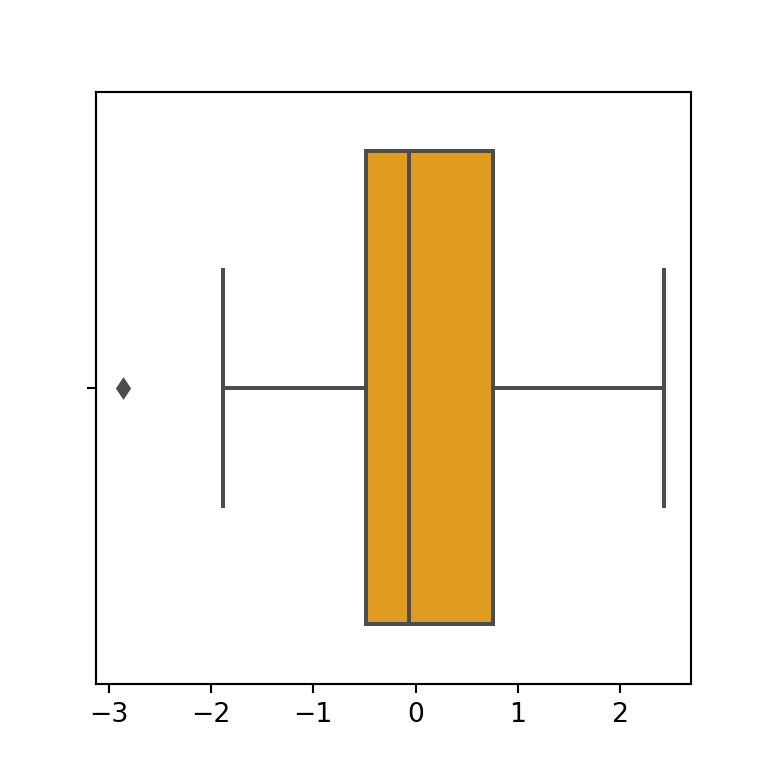
Further customization
Note that the function provides several arguments to customize the graphic. Some of them are highlighted in the following block of code.
import seaborn as sns

# Box plot
sns.boxplot(x = variable,
            fliersize = 10, # Outlier size
            linewidth = 3,  # Lines width
            saturation = 0.95) # Fill color saturation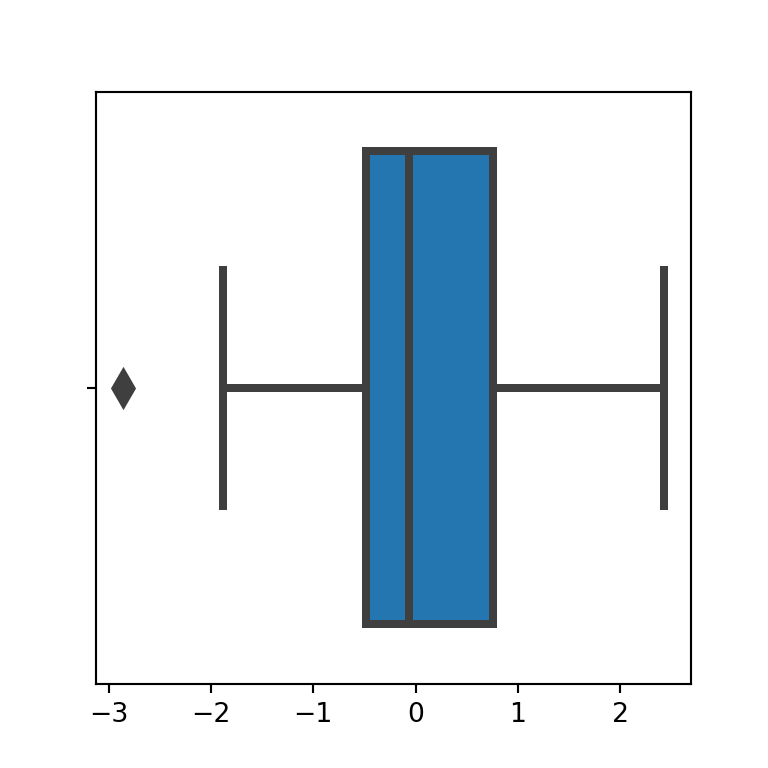
Box plot by group in seaborn

Grouped box plot
If you pass a categorical variable and a numerical variable to the function you can create a box plot by group. In case you want an horizontal box plot by group pass the numerical variable to x and the categorical to y.
import seaborn as sns

# Box plot by group
sns.boxplot(x = variable,
            y = group)
Orientation
If you prefer a vertical box plot by group switch the arguments, as shown below:
import seaborn as sns

# Box plot by group
sns.boxplot(y = variable,
            x = group)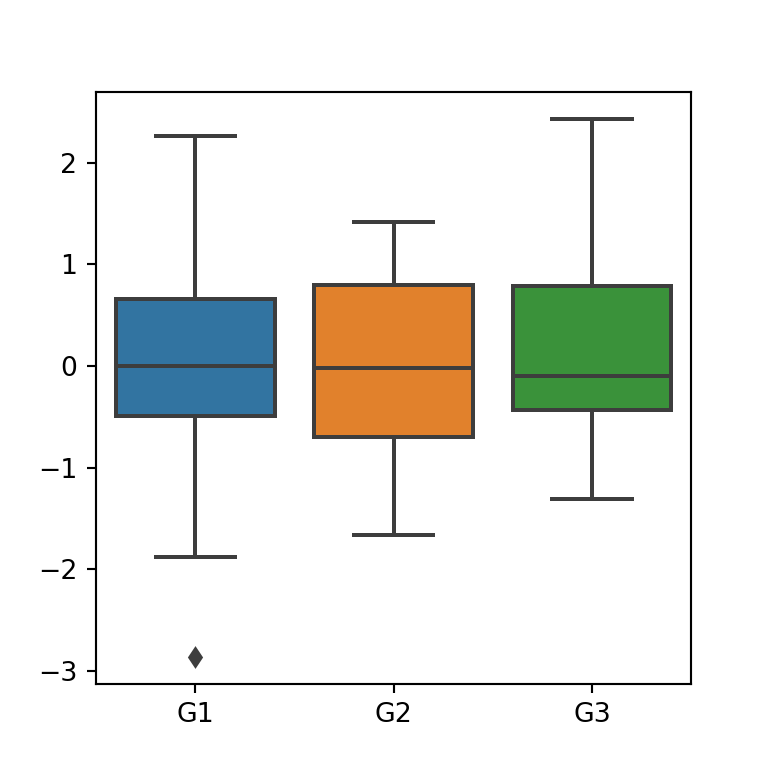
Order
Note that the order argument controls the order of the groups. If you want to change the default order (based on the order of appearance of the groups on the variable) pass a list to the argument with the desired order.
import seaborn as sns

# Box plot by group
sns.boxplot(y = variable,
            x = group,
            order = ["G1", "G2", "G3"])
Color palette
The palette argument controls the colors of the box plots. You can pass a predefined color palette, as in the following example, or a dictionary with the colors for each group.
import seaborn as sns

# Box plot by group
sns.boxplot(y = variable,
            x = group,
            palette = "Set3")
Box plot by group and subgroup
Finally, if you provide other grouping variable to the hue argument you can create a dodged box plot, i.e., a box plot by group and subgroup.
import seaborn as sns

# Box plot by group
sns.boxplot(y = variable,
            x = group,
            hue = group2)


