Basic kernel density plot in seaborn with kdeplot
The kdeplot function from seaborn calculates a kernel density estimate of the data and plots it. By default the function uses a gaussian kernel, 200 points as grid for the X-axis and a bandwidth factor of 1 for the Scott method.
import numpy as np
import seaborn as sns

# Data simulation
rng = np.random.RandomState(4)
x = rng.normal(0, 1, size = 100)
df = {'x': x}

# KDE plot
sns.kdeplot(x = x)

# Equivalent to:
sns.kdeplot(x = "x", data = df)
It is possible to modify the default color of the density with the color argument of the function. Note that you could also modify the line type or width with linestyle and linewidth, respectively.
import numpy as np
import seaborn as sns

# Data simulation
rng = np.random.RandomState(4)
x = rng.normal(0, 1, size = 100)

# KDE plot
sns.kdeplot(x = x, color = "red")
Moreover, you can also fill the area under the density plot with fill = True and specify the desired color and transparency with color and alpha, respectively.
import numpy as np
import seaborn as sns

# Data simulation
rng = np.random.RandomState(4)
x = rng.normal(0, 1, size = 100)

# KDE plot
sns.kdeplot(x = x,
            fill = True, color = "green", alpha = 0.5)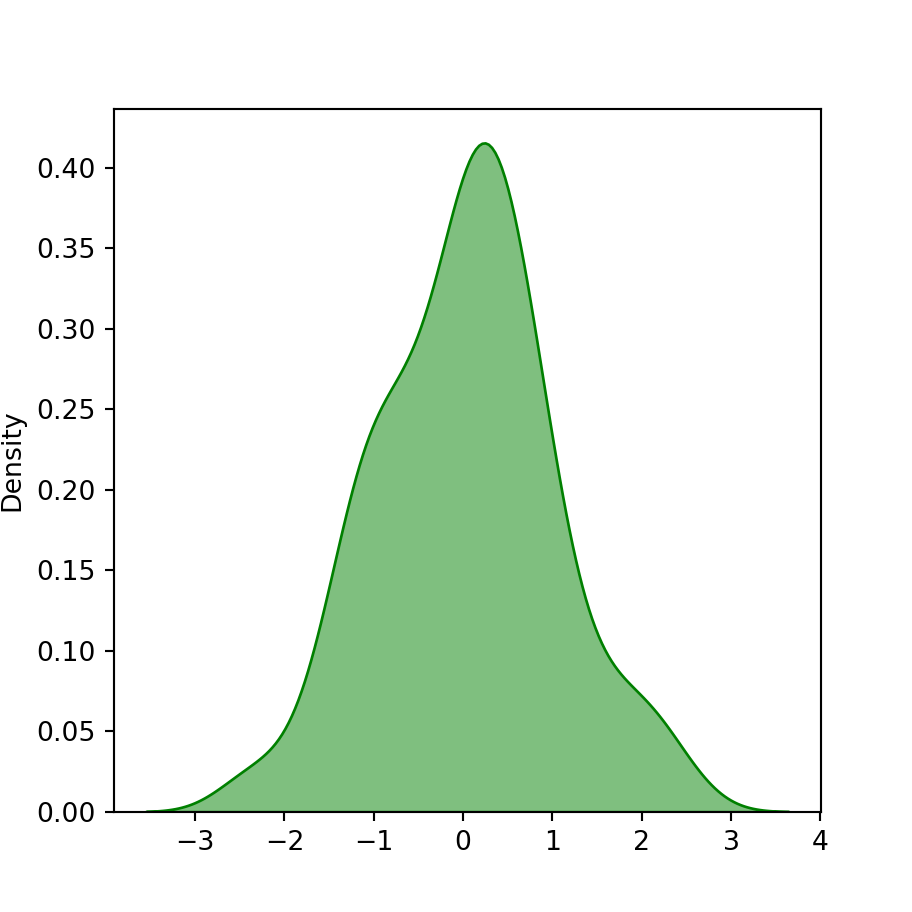
Bandwidth selection
As we pointed out before, the function uses a bandwidth factor of 1 by default for the Scott method, but you can override it with the bw_adjust argument. You can also use the Silverman method instead of the Scott method with the bw_method argument. See this documentation for more details.

import numpy as np
import seaborn as sns

# Data simulation
rng = np.random.RandomState(4)
x = rng.normal(0, 1, size = 100)

# KDE plot
sns.kdeplot(x = x,
            bw_adjust = 0.5)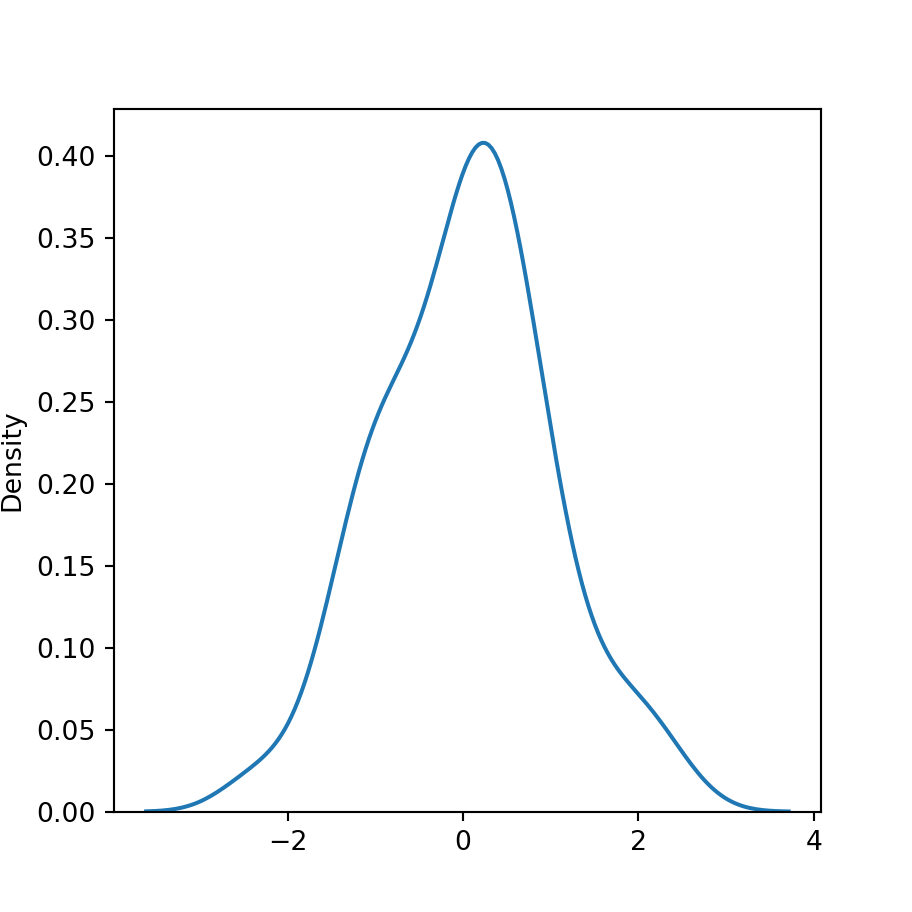
Silverman method
import numpy as np
import seaborn as sns

# Data simulation
rng = np.random.RandomState(4)
x = rng.normal(0, 1, size = 100)

# KDE plot
sns.kdeplot(x = x,
            bw_method = "silverman")
Kernel selection was deprecated in 0.11.0, so the support of non-gaussian kernels was removed.


