Basic histogram in seaborn with histplot
Given a vector you can create a histogram in seaborn with the histplot function. Note that you can pass a single variable or a variable of a data set as a key.
import numpy as np
import seaborn as sns

# Data simulation
rng = np.random.RandomState(0)
x = rng.normal(0, 1, size = 1000)
df = {'x': x}

# Histogram
sns.histplot(x = x)

# Equivalent to:
sns.histplot(x = "x", data = df)
Horizontal histogram
If you prefer a horizontal histogram, instead of passing your variable to the x argument of the function you just need to pass it to y.
import numpy as np
import seaborn as sns

# Data simulation
rng = np.random.RandomState(0)
x = rng.normal(0, 1, size = 1000)
df = {'x': x}

# Histogram
sns.histplot(y = x)
Shrink
The shrink argument of the function controls the scale of the width of each bar (between 0 and 1). In the following example we are creating bins with the half of the default size.
import numpy as np
import seaborn as sns

# Data simulation
rng = np.random.RandomState(0)
x = rng.normal(0, 1, size = 1000)
df = {'x': x}

sns.histplot(x = x, shrink = 0.5)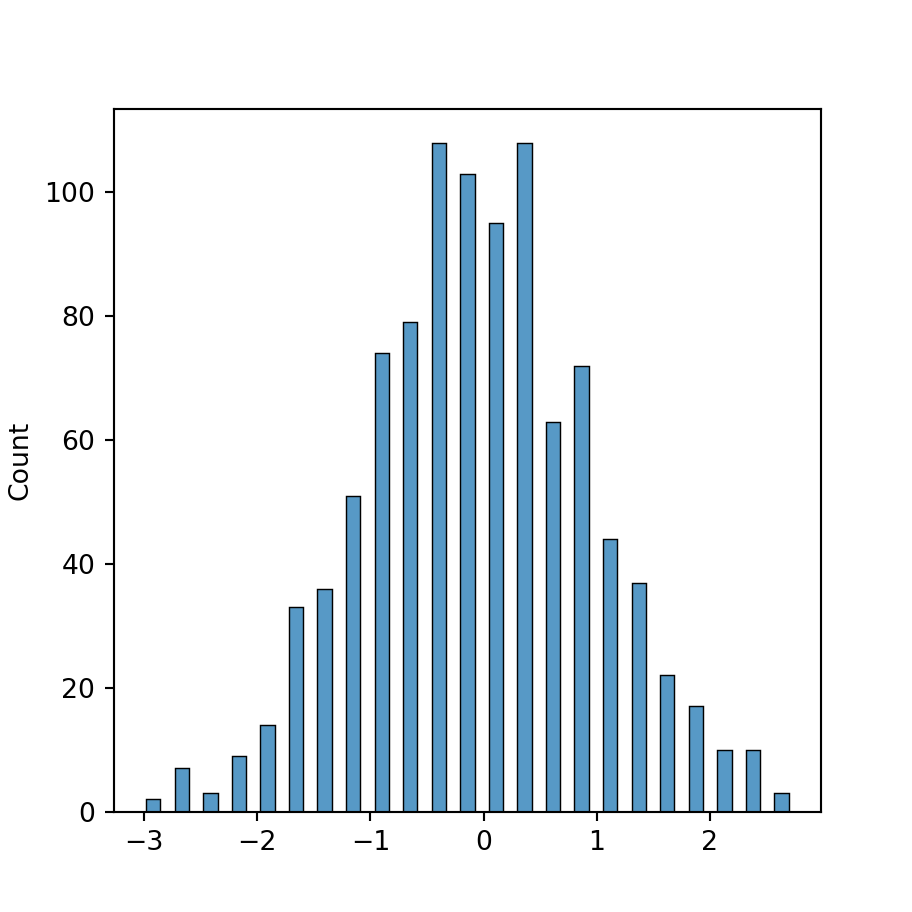
In addition, the function provides a way to modify the visual representation of the histogram statistic with the element argument, which default to "bars". Other options are "step" and "poly".
Step
import numpy as np
import seaborn as sns

# Data simulation
rng = np.random.RandomState(0)
x = rng.normal(0, 1, size = 1000)
df = {'x': x}

sns.histplot(x = x, element = "step")
Polygon
import numpy as np
import seaborn as sns

# Data simulation
rng = np.random.RandomState(0)
x = rng.normal(0, 1, size = 1000)
df = {'x': x}

sns.histplot(x = x, element = "poly")
Histogram types
The stat argument of the histplot function controls the type of the histogram to be plotted. By default, stat = "count", which shows the number of observations in each bin. However, there are other options you can select, such as "frequency" (frequency histogram), "probability", "percent" and "density" (density histogram). The following blocks of code show a couple of examples.

Density histogram
import numpy as np
import seaborn as sns

# Data simulation
rng = np.random.RandomState(0)
x = rng.normal(0, 1, size = 1000)
df = {'x': x}

sns.histplot(x = x, stat = "density")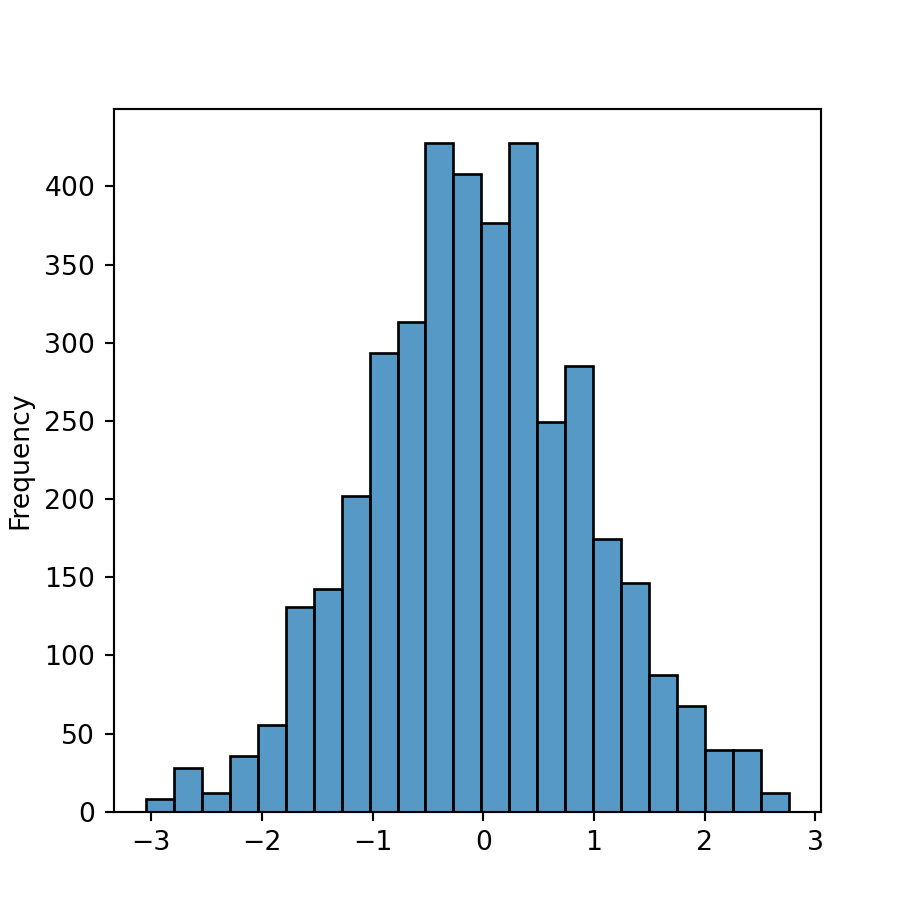
Frequency histogram
import numpy as np
import seaborn as sns

# Data simulation
rng = np.random.RandomState(0)
x = rng.normal(0, 1, size = 1000)
df = {'x': x}

sns.histplot(x = x, stat = "frequency")
Binwidth and number of bins
When using seaborn to create a histogram the number of bins is calculated automatically with the numpy.histogram_bin_edges function, which default estimator is called "auto" and is the maximum of the "sturges" (Sturges method) and "fd" (Freedman Diaconis) estimators. Nonetheless, there are several ways to compute the number of bins of the histogram.
Binwidth
It is possible to set the width of the bins with binwidth, as shown below.
import numpy as np
import seaborn as sns

# Data simulation
rng = np.random.RandomState(0)
x = rng.normal(0, 1, size = 1000)
df = {'x': x}

sns.histplot(x = x, binwidth = 0.5)
Number of bins
You can also use the bins argument to select any number of equal-width bins to be used on the graphical visualization.
import numpy as np
import seaborn as sns

# Data simulation
rng = np.random.RandomState(0)
x = rng.normal(0, 1, size = 1000)
df = {'x': x}

sns.histplot(x = x, bins = 5)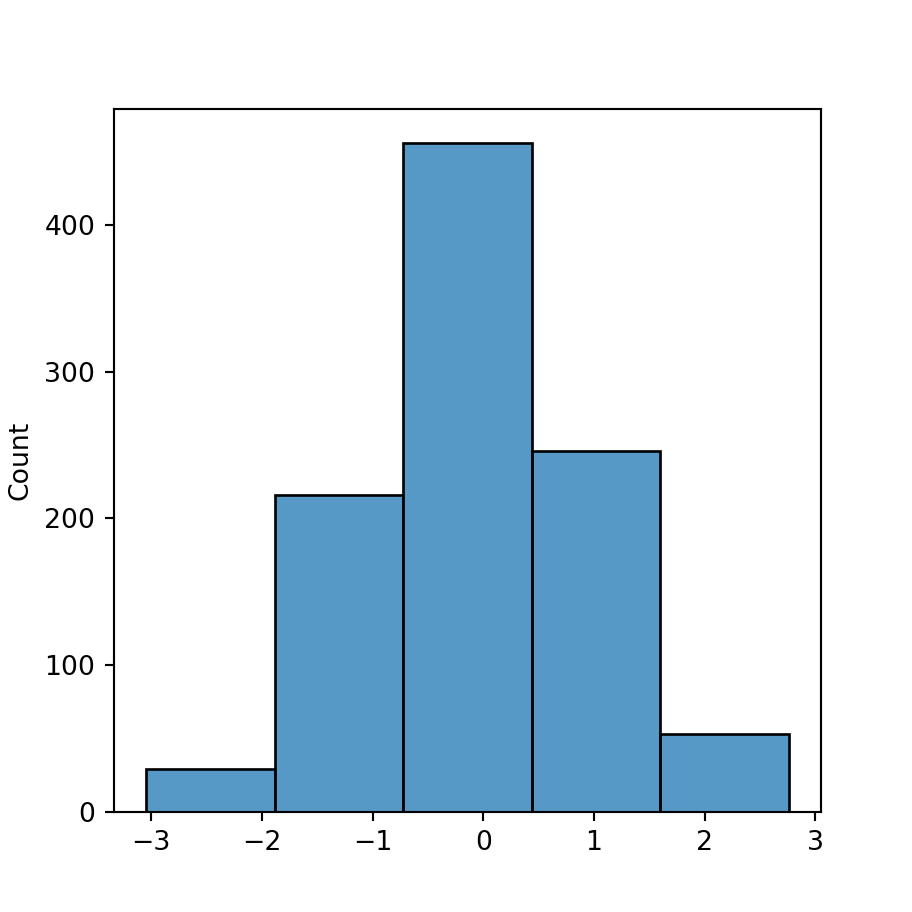
Sturges method
Note that the bins argument also accepts keywords, which allows selecting between different estimators. Some of the most popular estimators are the Sturges, Freedman Diaconis or Scott estimators. Possible options are: "auto" (default), "sturges", "fd", "scott", "doane", "stone", "rice" and "sqrt". See the histogram_bin_edges documentation for further details.
import numpy as np
import seaborn as sns

# Data simulation
rng = np.random.RandomState(0)
x = rng.normal(0, 1, size = 1000)
df = {'x': x}

sns.histplot(x = x, bins = "sturges")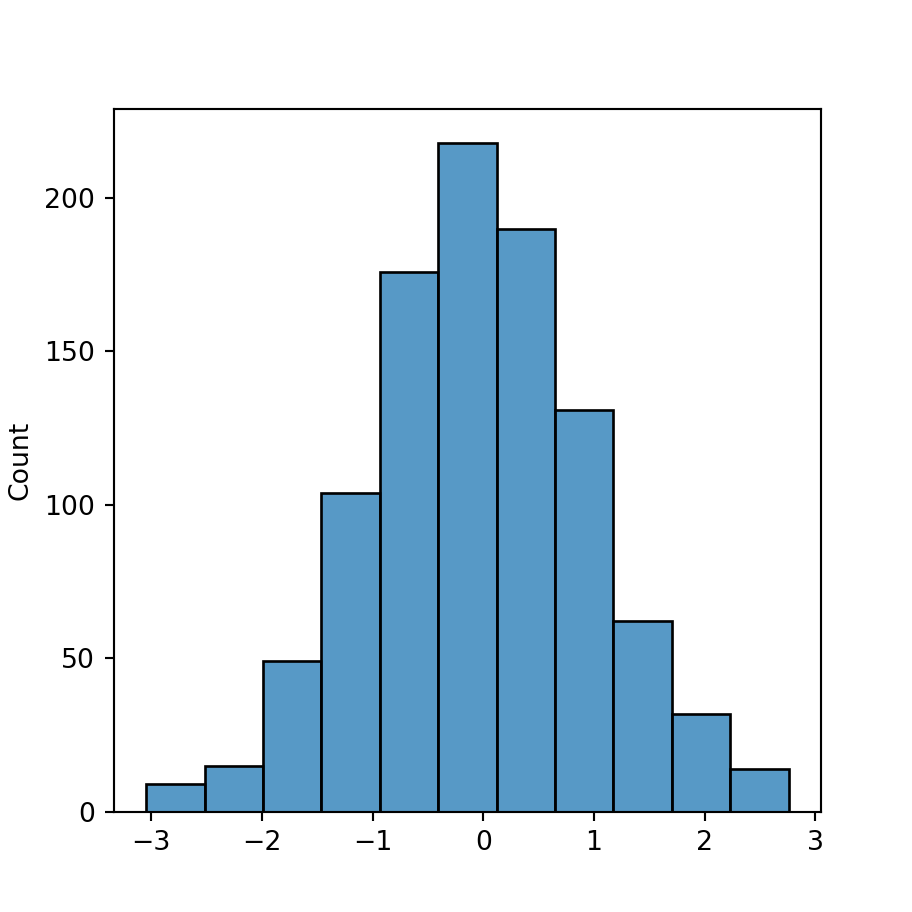
Color customization
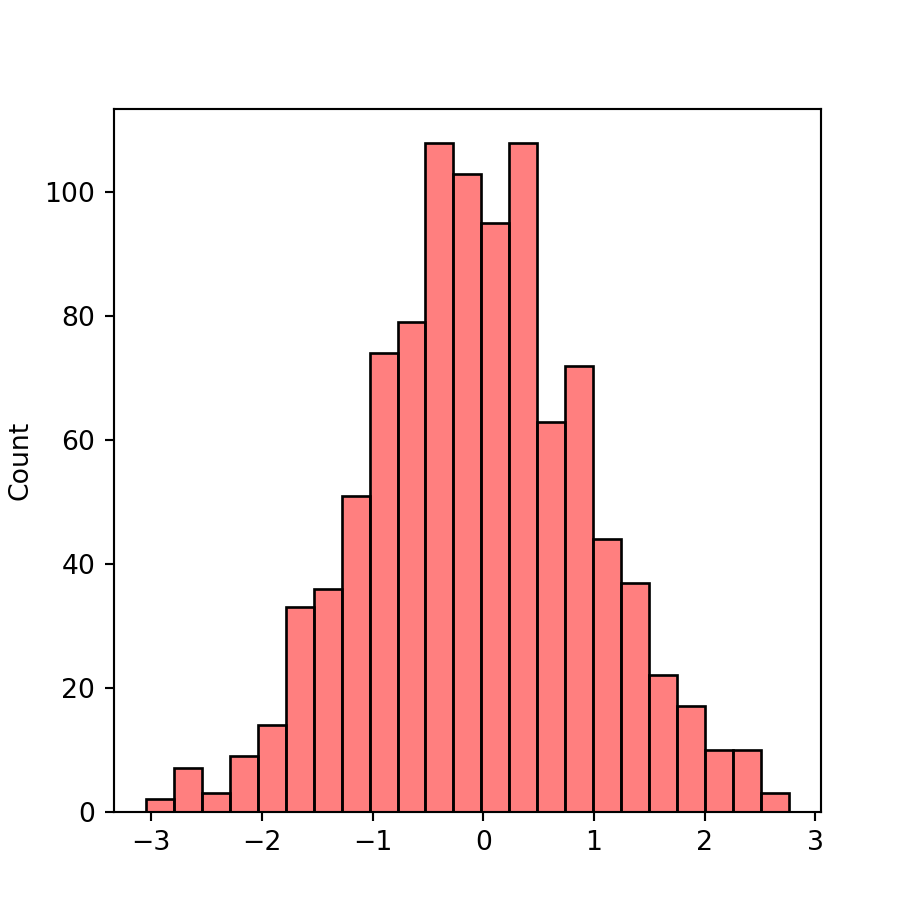
Fill color
By default, the fill color for each bin is blue. However, you can choose other color with the color argument. Note that you can also modify the transparency of the color with the alpha argument of the function.
import numpy as np
import seaborn as sns

# Data simulation
rng = np.random.RandomState(0)
x = rng.normal(0, 1, size = 1000)
df = {'x': x}

sns.histplot(x = x,
             color = "red", alpha = 0.5)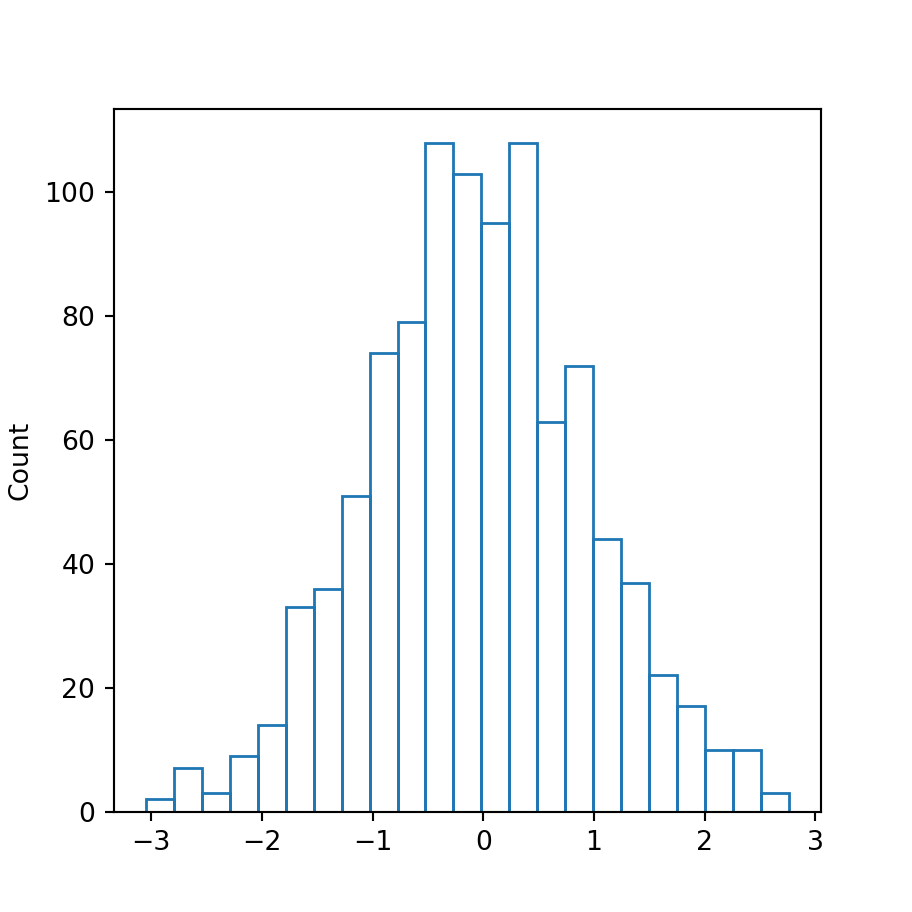
Remove the fill color
If you prefer removing the fill color you can set the argument fill to False.
import numpy as np
import seaborn as sns

# Data simulation
rng = np.random.RandomState(0)
x = rng.normal(0, 1, size = 1000)
df = {'x': x}

sns.histplot(x = x,
             fill = False)
Border width, style and color
Finally, the border for each bin can also be customized. You can change its color with edgecolor, its width with linewidth and the style of the line with linestyle.
import numpy as np
import seaborn as sns

# Data simulation
rng = np.random.RandomState(0)
x = rng.normal(0, 1, size = 1000)
df = {'x': x}

sns.histplot(x = x,
             edgecolor = "white",
             linewidth = 2)


