Sample data
The following data will be used as reproducible sample data for the following code examples. Copy these lines to get the same outputs of this tutorial.
import numpy as np
import seaborn as sns
import random

# Data simulation
rng = np.random.RandomState(7)
variable = rng.normal(0.5, 2, size = 250)
random.seed(7)
group = random.choices(["G1", "G2", "G3"], k = 250)
group2 = random.choices(["A", "B"], k = 250)
df = {'variable': variable, 'group': group, 'group2': group2}
Strip plot in seaborn with stripplot
The stripplot function can be used to create strip plots, also known as strip charts, in Python. You just need to input the variable of interest to the function.
import seaborn as sns

# Strip plot
sns.stripplot(x = variable)

# Equivalent to:
sns.stripplot(x = "variable", data = df)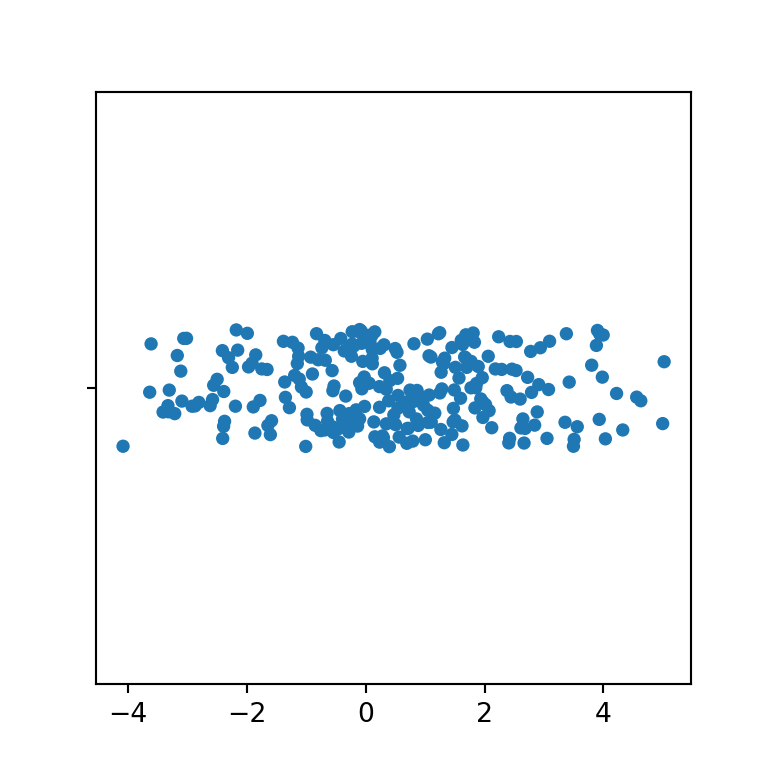
Vertical
If you prefer a strip plot in portrait mode pass the variable to the argument y.
import seaborn as sns

# Strip plot
sns.stripplot(y = variable)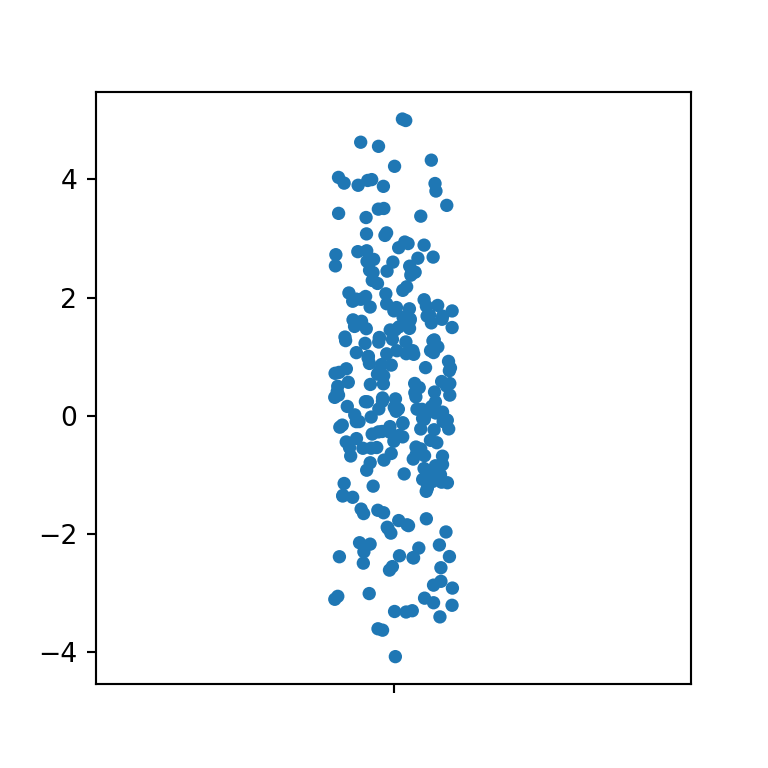
Color
By default, the color of the observations is blue, but you can override the default color setting a color with the color argument.
import seaborn as sns

# Strip plot
sns.stripplot(x = variable,
              color = "darkseagreen")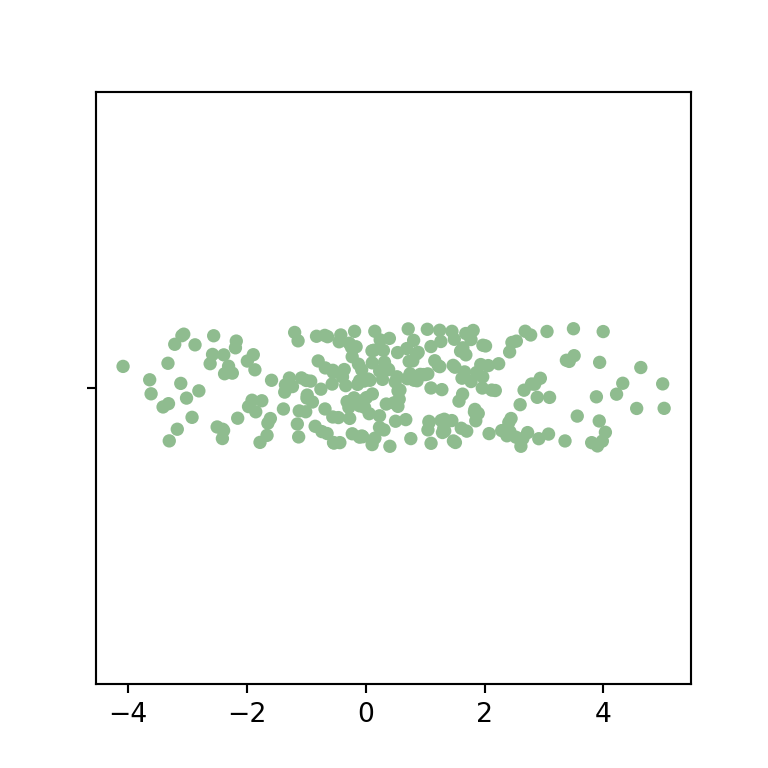
Border
Note that you can also add border lines to the observations, passing a positive value to the linewidth argument of the function.
import seaborn as sns

# Strip plot
sns.stripplot(x = variable,
              linewidth = 1,
              color = "darkseagreen")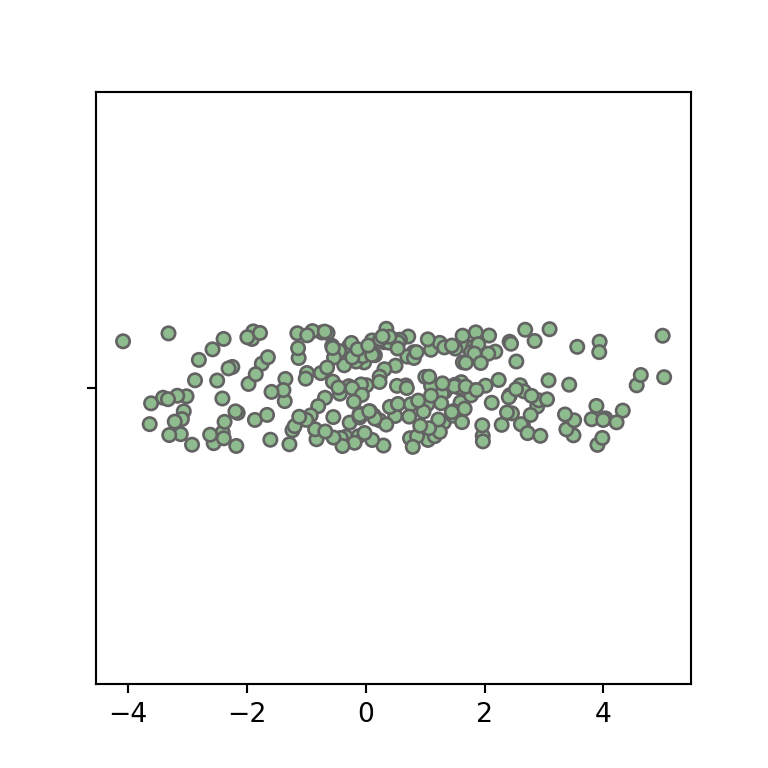
Marker
The default markers are points, but you can choose the desired marker with the marker argument, as shown below.
import seaborn as sns

# Strip plot
sns.stripplot(x = variable,
              marker = "D")
Size and transparency
You can also modify the size and the level of transparency of the markers, with size and alpha, respectively.
import seaborn as sns

# Strip plot
sns.stripplot(x = variable,
              size = 10,
              alpha = 0.2)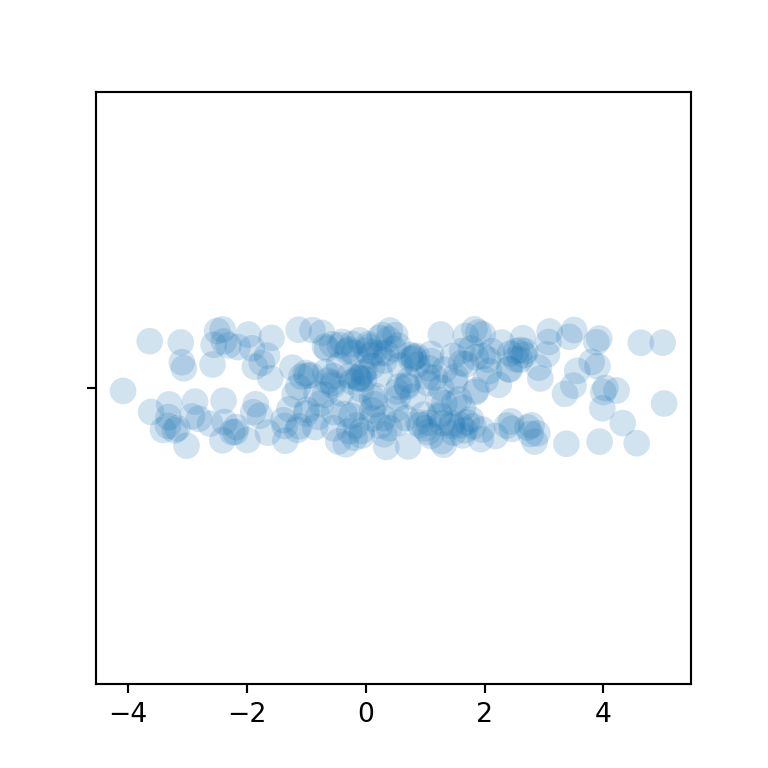
Jitter
Finally, the jitter argument is True by default, which adds an optimal level of jitter. You can pass a numerical value to the argument or turn off the jitter setting the argument to False.
import seaborn as sns

# Strip plot
sns.stripplot(x = variable,
              jitter = False)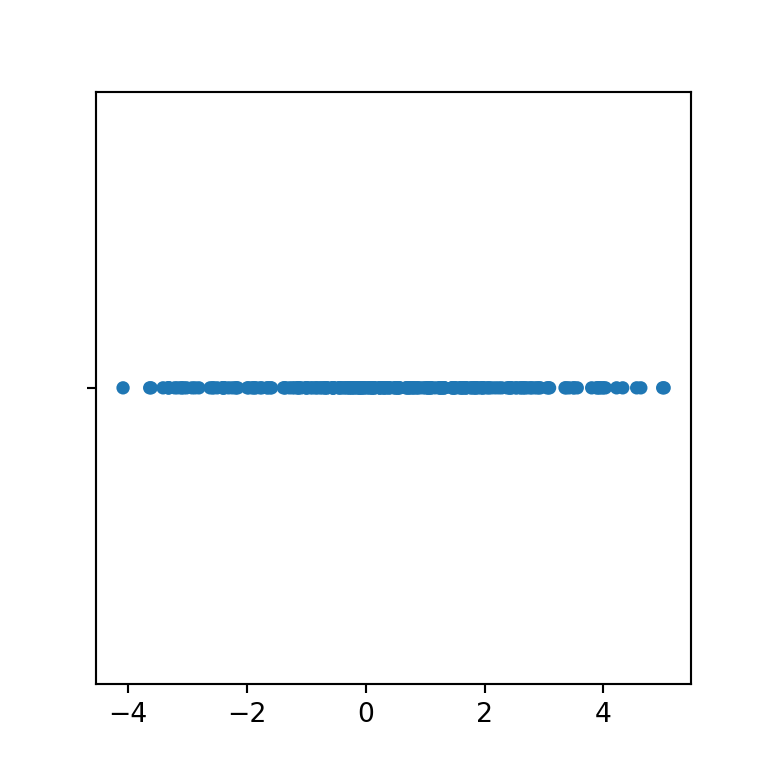
Strip plot by group
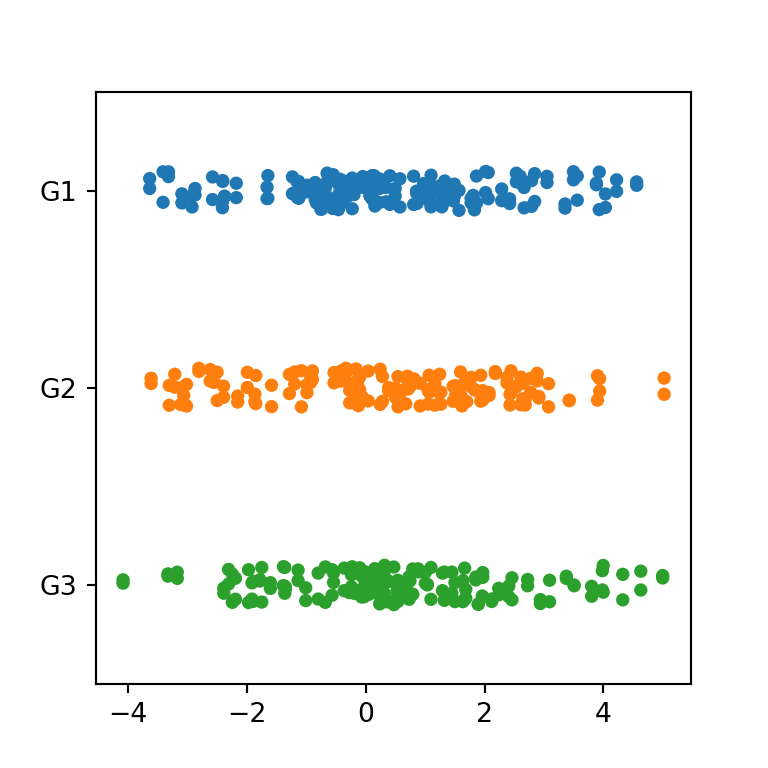
If your data contains a categorical variable representing groups you can also pass it to the function to create a strip plot by group in Python.
import seaborn as sns

# Strip plot
sns.stripplot(x = variable,
              y = group)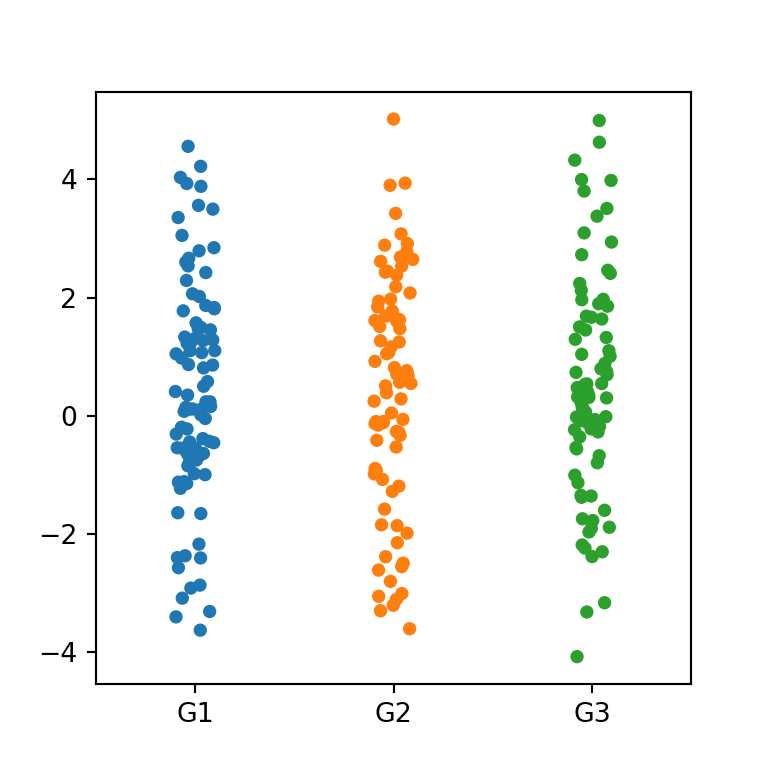
Orientation
Note that if you pass your numerical variable to y and the categorical to x you will create a vertical strip plot.
import seaborn as sns

# Strip plot
sns.stripplot(y = variable,
              x = group)
Color palette
The color palette can be set with the palette argument. You can pass a named palette or a dictionary with colors for each group.
import seaborn as sns

# Strip plot
sns.stripplot(y = variable,
              x = group,
              palette = "Set1")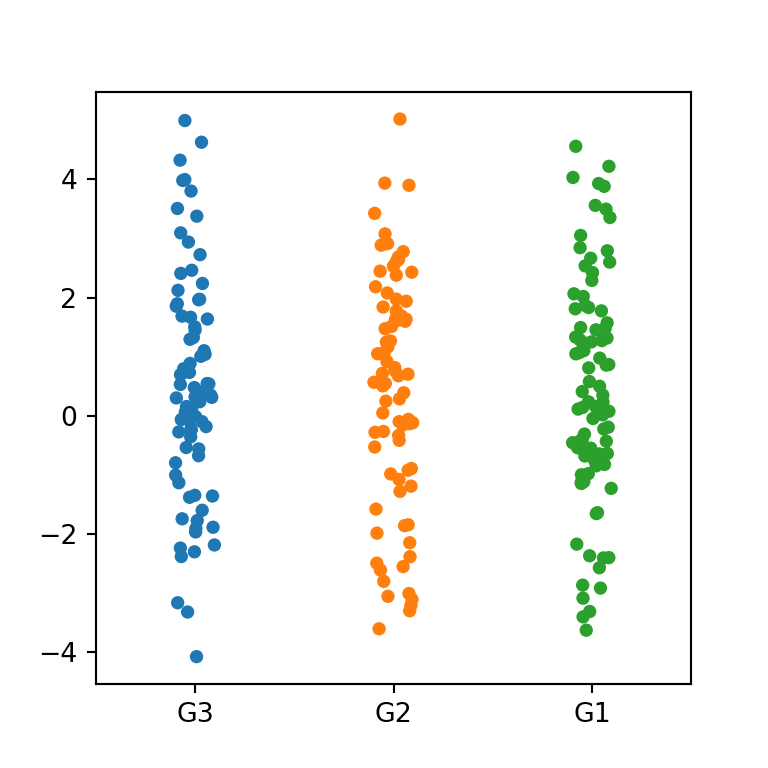
Order
You can also override the default order of the groups with order.
import seaborn as sns

# Strip plot
sns.stripplot(y = variable,
              x = group,
              order = ["G3", "G2", "G1"])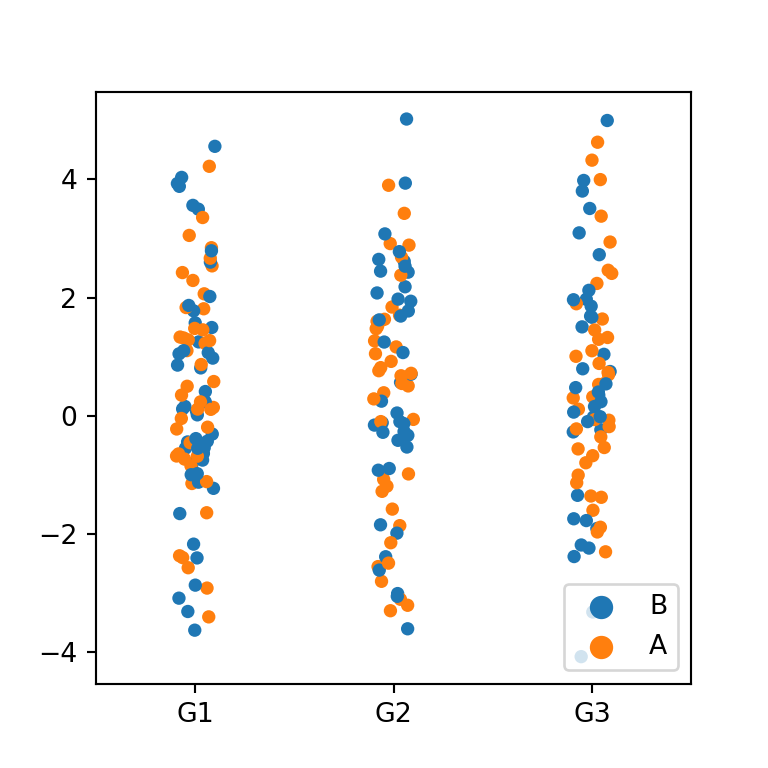
By group and subgroup
Note that if you have another categorical variable you can pass it to hue to create a strip plot by group and subgroup.
import seaborn as sns

# Strip plot
sns.stripplot(y = variable,
              x = group,
              hue = group2)
Dodged strip plot
In the previous scenario, you can set the dodge argument to True, so each subgroup will be displayed separated from the other.
import seaborn as sns

# Strip plot
sns.stripplot(y = variable,
              x = group,
              hue = group2,
              dodge = True)