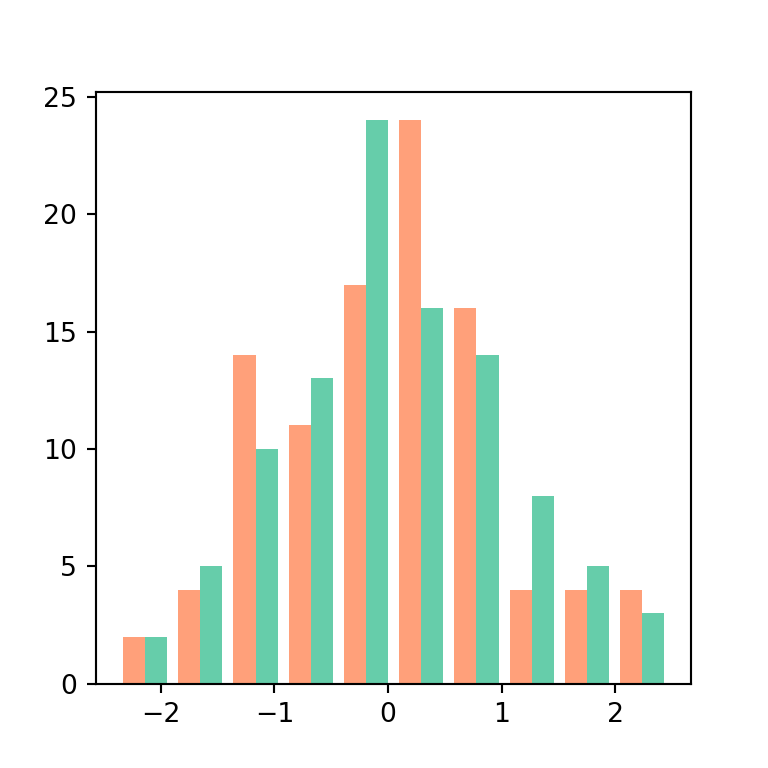
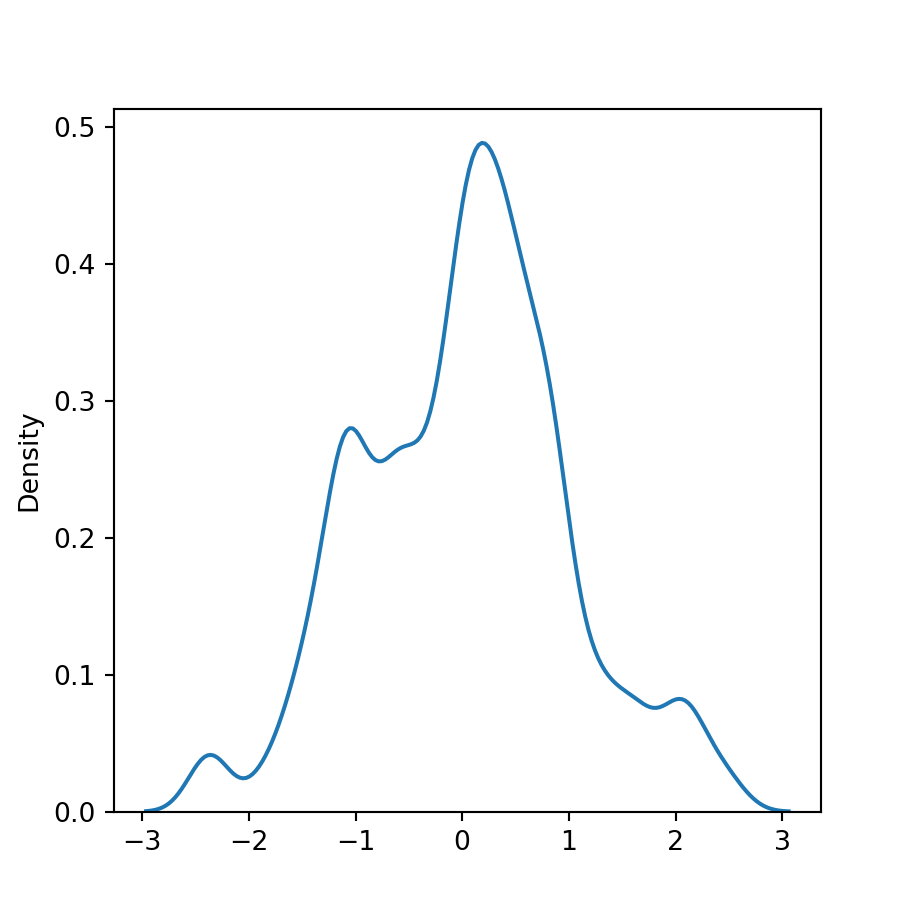
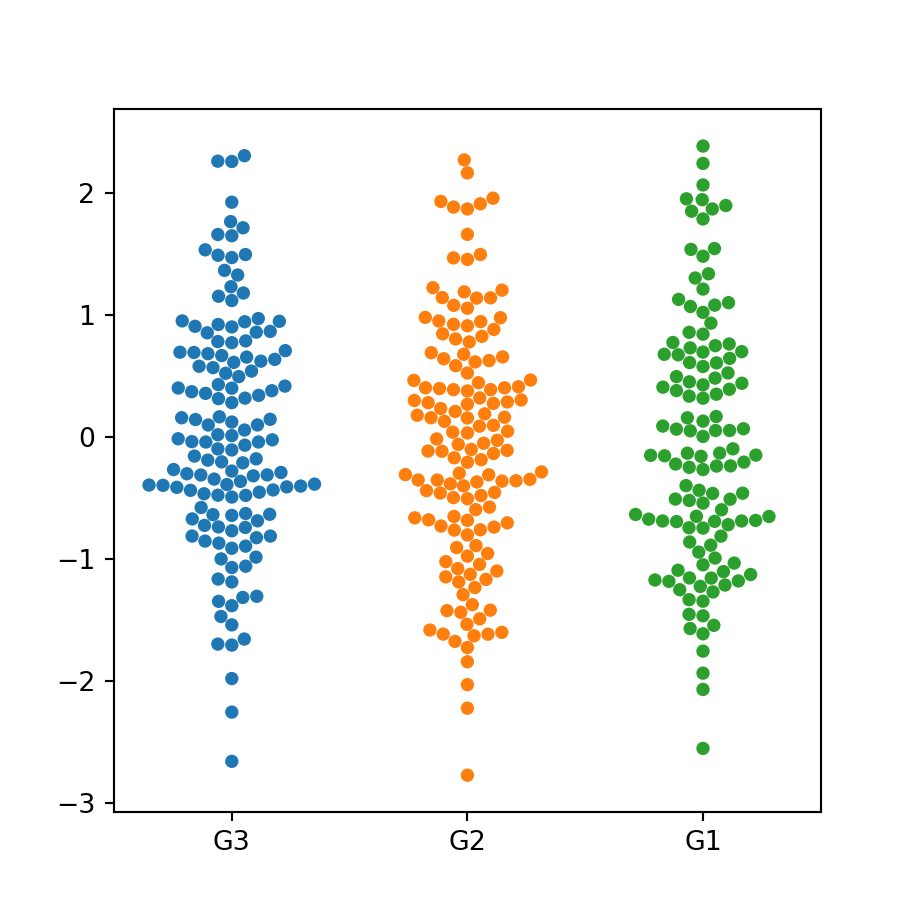
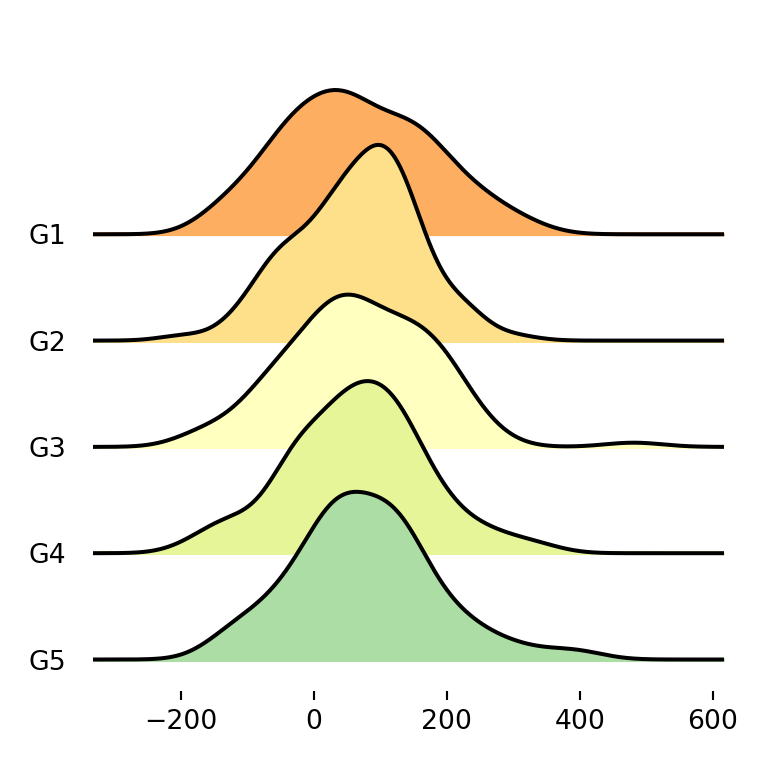
pandas provides two ways to create histograms: plot.hist, which draws all the columns in the same chart, and hist, which creates a grid with one histogram per column.
Histogram with plot.hist
Call plot.hist on a Series to draw its histogram. The bins argument sets the number of intervals (10 by default).
import numpy as np
import pandas as pd
import matplotlib.pyplot as plt

rng = np.random.default_rng(5)
df = pd.DataFrame({"math": rng.normal(65, 12, 300).clip(0, 100),
                   "physics": rng.normal(55, 15, 300).clip(0, 100),
                   "school": rng.choice(["North", "South", "East"], 300)})

df["math"].plot.hist(bins = 20, edgecolor = "white")
# plt.show()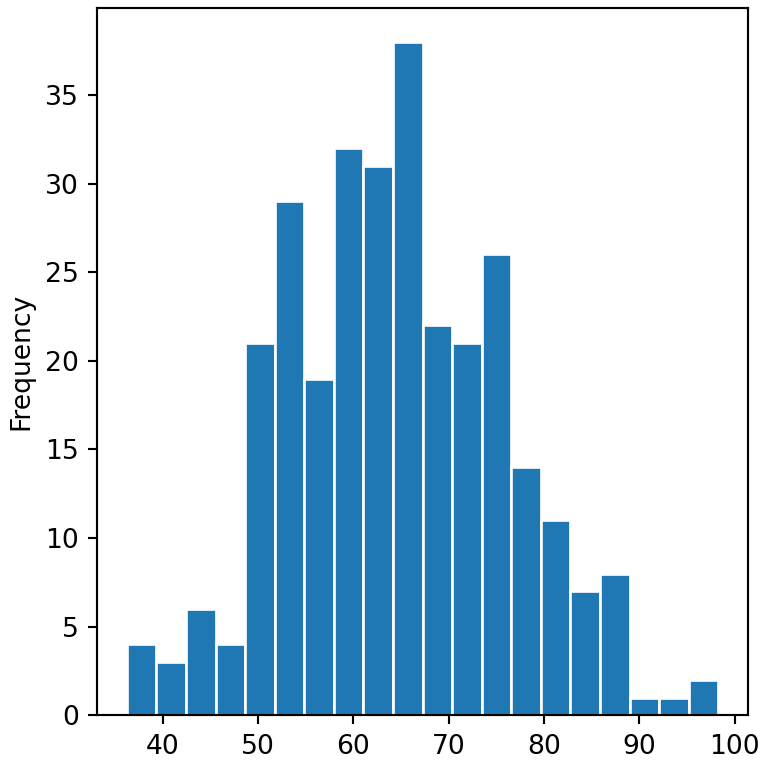
Several histograms in the same chart
On a data frame, plot.hist draws one histogram per column in the same chart. Set some transparency with alpha so all of them are visible, or stack them with stacked = True.
import numpy as np
import pandas as pd
import matplotlib.pyplot as plt

rng = np.random.default_rng(5)
df = pd.DataFrame({"math": rng.normal(65, 12, 300).clip(0, 100),
                   "physics": rng.normal(55, 15, 300).clip(0, 100),
                   "school": rng.choice(["North", "South", "East"], 300)})

df[["math", "physics"]].plot.hist(bins = 20, alpha = 0.5)
# plt.show()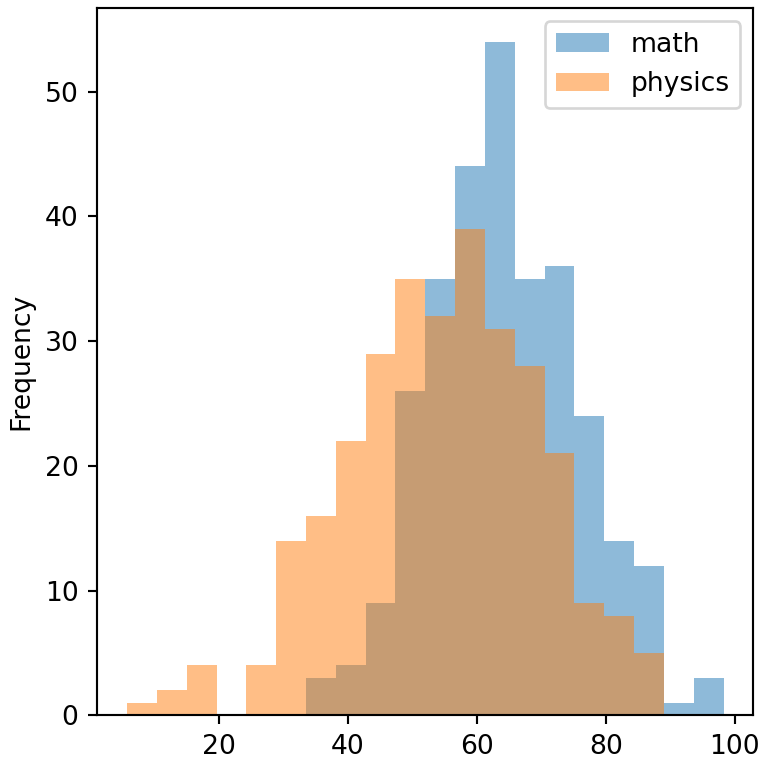
Stacked histogram
import numpy as np
import pandas as pd
import matplotlib.pyplot as plt

rng = np.random.default_rng(5)
df = pd.DataFrame({"math": rng.normal(65, 12, 300).clip(0, 100),
                   "physics": rng.normal(55, 15, 300).clip(0, 100),
                   "school": rng.choice(["North", "South", "East"], 300)})

df[["math", "physics"]].plot.hist(bins = 20, stacked = True)
# plt.show()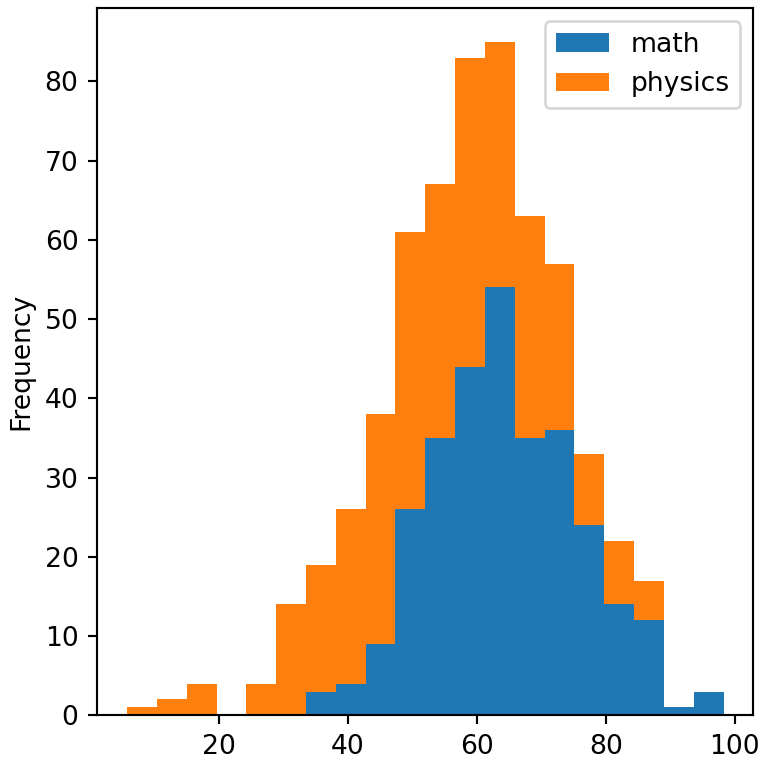
One histogram per column with hist
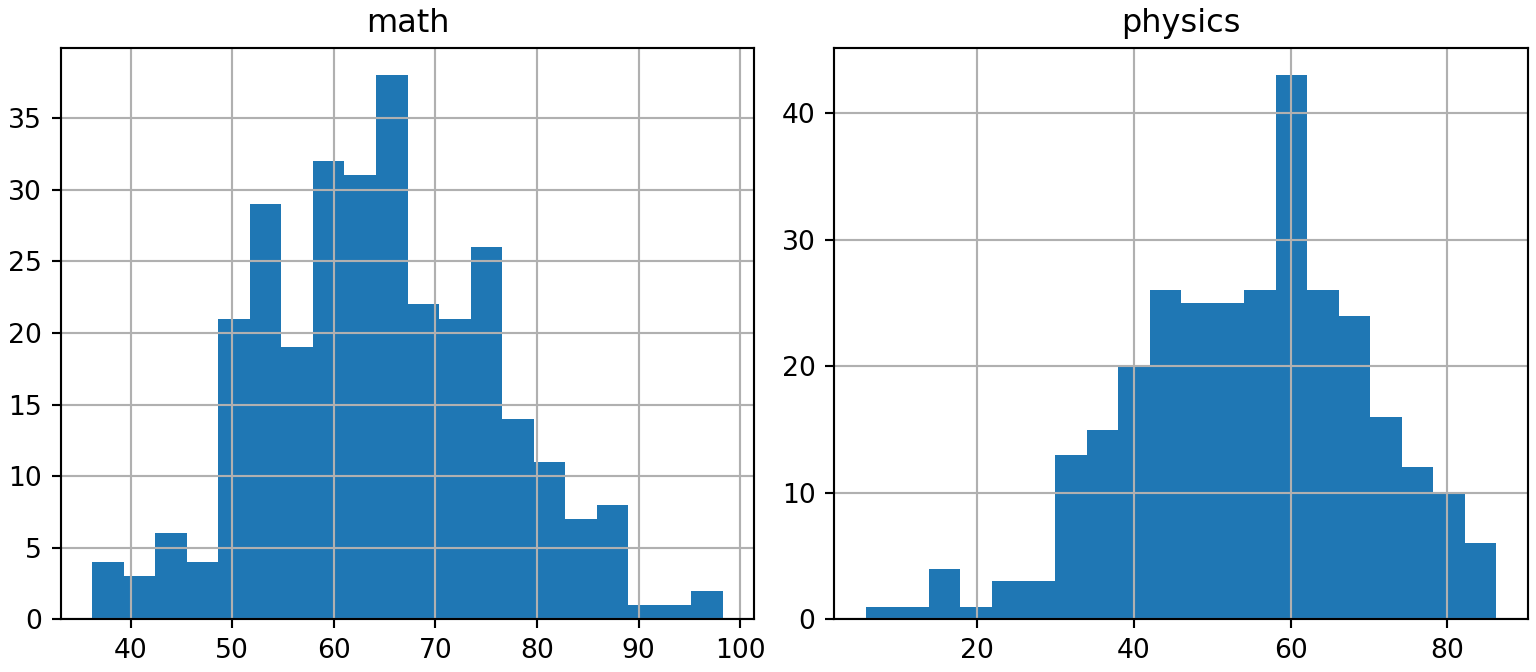
The hist method creates a grid of subplots with the histogram of each numeric column.
import numpy as np
import pandas as pd
import matplotlib.pyplot as plt

rng = np.random.default_rng(5)
df = pd.DataFrame({"math": rng.normal(65, 12, 300).clip(0, 100),
                   "physics": rng.normal(55, 15, 300).clip(0, 100),
                   "school": rng.choice(["North", "South", "East"], 300)})

df.hist(bins = 20, figsize = (8, 3.5))
# plt.show()
Histogram by group
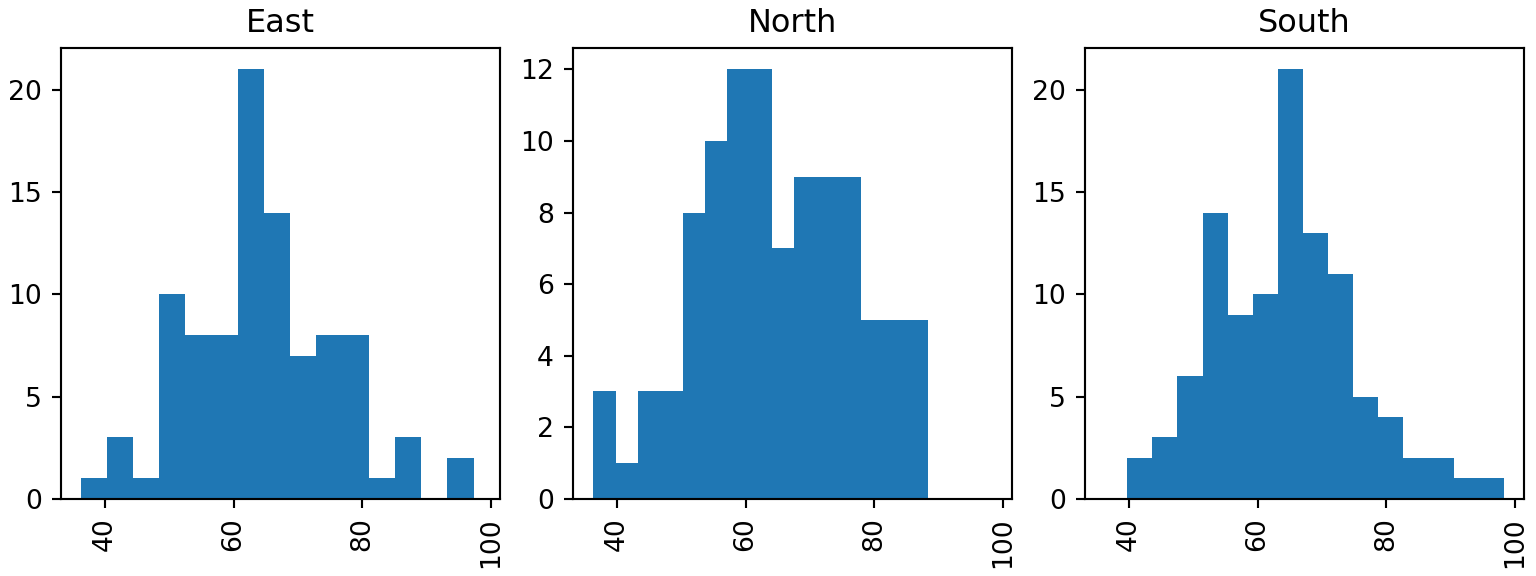
The by argument of hist creates one histogram for each group of a categorical variable.
import numpy as np
import pandas as pd
import matplotlib.pyplot as plt

rng = np.random.default_rng(5)
df = pd.DataFrame({"math": rng.normal(65, 12, 300).clip(0, 100),
                   "physics": rng.normal(55, 15, 300).clip(0, 100),
                   "school": rng.choice(["North", "South", "East"], 300)})

df.hist(column = "math", by = "school", bins = 15, layout = (1, 3),
        sharex = True, figsize = (8, 3))
# plt.show()
Histogram with density curve
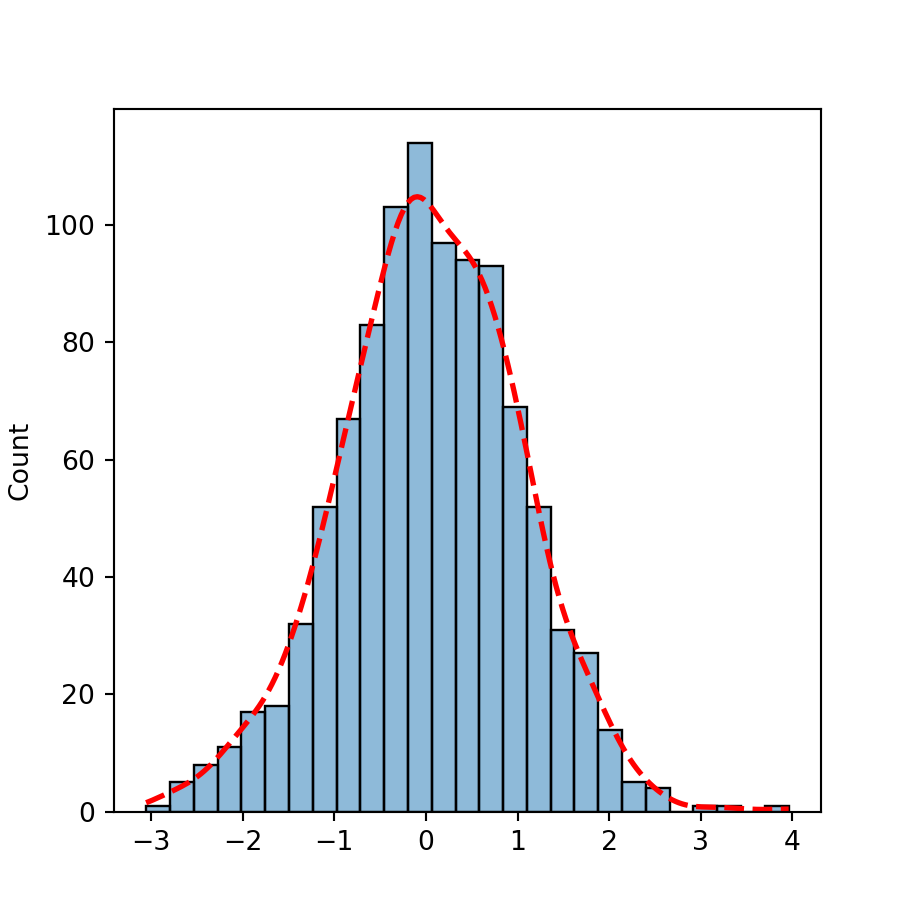
Use density = True to show the histogram as proportions and add the kernel density estimate with plot.kde on the same axes.
import numpy as np
import pandas as pd
import matplotlib.pyplot as plt

rng = np.random.default_rng(5)
df = pd.DataFrame({"math": rng.normal(65, 12, 300).clip(0, 100),
                   "physics": rng.normal(55, 15, 300).clip(0, 100),
                   "school": rng.choice(["North", "South", "East"], 300)})

ax = df["math"].plot.hist(bins = 20, density = True, alpha = 0.5)
df["math"].plot.kde(ax = ax)
# plt.show()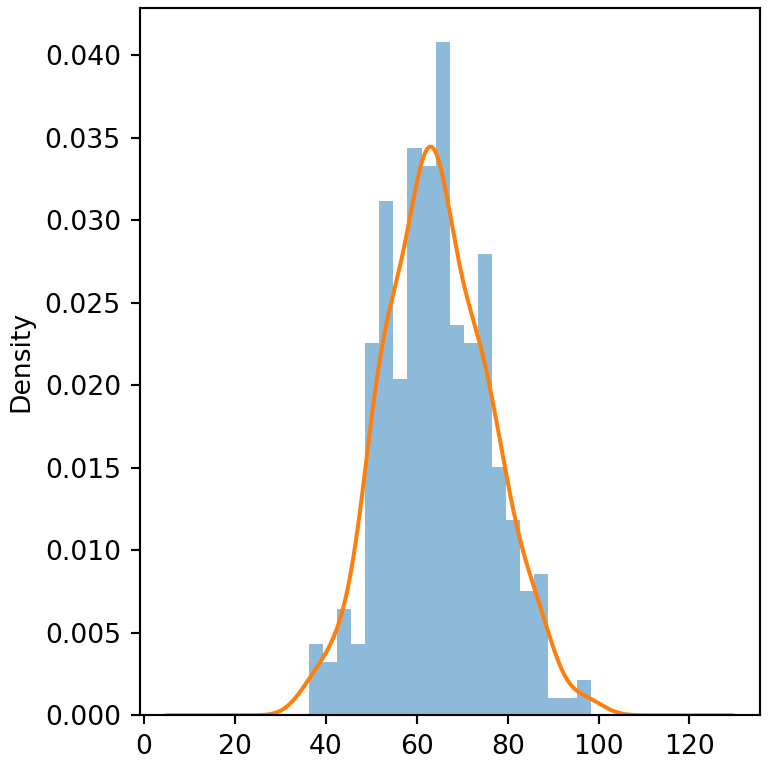
See also how to create a histogram in matplotlib or in seaborn, and the plotting with pandas guide.