A circular packing chart represents each group as a circle whose area is proportional to its value, and the circles are packed together without overlapping. When the data is hierarchical the circles are nested. The circlify library computes the position and the size of the circles and matplotlib draws them. The examples show the population (in millions) by continent and country.
Circular packing with circlify
circlify.circlify receives the values and returns a list of circles with their coordinates and radius. Draw each one with plt.Circle.
import circlify
import matplotlib.pyplot as plt

data = [{"id": "Asia", "datum": 4800}, {"id": "Africa", "datum": 1460},
        {"id": "Europe", "datum": 745}, {"id": "America", "datum": 1040},
        {"id": "Oceania", "datum": 45}]

circles = circlify.circlify(data, show_enclosure = False)

fig, ax = plt.subplots()
ax.axis("off")
ax.set_xlim(-1, 1)
ax.set_ylim(-1, 1)
ax.set_aspect("equal")

for circle in circles:
    x, y, r = circle
    ax.add_patch(plt.Circle((x, y), r, alpha = 0.6, linewidth = 2, edgecolor = "white"))
# plt.show()
Labels and colors
Each circle keeps the original data in circle.ex, so you can write the name of each group in the center of its circle and use a different color for each one.
import circlify
import matplotlib.pyplot as plt

data = [{"id": "Asia", "datum": 4800}, {"id": "Africa", "datum": 1460},
        {"id": "Europe", "datum": 745}, {"id": "America", "datum": 1040},
        {"id": "Oceania", "datum": 45}]

circles = circlify.circlify(data, show_enclosure = False)
colors = plt.cm.Set2.colors

fig, ax = plt.subplots()
ax.axis("off")
ax.set_xlim(-1, 1)
ax.set_ylim(-1, 1)
ax.set_aspect("equal")

for circle, color in zip(circles, colors):
    x, y, r = circle
    ax.add_patch(plt.Circle((x, y), r, color = color))
    ax.annotate(circle.ex["id"], (x, y), ha = "center", va = "center")
# plt.show()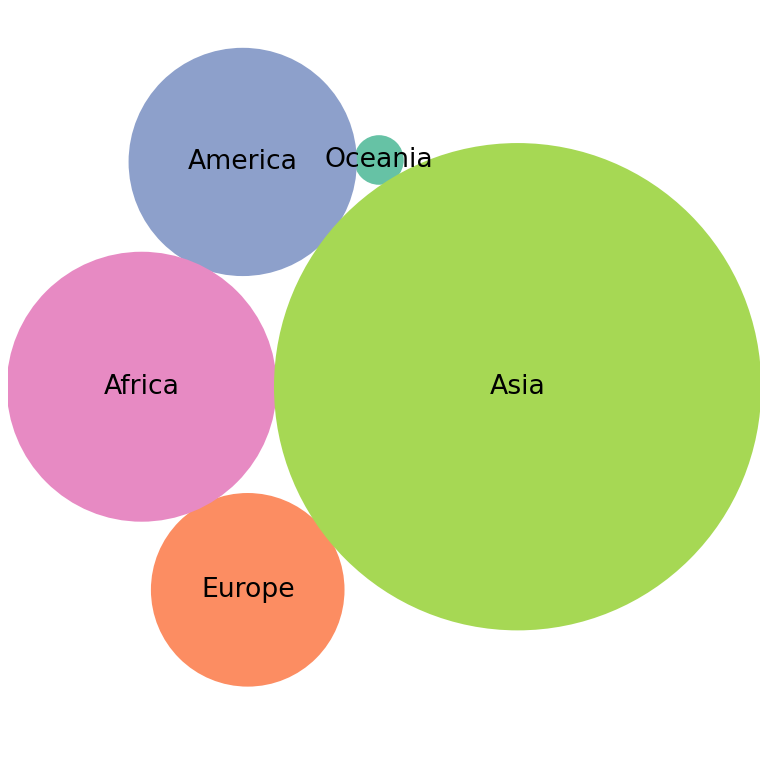
Hierarchical data with nested circles
Add a children key to each group to create a hierarchy. The returned circles have a level attribute that indicates the depth, which can be used to style each level differently.
import circlify
import matplotlib.pyplot as plt

data = [{"id": "Europe", "datum": 280, "children": [
            {"id": "Germany", "datum": 84}, {"id": "France", "datum": 68},
            {"id": "Italy", "datum": 59}, {"id": "Spain", "datum": 48}, {"id": "Poland", "datum": 37}]},
        {"id": "Asia", "datum": 2950, "children": [
            {"id": "India", "datum": 1430}, {"id": "China", "datum": 1410},
            {"id": "Japan", "datum": 124}]},
        {"id": "America", "datum": 760, "children": [
            {"id": "USA", "datum": 335}, {"id": "Brazil", "datum": 216},
            {"id": "Mexico", "datum": 129}, {"id": "Canada", "datum": 39}]}]

circles = circlify.circlify(data, show_enclosure = False)

fig, ax = plt.subplots()
ax.axis("off")
ax.set_xlim(-1, 1)
ax.set_ylim(-1, 1)
ax.set_aspect("equal")

for circle in circles:
    x, y, r = circle
    if circle.level == 1:
        ax.add_patch(plt.Circle((x, y), r, color = "#A8DADC", alpha = 0.6))
        ax.annotate(circle.ex["id"], (x, y + r * 0.85), ha = "center", fontsize = 10, weight = "bold")
    else:
        ax.add_patch(plt.Circle((x, y), r, color = "#457B9D"))
        if r > 0.08:
            ax.annotate(circle.ex["id"], (x, y), ha = "center", va = "center", color = "white", fontsize = 8)
# plt.show()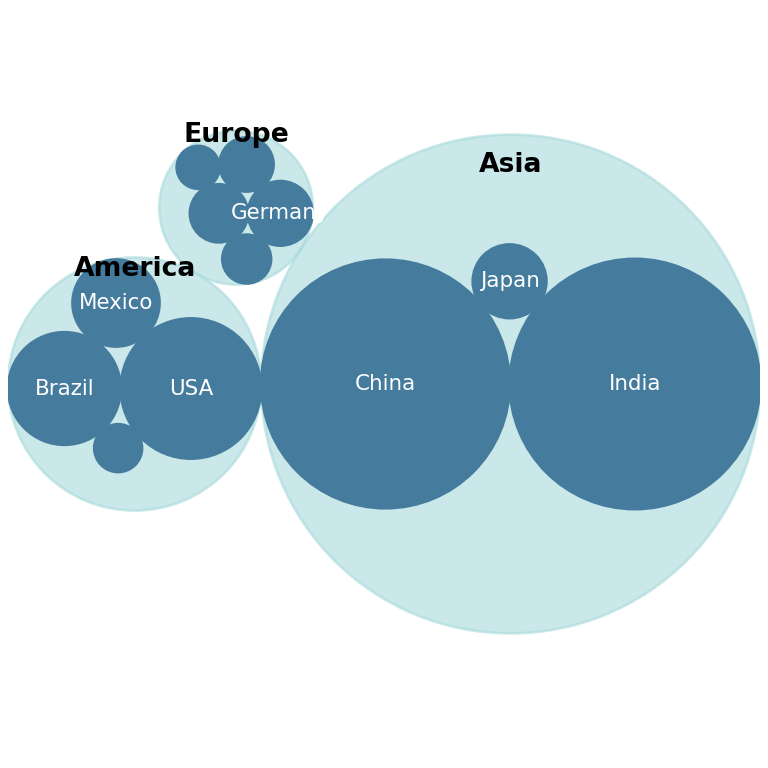
See also how to create a treemap in matplotlib, which represents the same kind of data with rectangles.