Two-set Venn diagram with venn2
A Venn diagram shows the overlap between two or more sets. Matplotlib itself does not provide one, but the matplotlib-venn package (install it with pip install matplotlib-venn) does, built on top of matplotlib. Pass two Python set objects to venn2 and it will compute and draw the overlap automatically.
import matplotlib.pyplot as plt
from matplotlib_venn import venn2

# Data
A = {1, 2, 3, 4, 5, 6}
B = {4, 5, 6, 7, 8}

venn2([A, B])

# plt.show()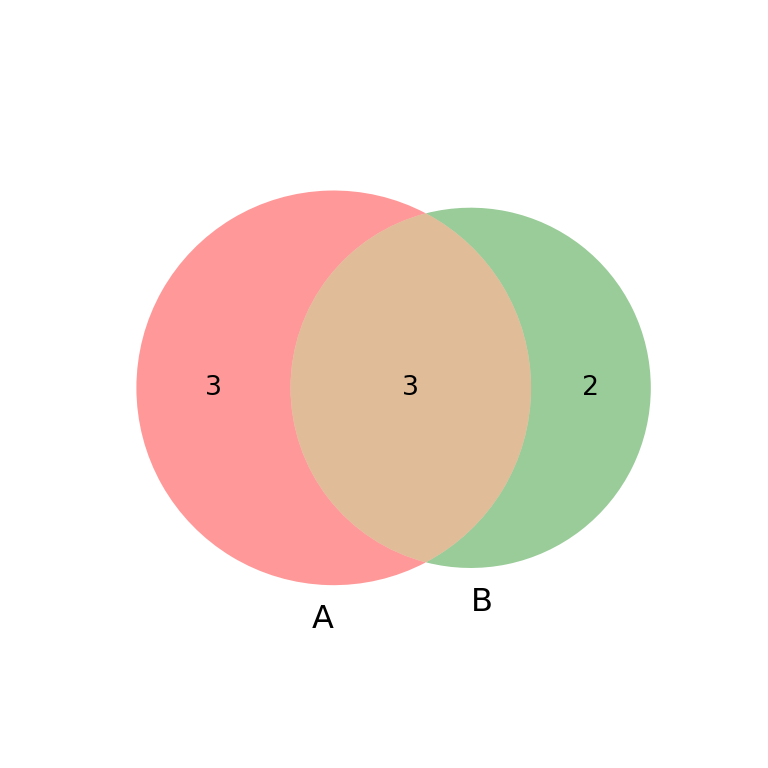
Three-set Venn diagram with venn3
For three sets use venn3 instead, which follows the exact same syntax and also computes every overlap (including the intersection of all three sets) automatically.
import matplotlib.pyplot as plt
from matplotlib_venn import venn3

# Data
A = {1, 2, 3, 4, 5, 6}
B = {4, 5, 6, 7, 8}
C = {3, 4, 9, 10}

venn3([A, B, C])

# plt.show()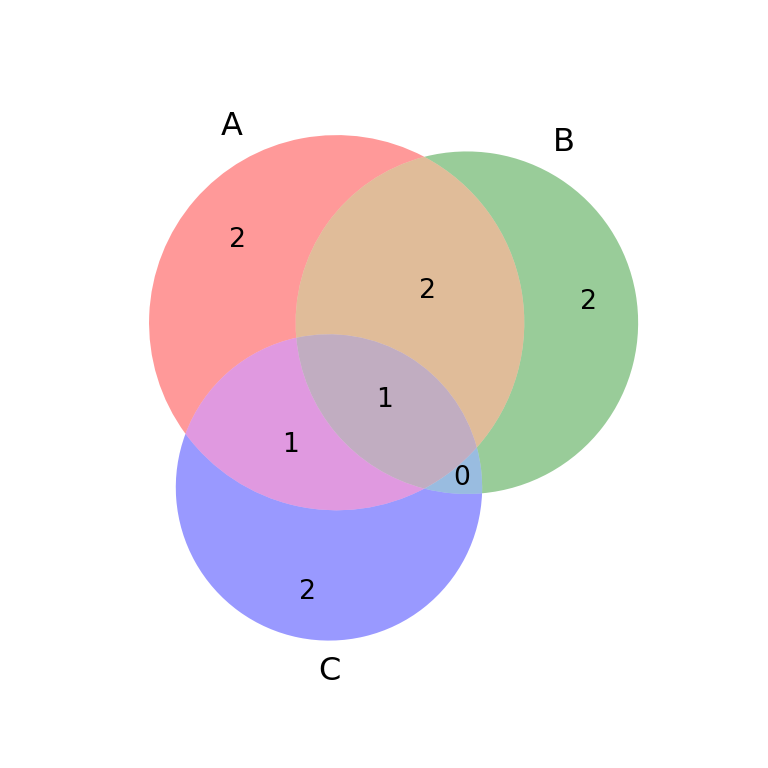
Colors
Customize the fill color of each set with set_colors, and the transparency of the overlaps with alpha.
import matplotlib.pyplot as plt
from matplotlib_venn import venn2

# Data
A = {1, 2, 3, 4, 5, 6}
B = {4, 5, 6, 7, 8}

venn2([A, B],
     set_colors = ("#4C72B0", "#DD8452"),
     alpha = 0.7)

# plt.show()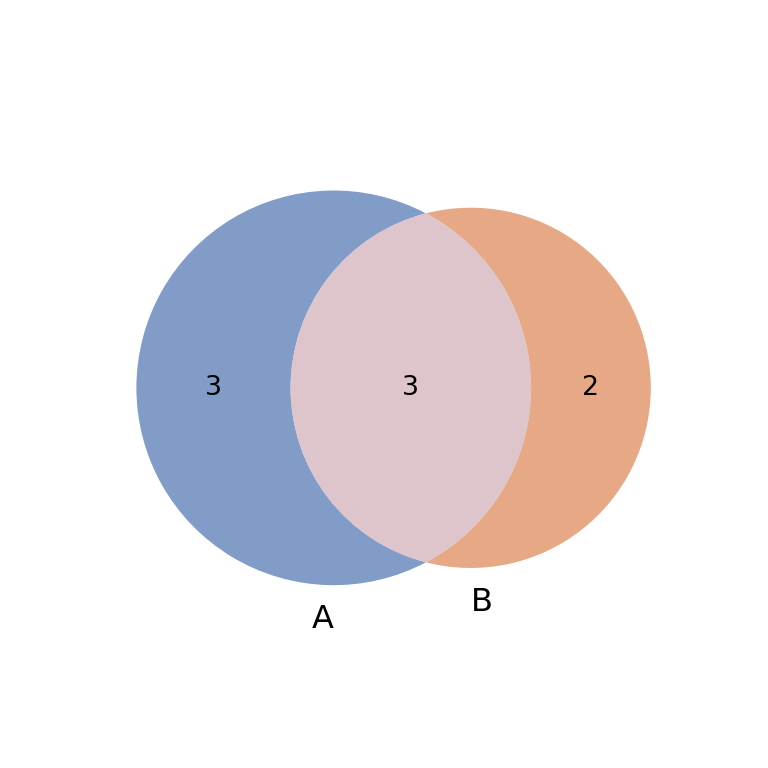
Set labels
The labels next to each circle (A, B by default) are set with set_labels.
import matplotlib.pyplot as plt
from matplotlib_venn import venn2

# Data
A = {1, 2, 3, 4, 5, 6}
B = {4, 5, 6, 7, 8}

venn2([A, B],
     set_labels = ("Customers 2024", "Customers 2025"))

# plt.show()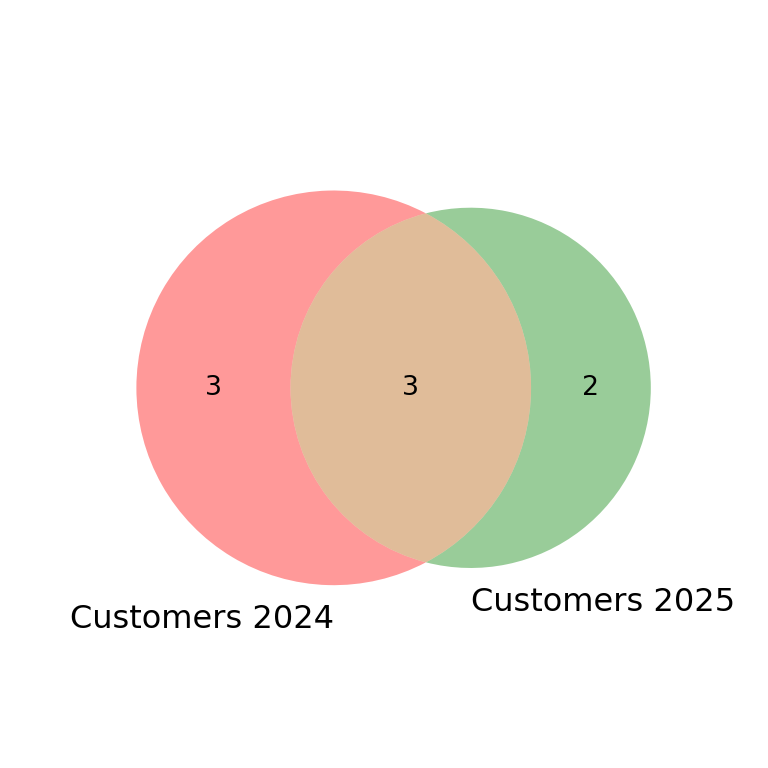
Subset labels
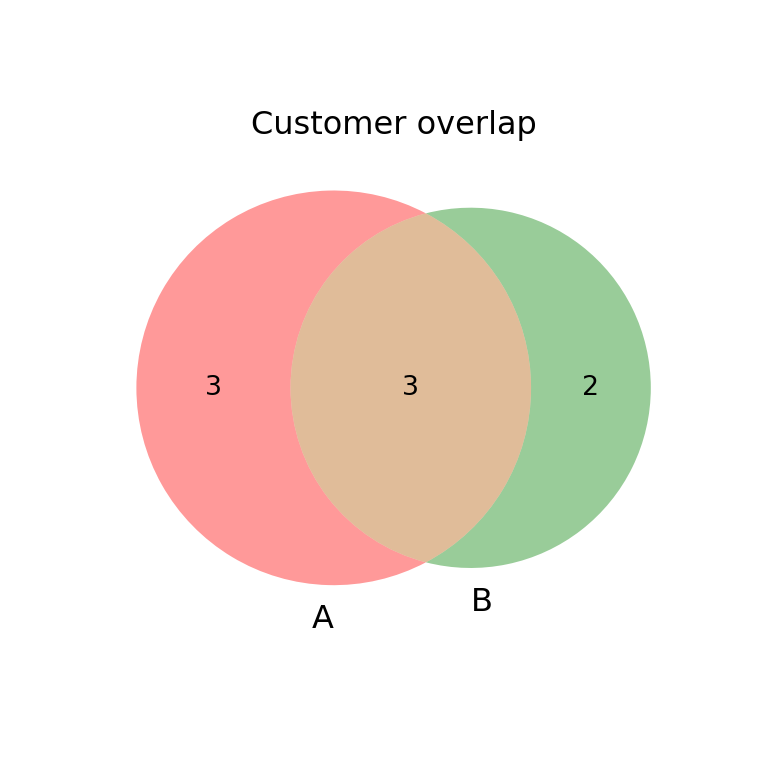
venn2 returns a VennDiagram object. Use get_label_by_id on it to change the text inside any of the three regions (10 for the left-only area, 01 for the right-only area and 11 for the overlap).
import matplotlib.pyplot as plt
from matplotlib_venn import venn2

# Data
A = {1, 2, 3, 4, 5, 6}
B = {4, 5, 6, 7, 8}

v = venn2([A, B])
v.get_label_by_id('10').set_text(len(A - B))
v.get_label_by_id('01').set_text(len(B - A))
v.get_label_by_id('11').set_text(len(A & B))

# plt.show()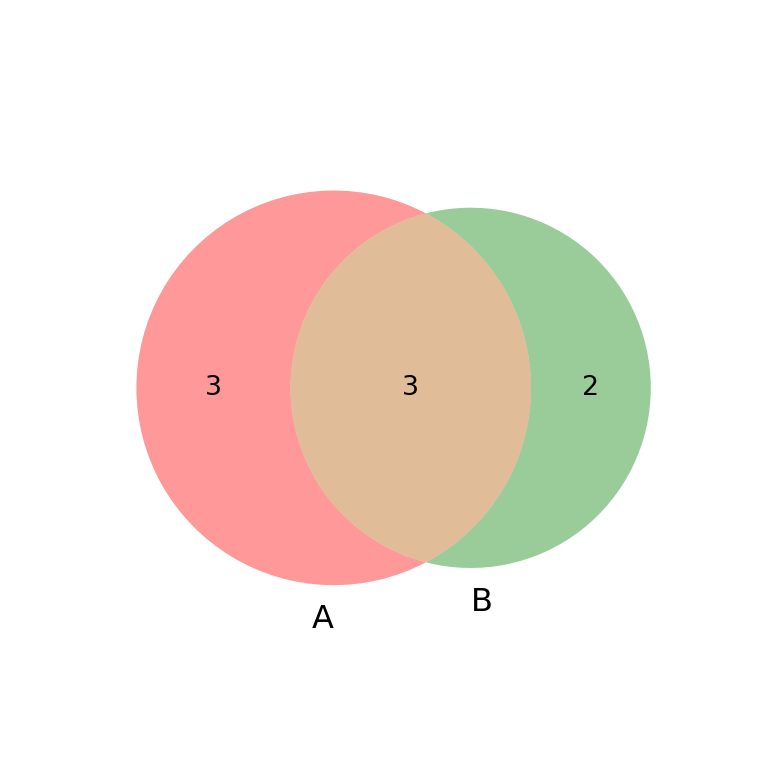
Circle outlines
Add an outline around the circles with venn2_circles (or venn3_circles for three sets), called right after venn2. It returns the circle patches, so you can also style their line width and color.
import matplotlib.pyplot as plt
from matplotlib_venn import venn2, venn2_circles

# Data
A = {1, 2, 3, 4, 5, 6}
B = {4, 5, 6, 7, 8}

venn2([A, B])
venn2_circles([A, B], linewidth = 1.5, color = "gray")

# plt.show()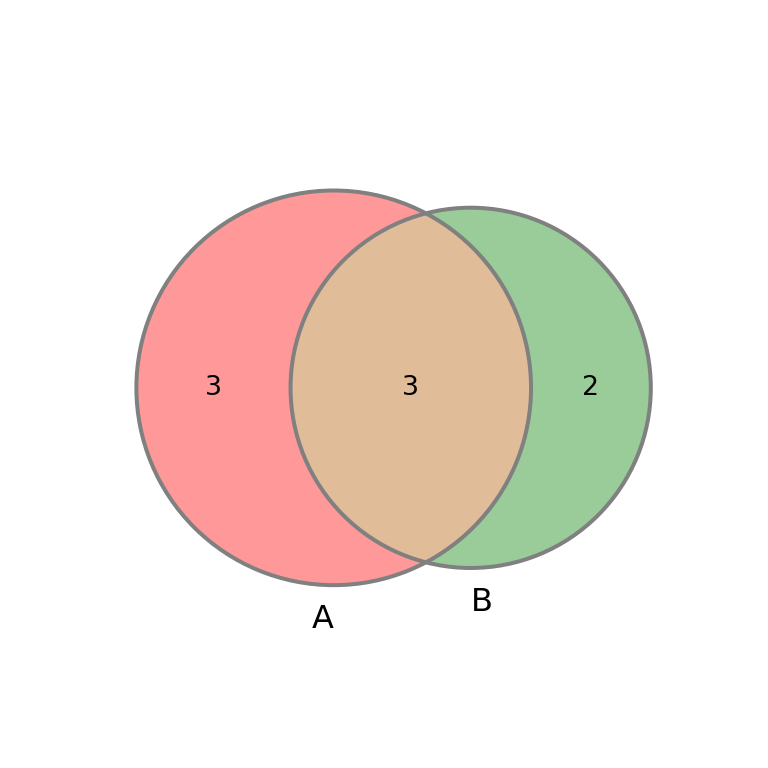
Title
Since venn2 and venn3 plot on the current matplotlib axes, a title can be added the usual way with plt.title.
import matplotlib.pyplot as plt
from matplotlib_venn import venn2

# Data
A = {1, 2, 3, 4, 5, 6}
B = {4, 5, 6, 7, 8}

venn2([A, B])
plt.title("Customer overlap")

# plt.show()