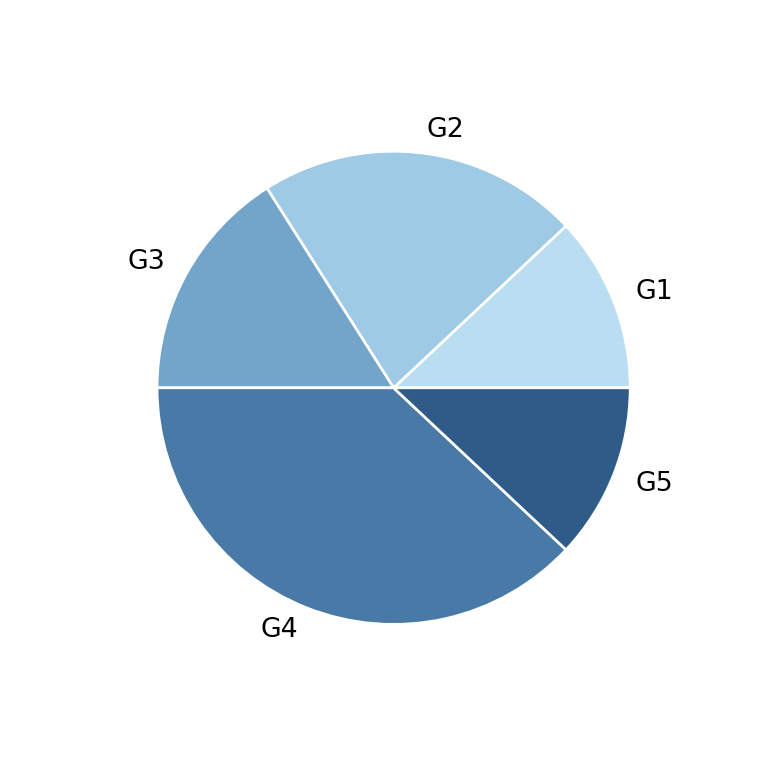
Pie charts represent the proportion of each category over the total. In pandas they are created with plot.pie on a Series, where the index contains the categories and the values their size.
Pie chart with plot.pie
By default pandas uses the name of the Series as label of the Y axis. Set ylabel = "" to remove it.
import pandas as pd
import matplotlib.pyplot as plt

s = pd.Series([45, 25, 20, 10], index = ["Chrome", "Safari", "Edge", "Other"])

s.plot.pie(ylabel = "")
# plt.show()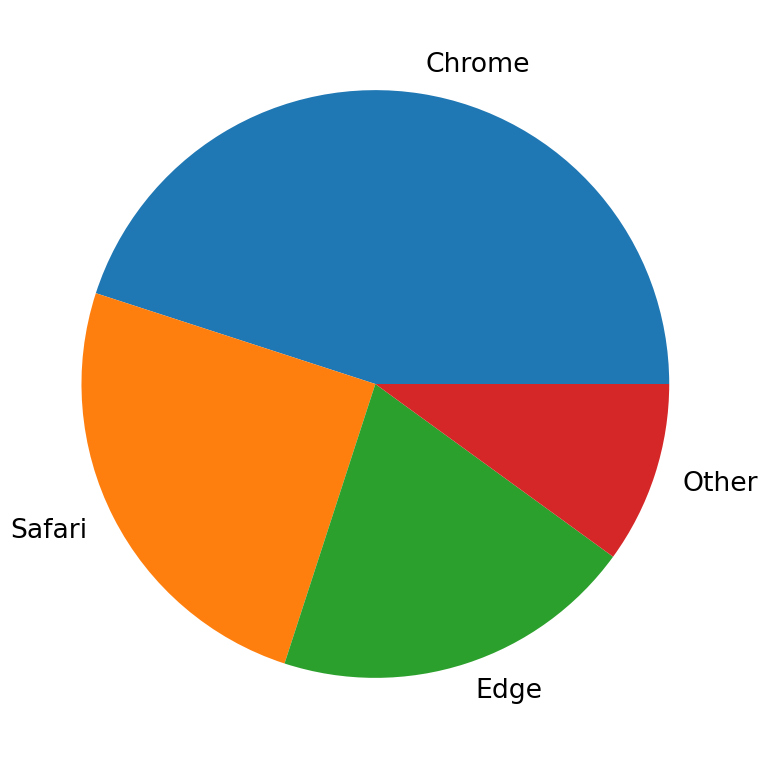
Show the percentages
autopct adds the percentage of each slice using a format string, such as "%1.0f%%" for percentages without decimals.
import pandas as pd
import matplotlib.pyplot as plt

s = pd.Series([45, 25, 20, 10], index = ["Chrome", "Safari", "Edge", "Other"])

s.plot.pie(autopct = "%1.0f%%", ylabel = "")
# plt.show()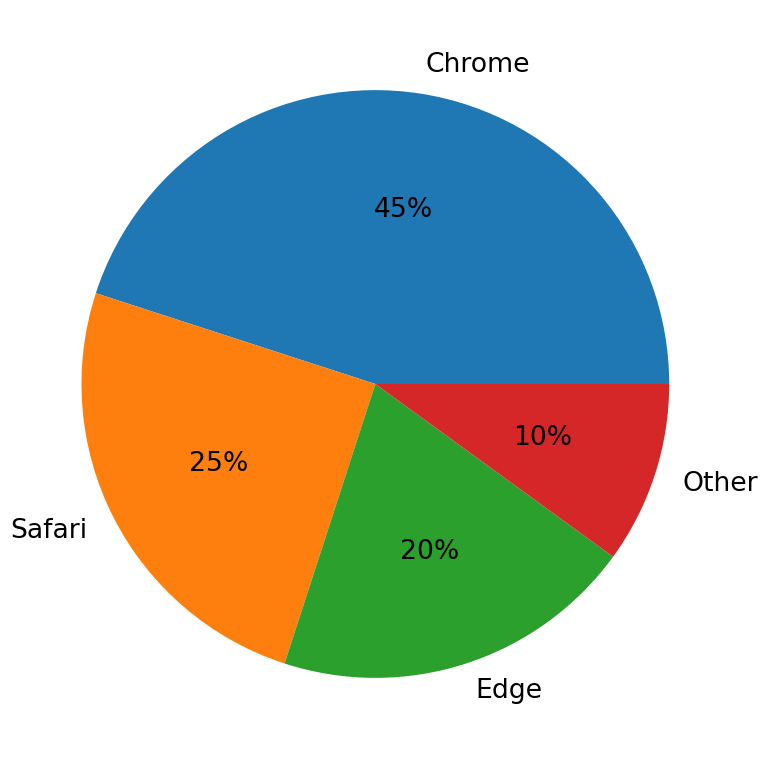
Explode, rotate and colors
explode separates some slices from the center, startangle rotates the chart and colors sets the color of each slice.
import pandas as pd
import matplotlib.pyplot as plt

s = pd.Series([45, 25, 20, 10], index = ["Chrome", "Safari", "Edge", "Other"])

s.plot.pie(explode = [0.1, 0, 0, 0], startangle = 90,
           colors = ["#264653", "#2A9D8F", "#E9C46A", "#E76F51"],
           autopct = "%1.0f%%", ylabel = "")
# plt.show()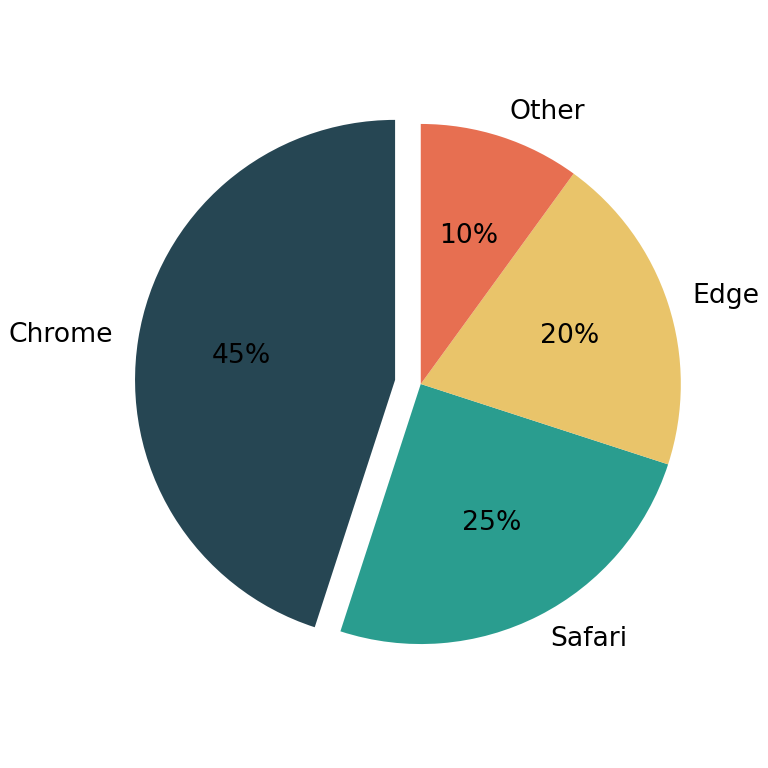
Donut chart
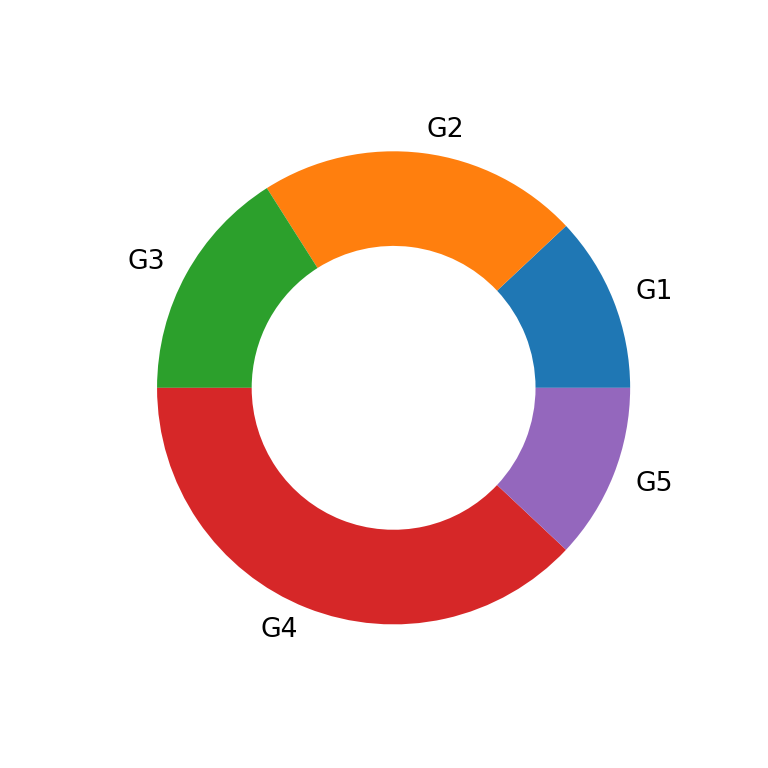
Set a width lower than 1 for the slices with wedgeprops to create a donut chart.
import pandas as pd
import matplotlib.pyplot as plt

s = pd.Series([45, 25, 20, 10], index = ["Chrome", "Safari", "Edge", "Other"])

s.plot.pie(wedgeprops = {"width": 0.4}, ylabel = "")
# plt.show()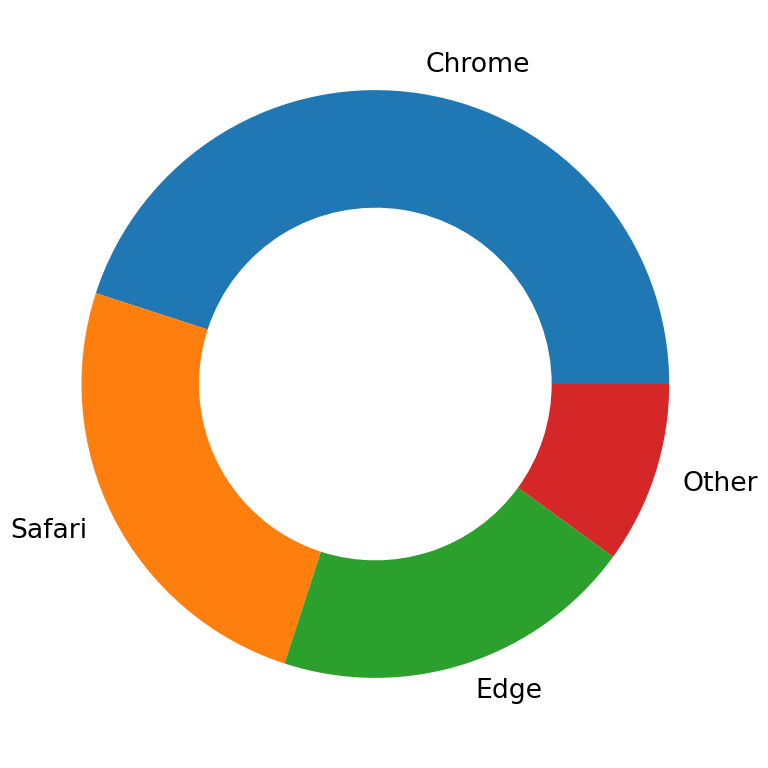
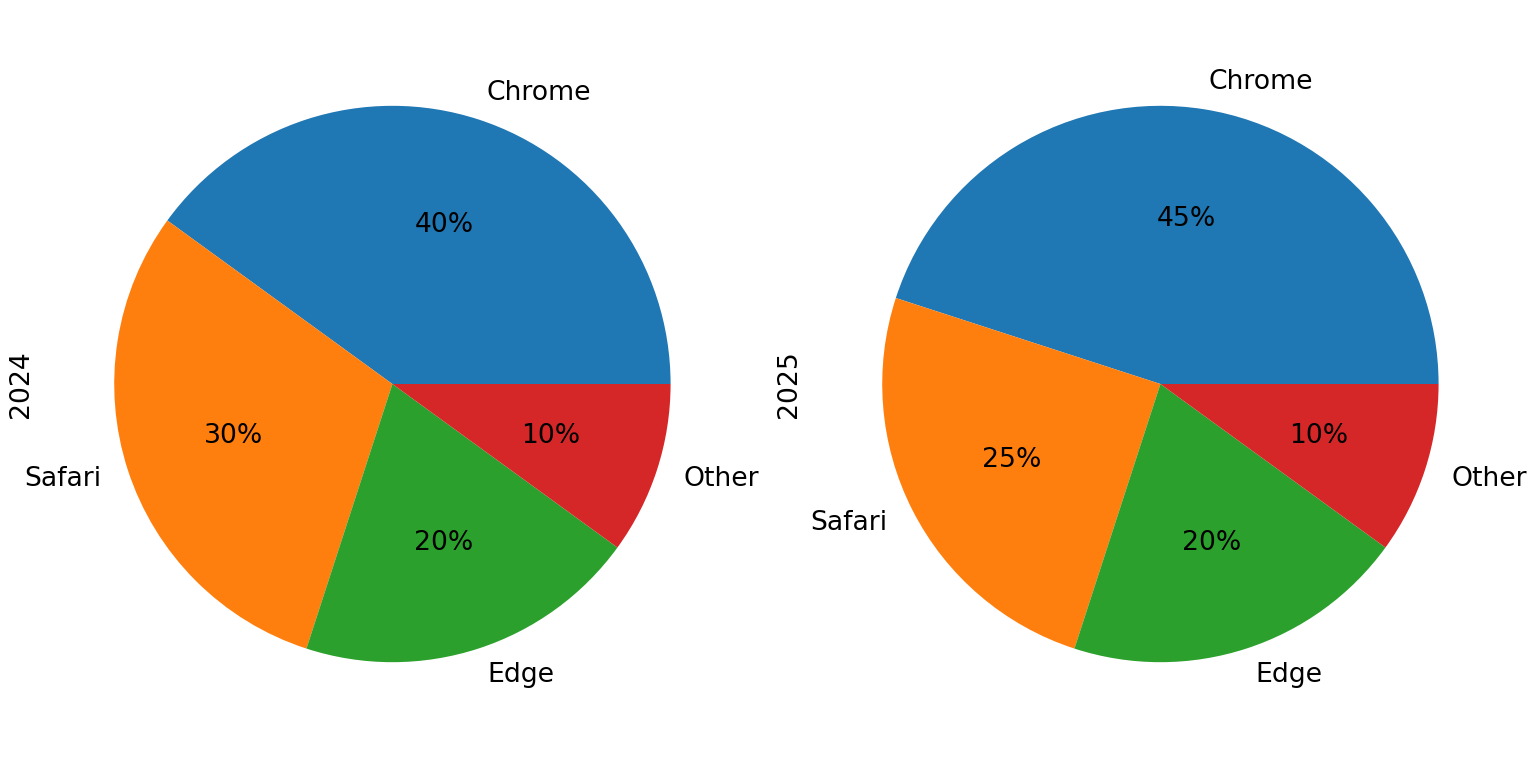
Several pie charts
On a data frame, plot.pie(subplots = True) creates one pie chart for each column.
import pandas as pd
import matplotlib.pyplot as plt

df = pd.DataFrame({"2024": [40, 30, 20, 10], "2025": [45, 25, 20, 10]},
                  index = ["Chrome", "Safari", "Edge", "Other"])

df.plot.pie(subplots = True, figsize = (8, 4), legend = False,
            autopct = "%1.0f%%")
# plt.show()
Learn more about pie charts in matplotlib and donut charts in matplotlib.