Contour lines with the contour function
With matplotlib you can use the contour function to create contour lines. The function needs an (M, N) array representing the height values for the contour (Z) and the coordinates for that values (X and Y).
import numpy as np
import matplotlib.pyplot as plt

# Data
X, Y = np.meshgrid(np.linspace(-5, 10, 100),
                   np.linspace(-5, 10, 100))
Z = np.sqrt(X ** 2 + Y ** 2)

# Contour
fig, ax = plt.subplots()
ax.contour(X, Y, Z)

# plt.show()
The X and Y arguments are optional, but if not specified the range of the axis of the plot will be from 0 to the length of Z.
import numpy as np
import matplotlib.pyplot as plt

# Data
X, Y = np.meshgrid(np.linspace(-5, 10, 100),
                   np.linspace(-5, 10, 100))
Z = np.sqrt(X ** 2 + Y ** 2)

# Contour
fig, ax = plt.subplots()
ax.contour(Z)

# plt.show()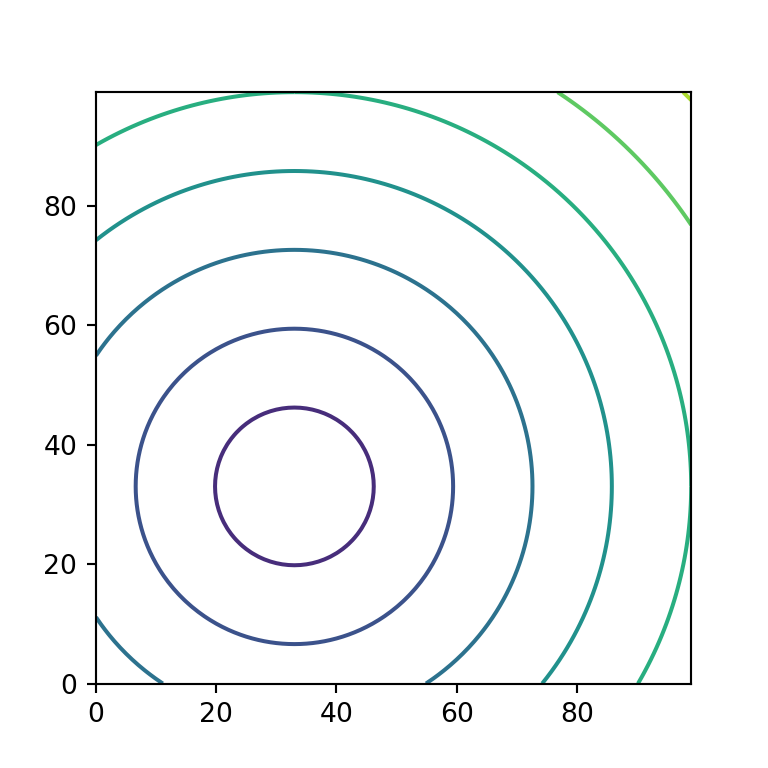
Number of levels
The default number of levels is chosen automatically based on your data, but you can use the levels argument to input an integer and set the number of levels or to input an array of integers in ascending order to specify the levels where to draw contour lines.
import numpy as np
import matplotlib.pyplot as plt

# Data
X, Y = np.meshgrid(np.linspace(-5, 10, 100),
                   np.linspace(-5, 10, 100))
Z = np.sqrt(X ** 2 + Y ** 2)

# Contour
fig, ax = plt.subplots()
ax.contour(X, Y, Z, levels = 50)

# plt.show()
Color of the levels
The contour function uses the viridis color map if none is specified, but the cmap argument allows overriding it with a new color palette.
import numpy as np
import matplotlib.pyplot as plt

# Data
X, Y = np.meshgrid(np.linspace(-5, 10, 100),
                   np.linspace(-5, 10, 100))
Z = np.sqrt(X ** 2 + Y ** 2)

# Contour
fig, ax = plt.subplots()
ax.contour(X, Y, Z, cmap = "Reds")

# plt.show()
Note that other option is to make use of the colors argument to specify a single color or an array of colors for the contour lines. In the second scenario, the array of colors is cycled in ascending order and the colors will be repeated if the number of colors is shorter than the number of levels.
import numpy as np
import matplotlib.pyplot as plt

# Data
X, Y = np.meshgrid(np.linspace(-5, 10, 100),
                   np.linspace(-5, 10, 100))
Z = np.sqrt(X ** 2 + Y ** 2)

# Contour
fig, ax = plt.subplots()
ax.contour(X, Y, Z, colors = ["g", "k", "r"])

# plt.show()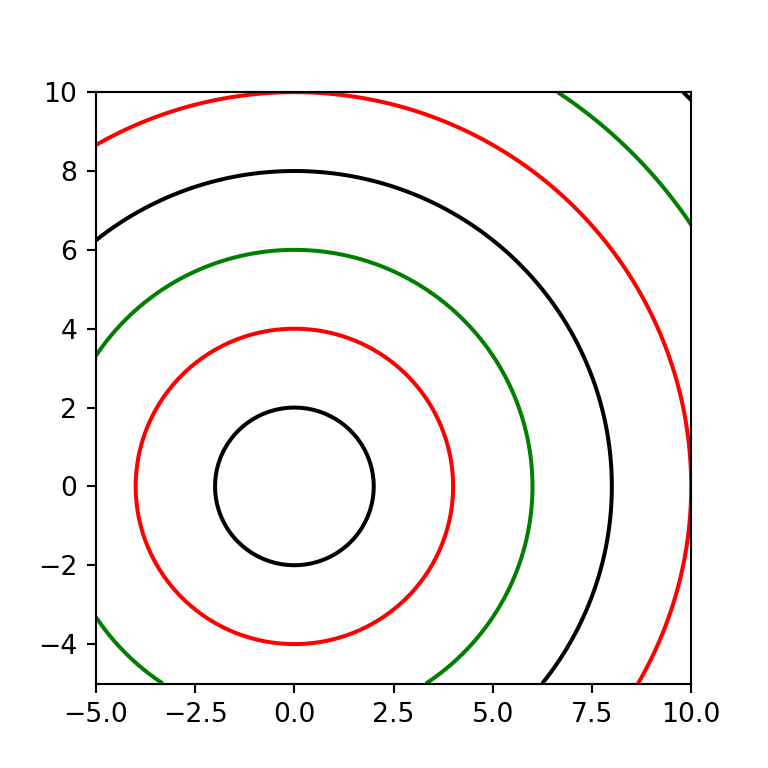
Contour lines style and width
The linestyles and linewidths arguments allows customizing the style and width of the contour lines. Possible line styles are None, "solid", "dashed", "dashdot" and "dotted". Bear in mind that both arguments allow arrays as input that will behave the same way as an array of colors, as stated before.
import numpy as np
import matplotlib.pyplot as plt

# Data
X, Y = np.meshgrid(np.linspace(-5, 10, 100),
                   np.linspace(-5, 10, 100))
Z = np.sqrt(X ** 2 + Y ** 2)

# Contour
fig, ax = plt.subplots()
ax.contour(X, Y, Z, linestyles = "dashed", linewidths = 1)

# plt.show()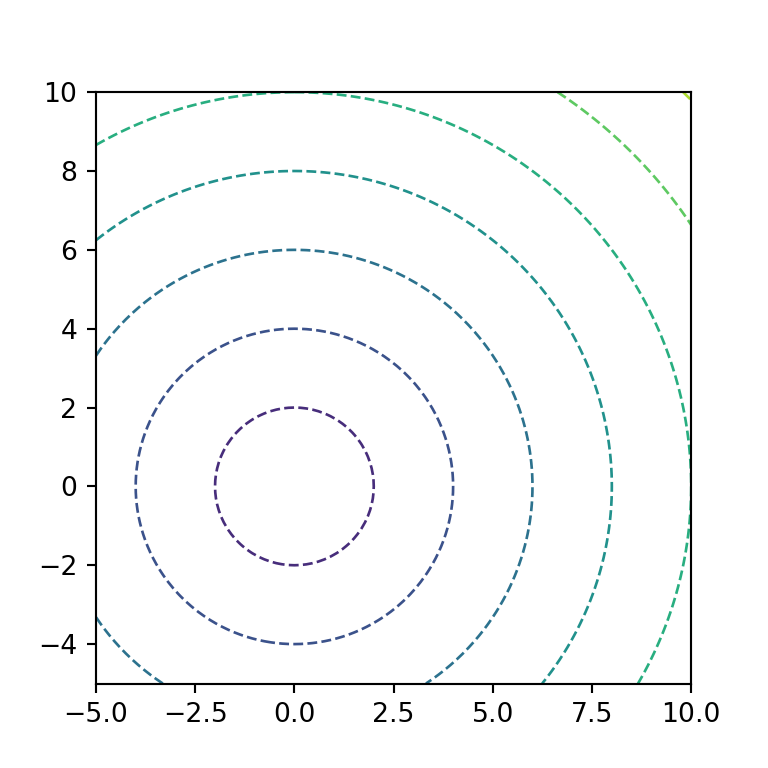
Contour with labels
It is possible to add labels to each contour line making use of the clabel function as in the example below.
import numpy as np
import matplotlib.pyplot as plt

# Data
X, Y = np.meshgrid(np.linspace(-5, 10, 100),
                   np.linspace(-5, 10, 100))
Z = np.sqrt(X ** 2 + Y ** 2)

# Contour
fig, ax = plt.subplots()
cnt = ax.contour(X, Y, Z)
ax.clabel(cnt, cnt.levels, inline = True, fontsize = 10)

# plt.show()
Filled contours with the contourf function
The contourf function is the same as contour, but instead of drawing the contour lines it will fill the area between the levels with colors. The following example is the same as the first of this tutorial but using contourf.

import numpy as np
import matplotlib.pyplot as plt
# Data
X, Y = np.meshgrid(np.linspace(-5, 10, 100),
np.linspace(-5, 10, 100))
Z = np.sqrt(X ** 2 + Y ** 2)
# Filled contour
fig, ax = plt.subplots()
ax.contourf(X, Y, Z)
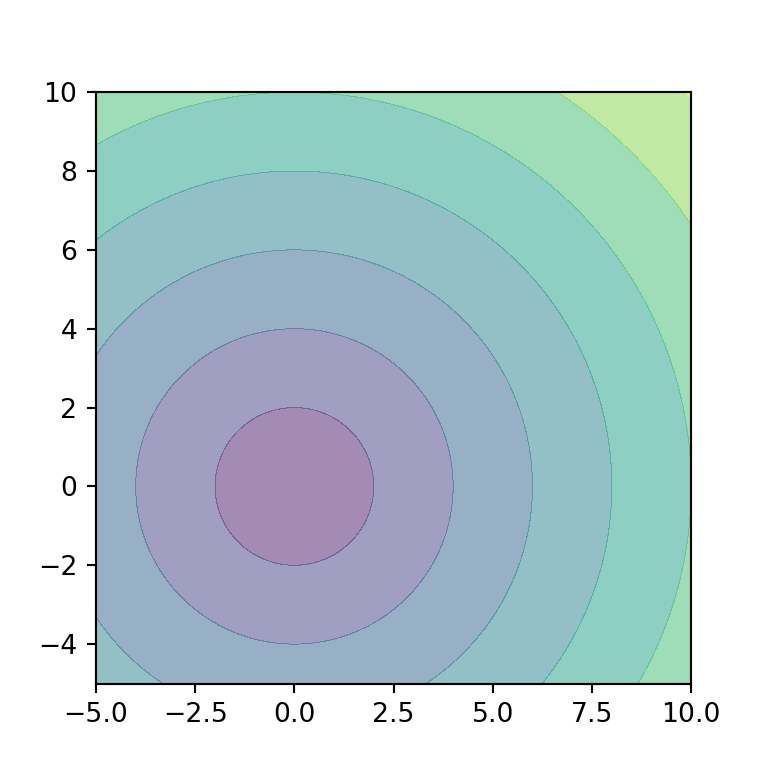
# plt.show()Fill transparency
The alpha argument controls the transparency of the contour. In the following example we are setting a transparency of 0.5.
import numpy as np
import matplotlib.pyplot as plt

# Data
X, Y = np.meshgrid(np.linspace(-5, 10, 100),
                   np.linspace(-5, 10, 100))
Z = np.sqrt(X ** 2 + Y ** 2)

# Filled contour
fig, ax = plt.subplots()
ax.contourf(X, Y, Z, alpha = 0.5)

# plt.show()
Filled contour with lines
It should be noted that you can use both the contour and contourf functions to create a filled contour plot with contour lines.

import numpy as np
import matplotlib.pyplot as plt

# Data
X, Y = np.meshgrid(np.linspace(-5, 10, 100),
                   np.linspace(-5, 10, 100))
Z = np.sqrt(X ** 2 + Y ** 2)

# Filled contour with lines
fig, ax = plt.subplots()
ax.contour(X, Y, Z, colors = "k")
ax.contourf(X, Y, Z, alpha = 0.75)

# plt.show()
Filled contour with lines and labels
In addition, you can also add the labels to the contour lines with the clabel function, as in the example of the previous section.

import numpy as np
import matplotlib.pyplot as plt

# Data
X, Y = np.meshgrid(np.linspace(-5, 10, 100),
                   np.linspace(-5, 10, 100))
Z = np.sqrt(X ** 2 + Y ** 2)

# Filled contour with labels
fig, ax = plt.subplots()
cnt = ax.contour(X, Y, Z, colors = "k", linewidths = 0.5)
ax.clabel(cnt, cnt.levels, inline = True, fontsize = 10)
ax.contourf(X, Y, Z)

# plt.show()
Fill color
The color for each level can be customized the same way as with the contour function. You will need to input a color or an array of colors to colors or set a color palette with cmap.

import numpy as np
import matplotlib.pyplot as plt

# Data
X, Y = np.meshgrid(np.linspace(-5, 10, 100),
                   np.linspace(-5, 10, 100))
Z = np.sqrt(X ** 2 + Y ** 2)

# Filled contour
fig, ax = plt.subplots()
ax.contourf(X, Y, Z, cmap = "plasma")

# plt.show()
Filled contour with color bar
Finally, if you want to add a color bar as a legend to the filled contour you can use the colorbar function as shown below. This will make easier to read the levels of the contour.

import numpy as np
import matplotlib.pyplot as plt

# Data
X, Y = np.meshgrid(np.linspace(-5, 10, 100),
                   np.linspace(-5, 10, 100))
Z = np.sqrt(X ** 2 + Y ** 2)

# Filled contour
fig, ax = plt.subplots()
cnt = ax.contourf(X, Y, Z)

# Color bar
cbar = ax.figure.colorbar(cnt, ax = ax)
cbar.ax.set_ylabel("Color bar title", rotation = -90, va = "bottom")

# plt.show()


