Hierarchically-clustered heatmap with clustermap
The clustermap function is very similar to the heatmap function. The main difference is that clustermap will also make and represent a hierarchically-cluster of the rows and the columns of the data.
import numpy as np
import seaborn as sns

# Data simulation
np.random.seed(2)
data = np.random.rand(6, 6)

sns.clustermap(data)
Standardize the data
Note that you can standardize the data by rows (0) or by columns (1) with the standard_scale argument of the function.
import numpy as np
import seaborn as sns

# Data simulation
np.random.seed(2)
data = np.random.rand(6, 6)

sns.clustermap(data, standard_scale = 1)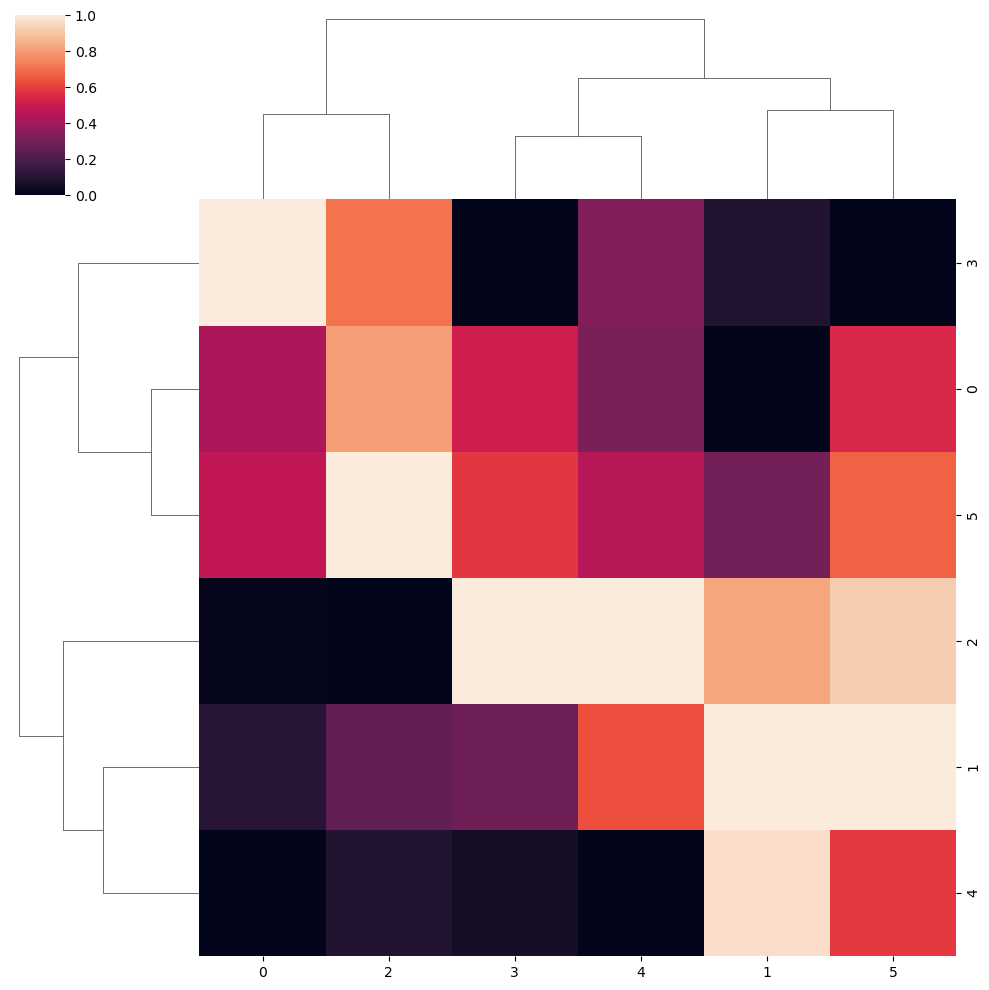
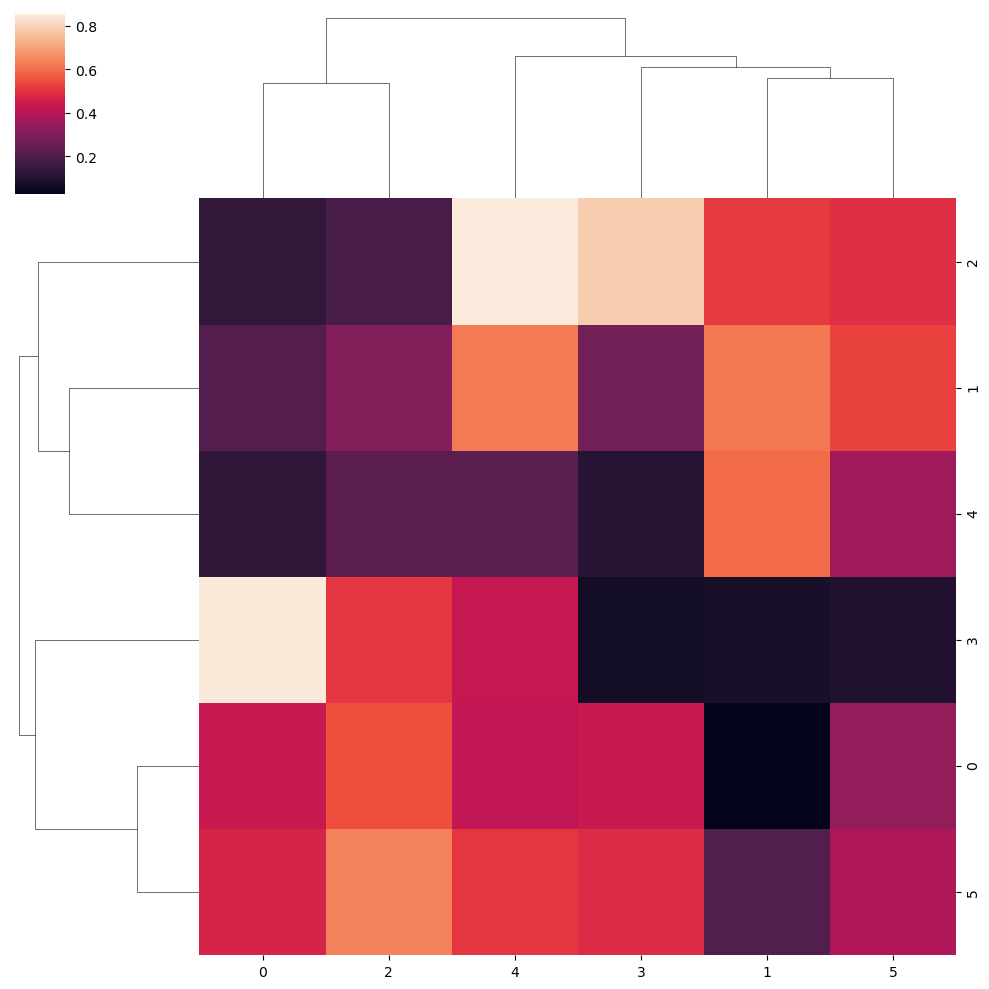
Normalize the data
Similarly, you can also normalize the data within rows (0) or within columns (1) with the z_score argument.
import numpy as np
import seaborn as sns

# Data simulation
np.random.seed(2)
data = np.random.rand(6, 6)

sns.clustermap(data, z_score = 1)
Figure size
Note that you can customize the size of the figure passing a vector of sizes to figsize, where the first represents the width and the second the height of the figure. In addition, you can set the relative size of the dendrogram respect to the whole plot with dendrogram_ratio.
import numpy as np
import seaborn as sns

# Data simulation
np.random.seed(2)
data = np.random.rand(6, 6)

sns.clustermap(data,
              figsize = (8, 6), # Figure sizes
              dendrogram_ratio = 0.1) # Size proportion of the dendrograms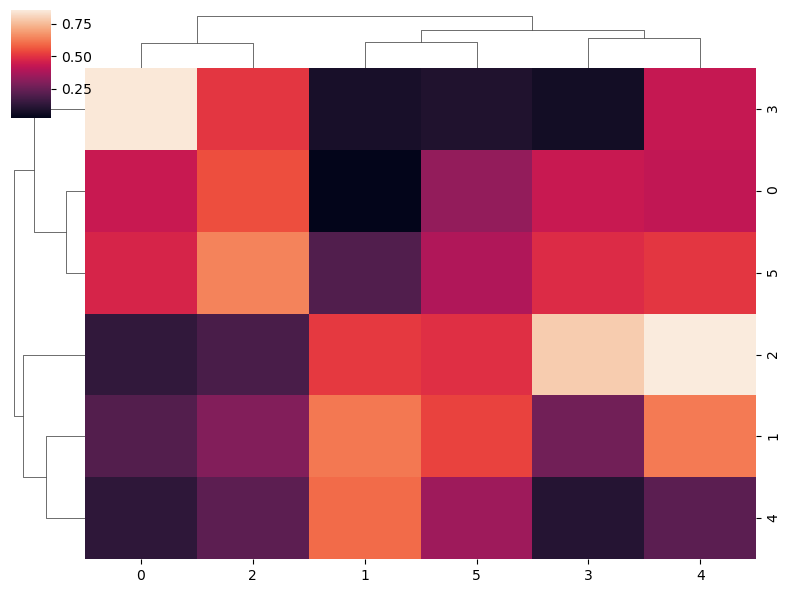
Clustering method
The method used to compute the hierarchical clustering can be selected with the method argument. Possible options are "single", "complete", "average" (default) "weighted", "centroid", "median" and "ward". In the following blocks of code you can see a couple of examples. See this reference for additional details of each method.
“Single” clustering method
import numpy as np
import seaborn as sns

# Data simulation
np.random.seed(2)
data = np.random.rand(6, 6)

sns.clustermap(data, method = "single")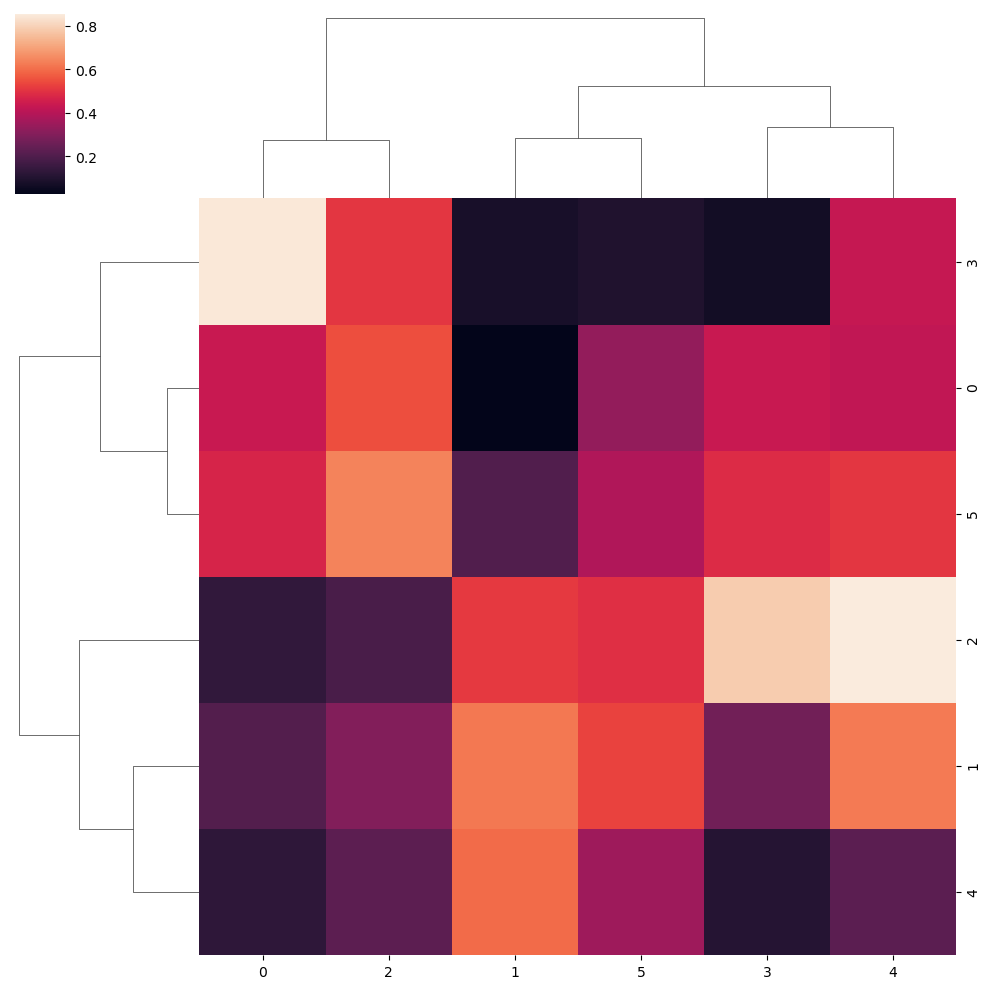
Ward clustering method
import numpy as np
import seaborn as sns

# Data simulation
np.random.seed(2)
data = np.random.rand(6, 6)

sns.clustermap(data, method = "ward")
Distance metric
The distance metric is the metric used to compute the pairwise distance between observations. Possible metrics are "braycurtis", "canberra", "chebyshev", "cityblock", "correlation", "cosine", "dice", "euclidean" (default), "hamming", "jaccard", "jensenshannon", "kulsinski", "mahalanobis", "matching", "minkowski", "rogerstanimoto", "russellrao", "seuclidean", "sokalmichener", "sokalsneath", "sqeuclidean" and "yule". You will find more info about each metric in the following link.
Canberra metric
import numpy as np
import seaborn as sns

# Data simulation
np.random.seed(2)
data = np.random.rand(6, 6)

sns.clustermap(data, metric = "canberra")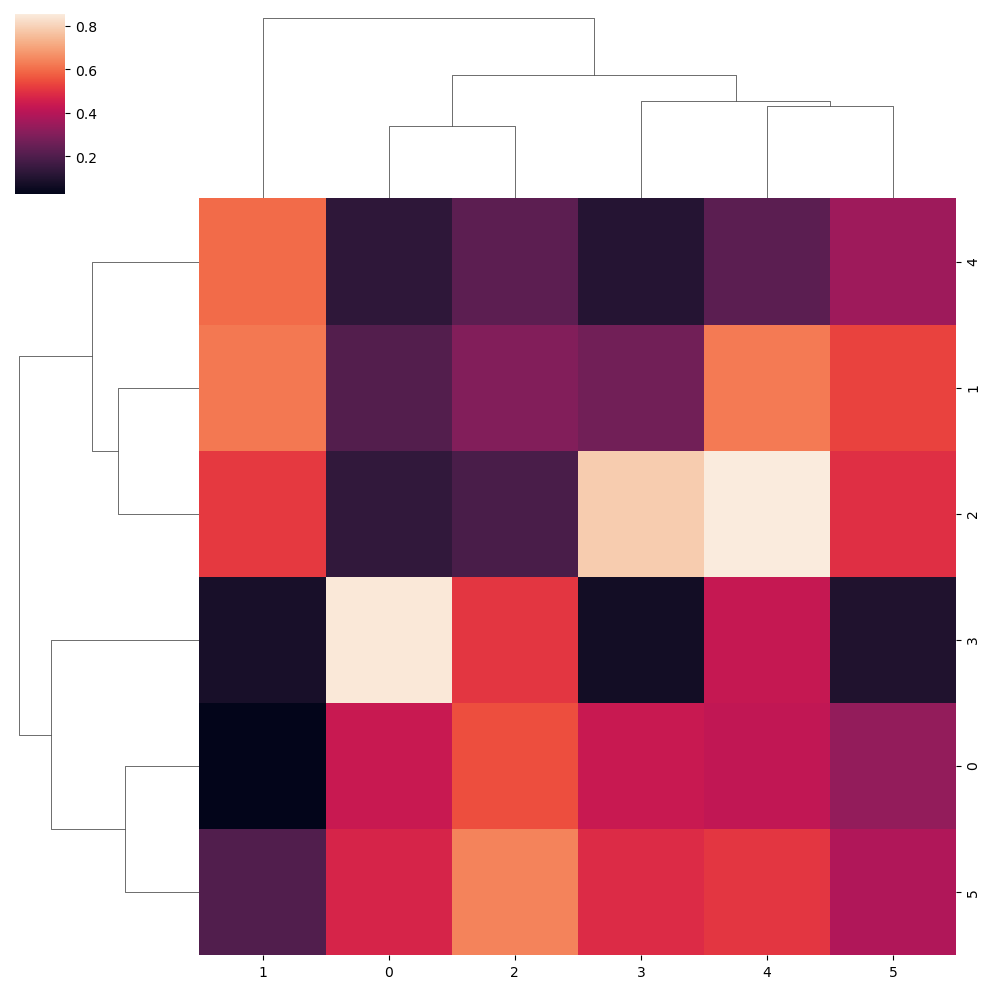
Color customization

Color palette
The cmap argument can be used to change the color palette of the clustering heat map.
import numpy as np
import seaborn as sns

# Data simulation
np.random.seed(2)
data = np.random.rand(6, 6)

sns.clustermap(data, cmap = "vlag")
Limits of the color range
Note that you can change the limits of the color range with vmin and vmax.
import numpy as np
import seaborn as sns

# Data simulation
np.random.seed(2)
data = np.random.rand(6, 6)

sns.clustermap(data, cmap = "mako",
               vmin = -1, vmax = 1)


