Sample data
Consider the following data for illustration purposes:
import numpy as np

# Seed
rng = np.random.RandomState(0)

# Data simulation
x = rng.uniform(0, 1, 500)
y = 5 * x + rng.normal(0, 2, size = 500)
group = np.where(x < 0.4, "A", np.where(x > 0.8, "C", "B"))
x = x + rng.uniform(-0.2, 0.2, 500)

# Data set
df = {'x': x, 'y': y, 'group': group}
Scatter plot with the scatterplot function
In order to create a scatter plot in Python with seaborn you can use the scatterplot or relplot functions. There are several options to input your data: you can pass your arrays for the X and Y axis to the x and y arguments, you can pass a data set to the data argument and set the keys or you can pass a data frame to data in a wide format. The markers of the plot will be blue by default.
import seaborn as sns

sns.scatterplot(x = x, y = y)

# Equivalent to:
sns.scatterplot(x = "x", y = "y", data = df)

# Equivalent to:
sns.relplot(x = x, y = y)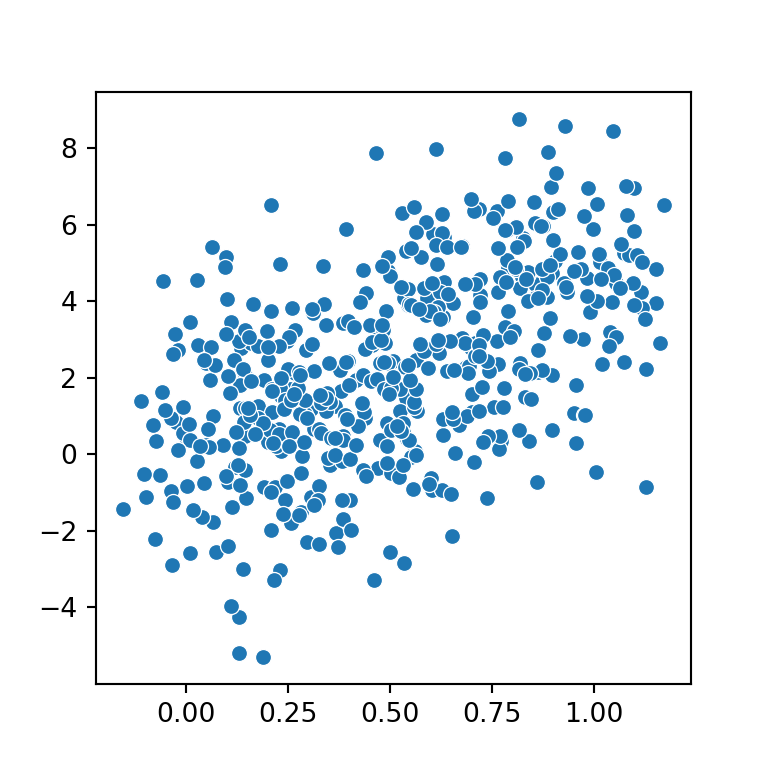
Color customization

Markers color
In case you want to override the default markers color you can specify a new color with the color argument of the plotting function.
import seaborn as sns

sns.scatterplot(x = x, y = y,
                color = "green")
Color of the edges
Note that you can also modify the border color of the markers with edgecolor, which defaults to white. In case you want to remove the borders set edgecolor = "none", edgecolor = None or linewidth = 0.
import seaborn as sns

sns.scatterplot(x = x, y = y,
                edgecolor = "black")
Transparency
The alpha argument of the function controls the transparency of the markers. This is very useful when there are a lot of markers together, so you will be able to see the high-density regions.
import seaborn as sns

sns.scatterplot(x = x, y = y,
                alpha = 0.25)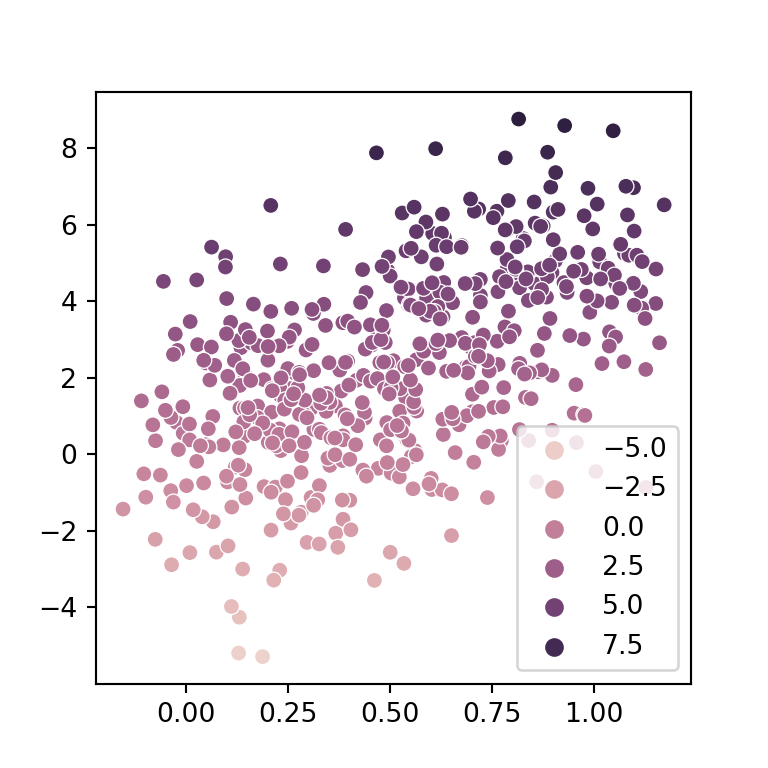
Color based on value
If you pass a variable to the hue argument of the scatterplot function the markers of the plot will be colored based on that variable.
import seaborn as sns

sns.scatterplot(x = x, y = y,
                hue = y)
Shape and size of the markers
Markers size
Depending on your data you will need to modify the size of the markers. For instance, if you have lots of data points you might consider reducing the size of the markers with the size argument.
import seaborn as sns

sns.scatterplot(x = x, y = y,
                size = 1, legend = False)
Markers shape
By default, the markers are circles, but you can select between a variety of shapes using marker. For example, when passing "s" the markers will be squares.
import seaborn as sns

sns.scatterplot(x = x, y = y,
                marker = "s")
Size of the markers based on value
The size argument also allows a variable as input. In this scenario, the size of the markers will be based on the values of that variable.
import seaborn as sns

sns.scatterplot(x = x, y = y,
                size = y,
                hue = y)


