The hexbin function in matplotlib
A hex bin chart is a 2D hexagonal binning plot of points which are an alternative of scatter plots when there are too many data points. In matplotlib, there exists a function named hexbin which allows creating this type of charts.
import numpy as np
import matplotlib.pyplot as plt

# Seed for reproducibility
np.random.seed(8)

# Data simulation
x = np.random.normal(0, 1, 1000000)
y = 3 * x + 5 * np.random.normal(0, 1, 1000000)

# Hexbin chart
fig, ax = plt.subplots()
ax.hexbin(x = x, y = y)
plt.show()
Grid size
The default number of hexagons of the axis is 100, but if you pass an int to the gridsize argument you can change the number of hexagons for the X-axis, while the number of hexagons of the Y-axis will be chosen automatically.
import numpy as np
import matplotlib.pyplot as plt

# Seed for reproducibility
np.random.seed(8)

# Data simulation
x = np.random.normal(0, 1, 1000000)
y = 3 * x + 5 * np.random.normal(0, 1, 1000000)

# Hexbin chart
fig, ax = plt.subplots()
ax.hexbin(x = x, y = y, gridsize = 15)
# plt.show()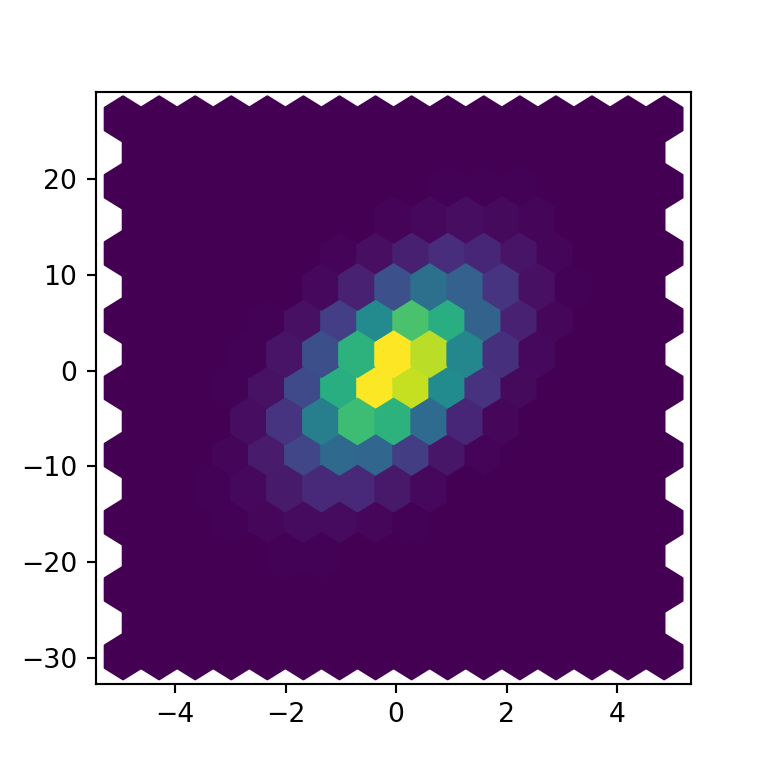
However, you can also input an array of grid sizes of length two where the first element will be the number of hexagons of the X-axis while the second will be the number for the Y-axis.
import numpy as np
import matplotlib.pyplot as plt

# Seed for reproducibility
np.random.seed(8)

# Data simulation
x = np.random.normal(0, 1, 1000000)
y = 3 * x + 5 * np.random.normal(0, 1, 1000000)

# Hexbin chart
fig, ax = plt.subplots()
ax.hexbin(x = x, y = y, gridsize = [15, 30])
# plt.show()
Bins
When creating a hexbin plot, the fill color of each hexagon corresponds to its value, but if you want to use a logarithmic scale for the color palette you can set the bins argument to "log".
import numpy as np
import matplotlib.pyplot as plt

# Seed for reproducibility
np.random.seed(8)

# Data simulation
x = np.random.normal(0, 1, 1000000)
y = 3 * x + 5 * np.random.normal(0, 1, 1000000)

# Hexbin chart
fig, ax = plt.subplots()
ax.hexbin(x = x, y = y, bins = "log")
# plt.show()
Note that you can also pass an integer to the argument. In this scenario the hexagons will be divided in as many categories as the number of specified bins. In the following example we are setting bins = 5, so the hexbin graph will only have five different bins and hence five different colors.
import numpy as np
import matplotlib.pyplot as plt

# Seed for reproducibility
np.random.seed(8)

# Data simulation
x = np.random.normal(0, 1, 1000000)
y = 3 * x + 5 * np.random.normal(0, 1, 1000000)

# Hexbin chart
fig, ax = plt.subplots()
ax.hexbin(x = x, y = y, bins = 5)
# plt.show()
Color customization
Transparency
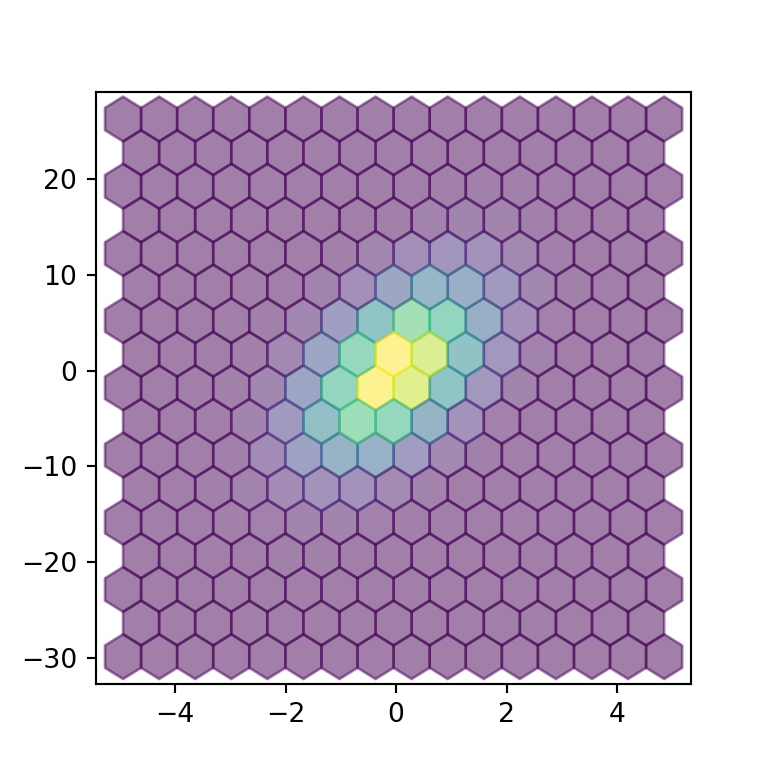
The alpha argument can be used to increase the transparency of the fill color of the hexagons. This can be useful for better visualization of the border of the hexagons when the color palette is too dark.
import numpy as np
import matplotlib.pyplot as plt

# Seed for reproducibility
np.random.seed(8)

# Data simulation
x = np.random.normal(0, 1, 1000000)
y = 3 * x + 5 * np.random.normal(0, 1, 1000000)

# Hexbin chart
fig, ax = plt.subplots()
ax.hexbin(x = x, y = y, gridsize = 15, alpha = 0.5)
# plt.show()
Border color and width
An alternative is to change the border color and width of the hexagons with the edgecolor and linewidths arguments, respectively.

import numpy as np
import matplotlib.pyplot as plt

# Seed for reproducibility
np.random.seed(8)

# Data simulation
x = np.random.normal(0, 1, 1000000)
y = 3 * x + 5 * np.random.normal(0, 1, 1000000)

# Hexbin chart
fig, ax = plt.subplots()
ax.hexbin(x = x, y = y, gridsize = 15,
          edgecolor = "white", linewidths = 1.5)
# plt.show()
Color palette
Finally, you can also change the default color palette with the cmap argument. In the example below we are setting the "magma" color palette.

import numpy as np
import matplotlib.pyplot as plt

# Seed for reproducibility
np.random.seed(8)

# Data simulation
x = np.random.normal(0, 1, 1000000)
y = 3 * x + 5 * np.random.normal(0, 1, 1000000)

# Hexbin chart
fig, ax = plt.subplots()
ax.hexbin(x = x, y = y, gridsize = 20, bins = "log",
          cmap = "magma")
# plt.show()


