Heatmap in seaborn with heatmap
The heatmap function allows creating heat maps or correlations plots in Python with seaborn. You can pass a 2D data set or a pandas dataframe. In case you provide a pandas data frame the row and column names will be used to label the plot axes.
import numpy as np
import seaborn as sns

# Data simulation
np.random.seed(1)
data = np.random.rand(10, 10)

sns.heatmap(data)
Squared tiles
Note that depending on the number of rows and columns and the size of the plot the tiles of the heat map could be non-square. If you want to fix the aspect ratio of the tiles set the argument square to True.
import numpy as np
import seaborn as sns

# Data simulation
np.random.seed(1)
data = np.random.rand(10, 10)

sns.heatmap(data, square = True)
Border
You can also add a border for the tiles setting the width of the lines with linewidths, which defaults to 0. The default color will be white, but you can override it with linecolor.
import numpy as np
import seaborn as sns

# Data simulation
np.random.seed(1)
data = np.random.rand(10, 10)

sns.heatmap(data,
            linewidths = 0.75,
            linecolor = "white") # Default color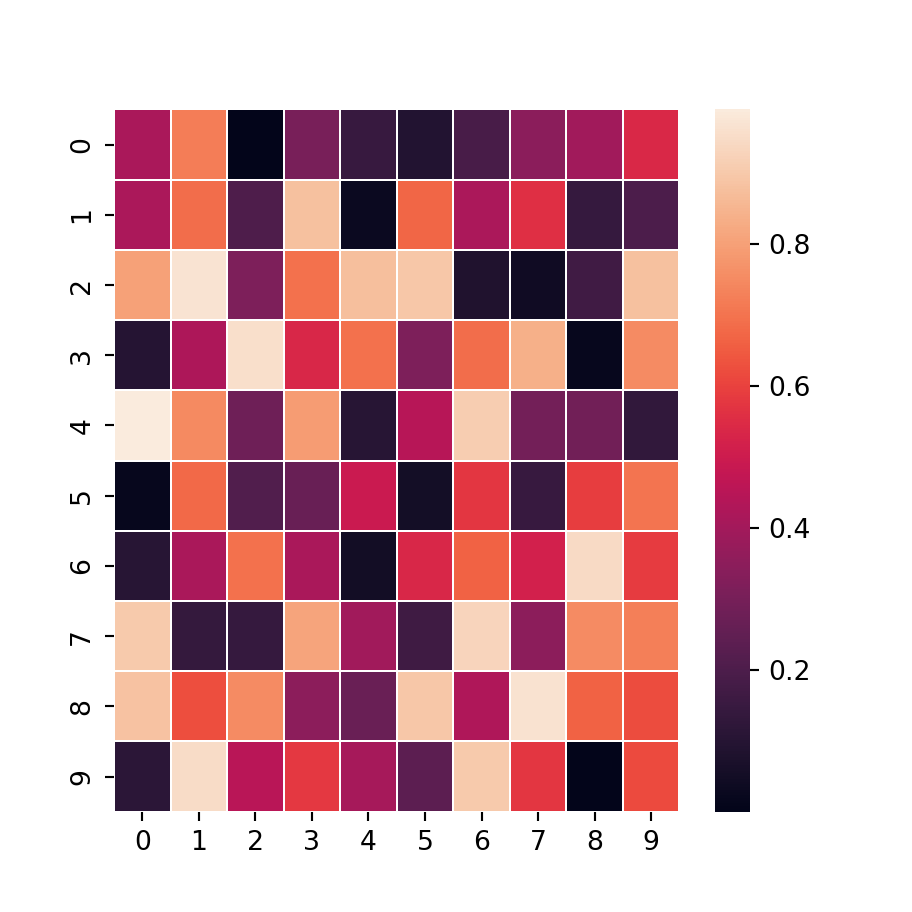
Annotations
In addition, it is possible to add the values for each cell with annot = True. If you need to change the size or other styling of the texts you can pass a dictionary to annot_kws, as in the example below.
import numpy as np
import seaborn as sns

# Data simulation
np.random.seed(1)
data = np.random.rand(10, 10)

sns.heatmap(data,
            annot = True,
            annot_kws = {'size': 6}) # Additional arguments
Color bar
Note that you can remove the color bar (the legend) if desired setting cbar = False, customize it passing a dictionary to cbar_kws or change the lower and upper limits of the bar with vmin and vmax, respectively.
import numpy as np
import seaborn as sns

# Data simulation
np.random.seed(1)
data = np.random.rand(10, 10)

sns.heatmap(data,
            cbar = False)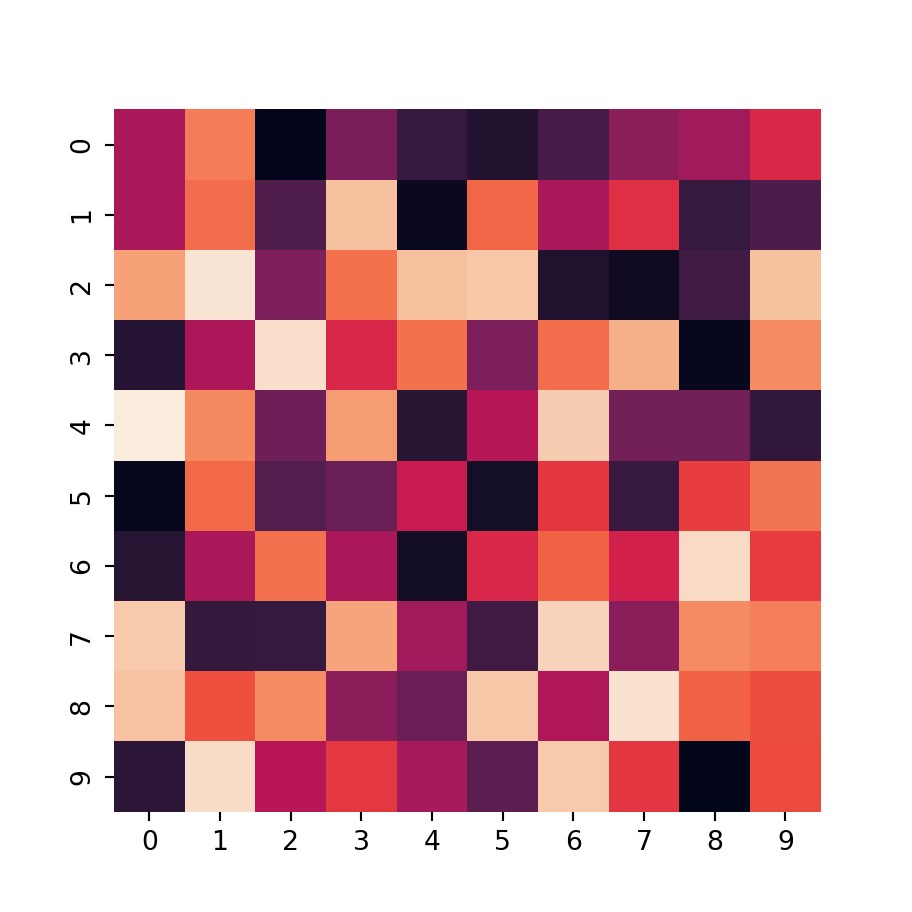
Remove the axis labels
Setting the xticklabels and yticklabels arguments to False the labels for the X and Y axis will be deleted, respectively.
import numpy as np
import seaborn as sns

# Data simulation
np.random.seed(1)
data = np.random.rand(10, 10)

sns.heatmap(data,
            xticklabels = False, yticklabels = False)
Color customization
The colors of a heat map can be customized in two ways: you can create a diverging color palette setting a center value with center or changing the color palette with cmap, as shown in the following examples.

Diverging color palette
import numpy as np
import seaborn as sns

# Data simulation
np.random.seed(1)
data = np.random.rand(10, 10)

sns.heatmap(data,
            center = 0.5)
Change the color palette
import numpy as np
import seaborn as sns

# Data simulation
np.random.seed(1)
data = np.random.rand(10, 10)

sns.heatmap(data,
            cmap = "Blues")


