Sometimes the best way to show data is a table. matplotlib can draw tables with ax.table, which is useful to include them in a figure next to a chart or to export them as an image. The examples show the standings of a football league.
Creating a table with ax.table
Pass the content of the cells to cellText and the header to colLabels. Hide the axes with ax.axis("off") to show only the table.
import matplotlib.pyplot as plt

columns = ["Team", "Played", "Won", "Drawn", "Lost", "Points"]
rows = [["Rovers", 30, 21, 6, 3, 69],
        ["United", 30, 19, 7, 4, 64],
        ["Athletic", 30, 17, 8, 5, 59],
        ["City", 30, 15, 6, 9, 51],
        ["Wanderers", 30, 12, 9, 9, 45]]

fig, ax = plt.subplots()
ax.axis("off")
ax.table(cellText = rows, colLabels = columns, loc = "center")
# plt.show()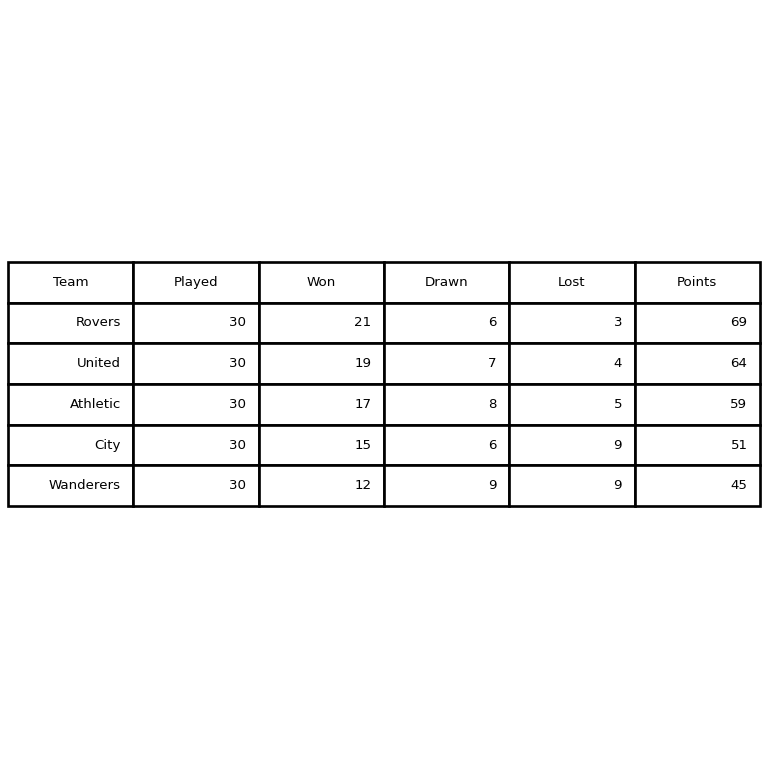
Font size and cell size
Disable the automatic font size with auto_set_font_size(False), set it with set_fontsize and enlarge the cells with scale(x, y).
import matplotlib.pyplot as plt

columns = ["Team", "Played", "Won", "Drawn", "Lost", "Points"]
rows = [["Rovers", 30, 21, 6, 3, 69],
        ["United", 30, 19, 7, 4, 64],
        ["Athletic", 30, 17, 8, 5, 59],
        ["City", 30, 15, 6, 9, 51],
        ["Wanderers", 30, 12, 9, 9, 45]]

fig, ax = plt.subplots()
ax.axis("off")
tab = ax.table(cellText = rows, colLabels = columns, loc = "center")

tab.auto_set_font_size(False)
tab.set_fontsize(11)
tab.scale(1.2, 1.8)
# plt.show()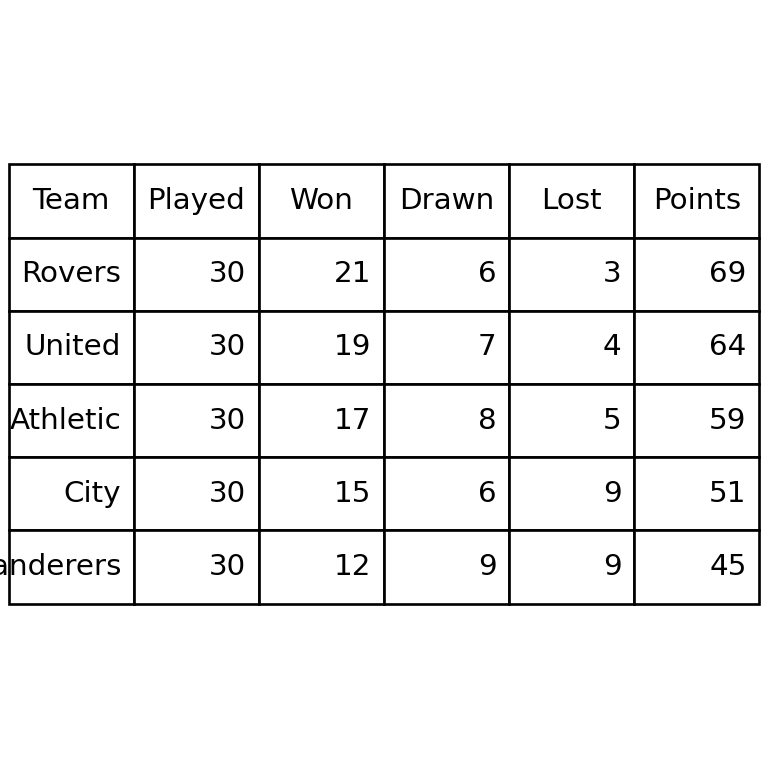
Colors of the header and the cells
colColours sets the background of the header and cellColours the background of each cell. Each cell can also be customized individually with tab[row, column], where row 0 is the header.
import matplotlib.pyplot as plt

columns = ["Team", "Played", "Won", "Drawn", "Lost", "Points"]
rows = [["Rovers", 30, 21, 6, 3, 69],
        ["United", 30, 19, 7, 4, 64],
        ["Athletic", 30, 17, 8, 5, 59],
        ["City", 30, 15, 6, 9, 51],
        ["Wanderers", 30, 12, 9, 9, 45]]

stripes = [["#F1FAEE"] * 6 if i % 2 == 0 else ["white"] * 6 for i in range(len(rows))]

fig, ax = plt.subplots()
ax.axis("off")
tab = ax.table(cellText = rows, colLabels = columns, loc = "center",
               cellColours = stripes, colColours = ["#1D3557"] * 6)
tab.auto_set_font_size(False)
tab.set_fontsize(10)
tab.scale(1.2, 2)

for col in range(len(columns)):
    tab[0, col].set_text_props(color = "white", weight = "bold")
# plt.show()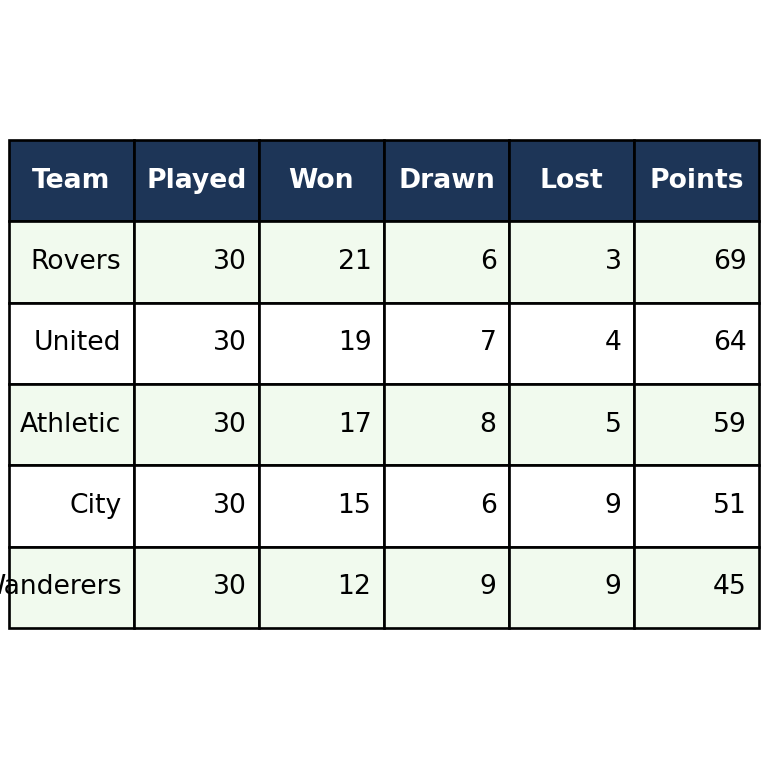
Highlight values
Loop through the cells to change the color of those that meet a condition, for example the leader of the league.
import matplotlib.pyplot as plt

columns = ["Team", "Played", "Won", "Drawn", "Lost", "Points"]
rows = [["Rovers", 30, 21, 6, 3, 69],
        ["United", 30, 19, 7, 4, 64],
        ["Athletic", 30, 17, 8, 5, 59],
        ["City", 30, 15, 6, 9, 51],
        ["Wanderers", 30, 12, 9, 9, 45]]

fig, ax = plt.subplots()
ax.axis("off")
tab = ax.table(cellText = rows, colLabels = columns, loc = "center")
tab.scale(1.1, 1.8)

for col in range(len(columns)):
    tab[1, col].set_facecolor("#FFD166")
# plt.show()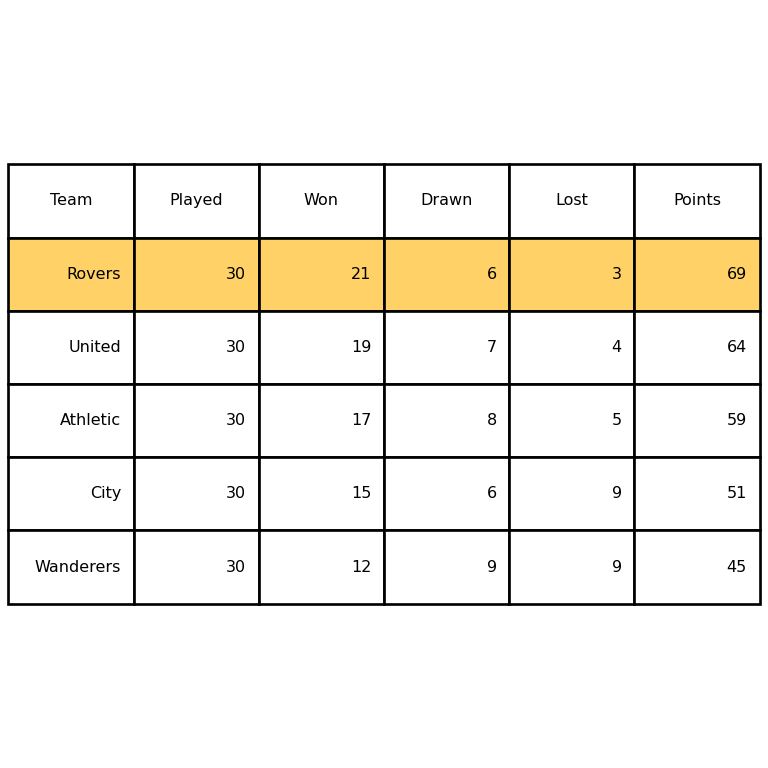
Table below a chart
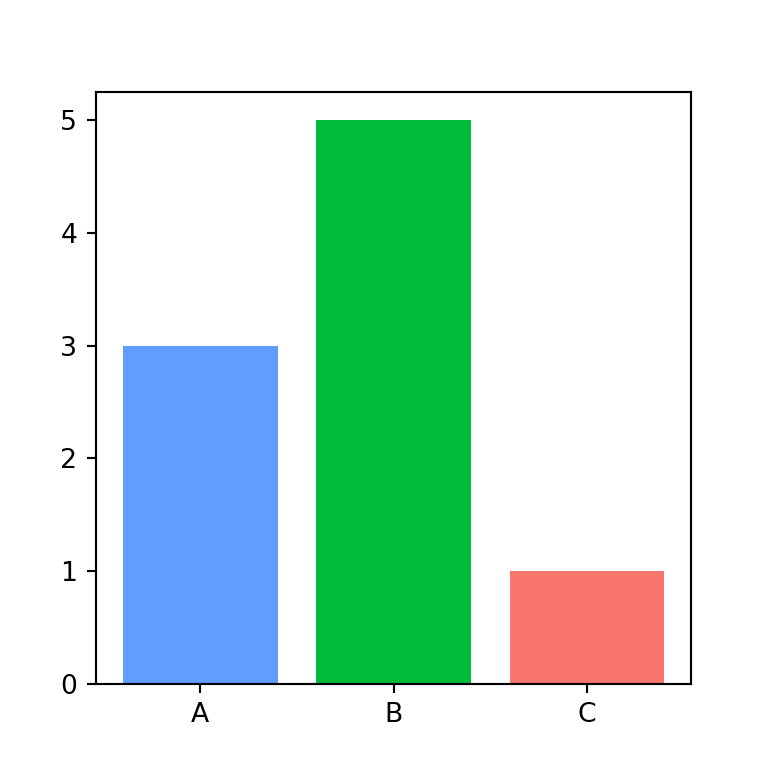
With loc = "bottom" the table is placed below the axes, so the values of a chart can be shown under it. Adjust the space with subplots_adjust.
import matplotlib.pyplot as plt

columns = ["Team", "Played", "Won", "Drawn", "Lost", "Points"]
rows = [["Rovers", 30, 21, 6, 3, 69],
        ["United", 30, 19, 7, 4, 64],
        ["Athletic", 30, 17, 8, 5, 59],
        ["City", 30, 15, 6, 9, 51],
        ["Wanderers", 30, 12, 9, 9, 45]]

teams = [r[0] for r in rows]
points = [r[5] for r in rows]

fig, ax = plt.subplots()
ax.bar(teams, points, color = "#457B9D")
ax.set_xticks([])
ax.table(cellText = [points], rowLabels = ["Points"], colLabels = teams, loc = "bottom")
plt.subplots_adjust(bottom = 0.2)
# plt.show()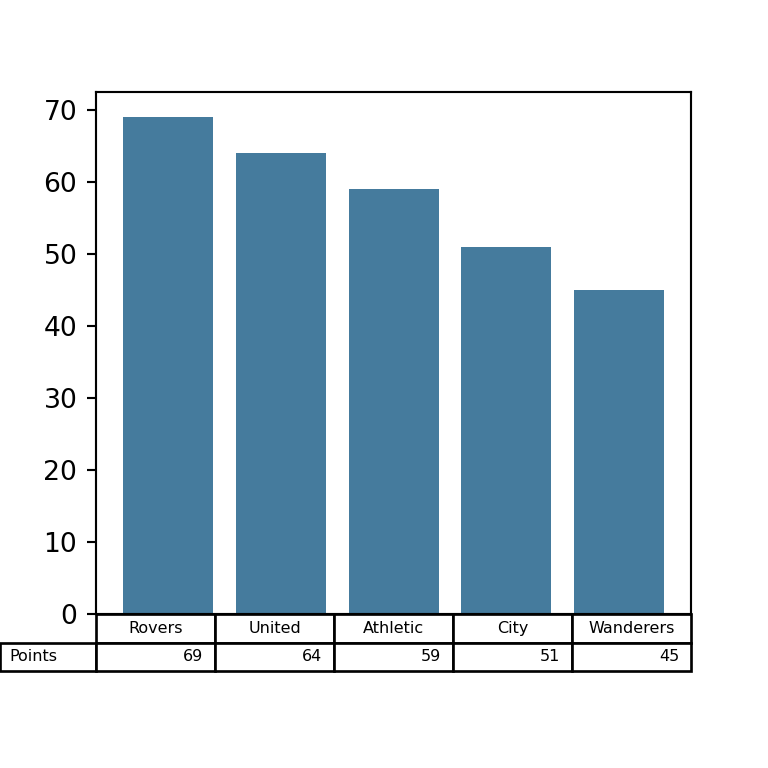
If you need tables with more advanced formatting for reports or web pages, take a look at the great_tables library.