Data simulation
The following data will be used as sample data along this tutorial.
import numpy as np
import seaborn as sns
import random

# Data simulation
rng = np.random.RandomState(0)
variable = rng.normal(20, 1, size = 50)
random.seed(0)
group = random.choices(["G1", "G2", "G3"], k = 50)
group2 = random.choices(["A", "B"], k = 50)
df = {'variable': variable, 'group': group, 'group2': group2}
Bar plot in seaborn with barplot
The barplot function allows creating bar charts in seaborn. This function computes the mean for each categorical variable and represents it with bars and its confidence interval with error bars. Use the countplot function to create a bar plot that displays the count for each category.
import seaborn as sns

# Bar plot
sns.barplot(x = group, y = variable)

# Equivalent to:
sns.barplot(x = "group", y = "variable", data = df)
If you don’t want to use the mean you can pass other function to the estimator argument.
Horizontal bar plot
If you want to create an horizontal bar chart just switch the input variables and pass the categorical variable to y.
import seaborn as sns

# Horizontal bar plot
sns.barplot(x = variable, y = group)
Order
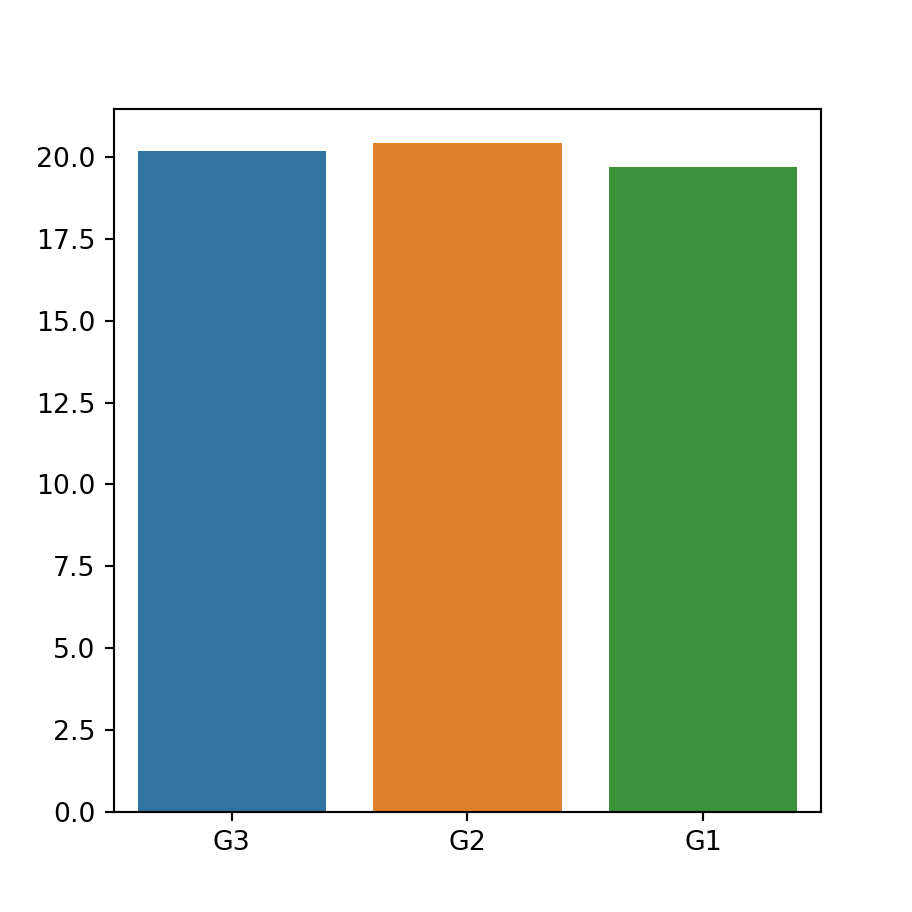
Note that the default order of the bars depends on the order of appearance of the groups on the variable. If you want to override the default order pass a list with the desired order to the order argument.
import seaborn as sns

sns.barplot(x = group, y = variable,
            order = ["G1", "G2", "G3"])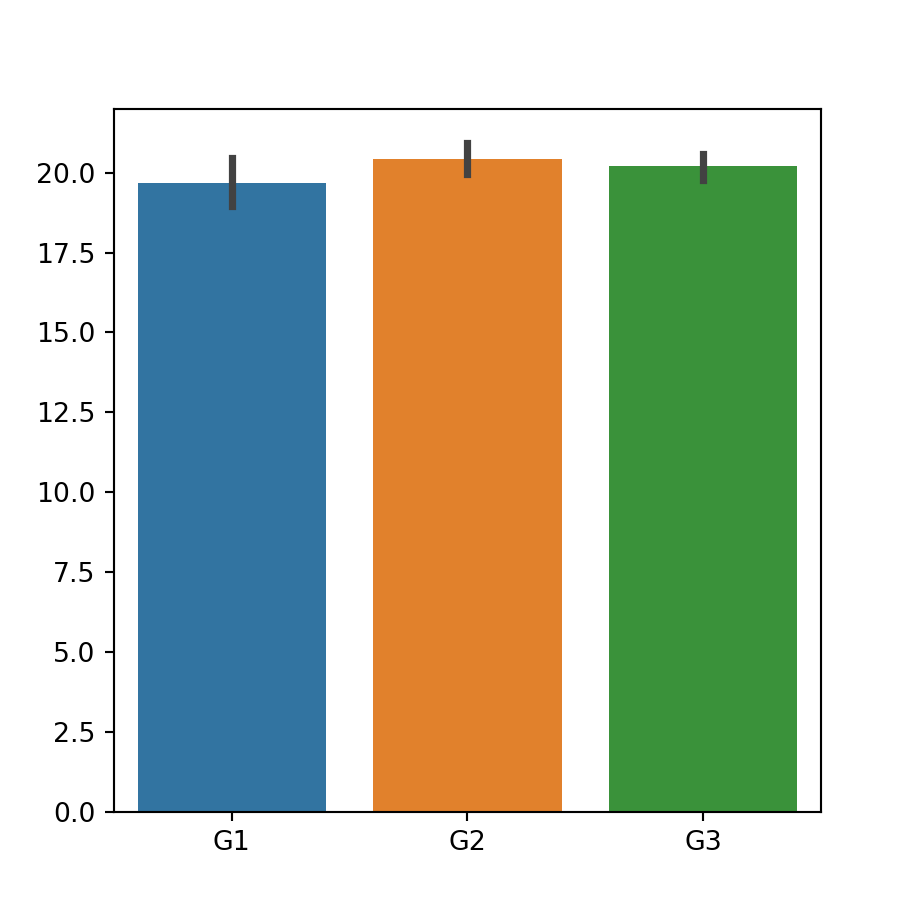
Dodged bar plot
If you have other categorical variable that divides the categories into subcategories you can pass it to the hue argument to create a dodged bar plot.
import seaborn as sns

# Bar plot by group and subgroup
sns.barplot(x = group, y = variable,
            hue = group2)
Error bars customization
Remove the error bars
The error bars are displayed over the bars by default, but you can remove them setting the argument ci to False. You can also set this argument to "sd" so the error bars will be calculated using the standard deviation of the data.
import seaborn as sns

sns.barplot(x = group, y = variable,
            ci = None)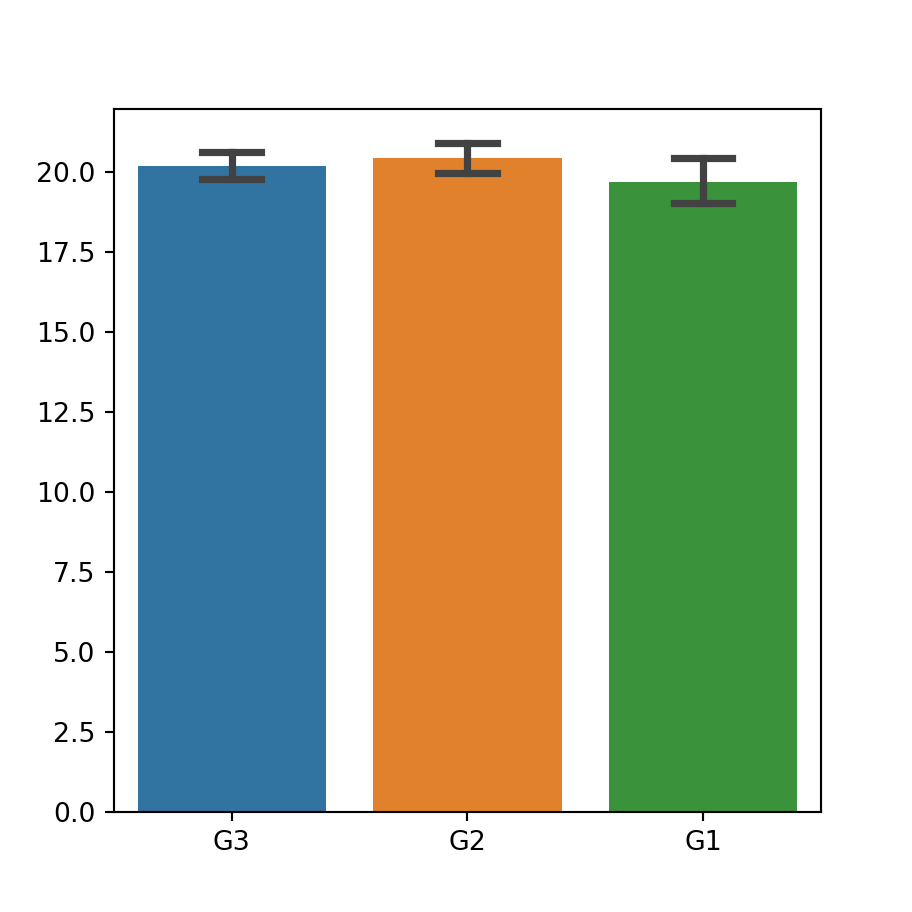
Adding caps to the error bars
If you want to add caps (horizontal segments) to the error bars you can set its width with the capsize argument, as shown below.
import seaborn as sns

sns.barplot(x = group, y = variable,
            capsize = 0.25)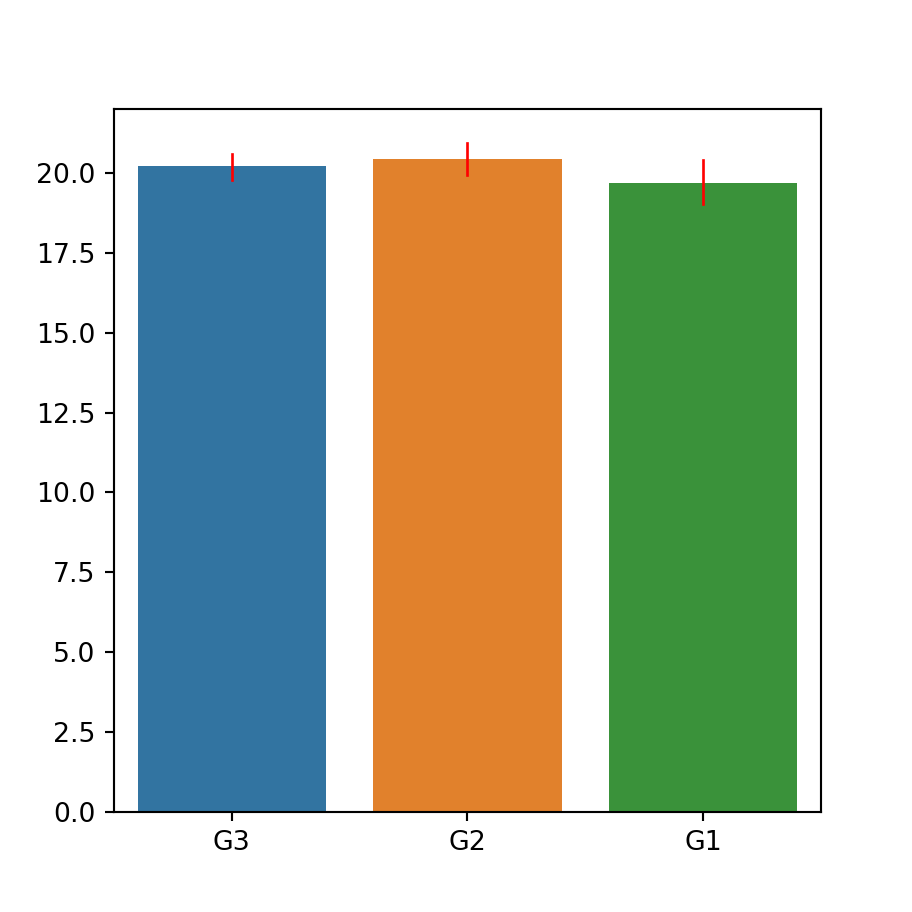
Color and width of the error bars
In addition, it is possible to change the width and the color of the error bars with errwidth and errcolor, respectively.
import seaborn as sns

sns.barplot(x = group, y = variable,
            errwidth = 1,
            errcolor = "red")
Color customization
Same color for all bars
If you want to set the same color for all the bars choose a color with the color argument. Recall that you can change its saturation with the saturation argument.
import seaborn as sns

sns.barplot(x = group, y = variable,
            color = "darkseagreen",
            saturation = 0.75)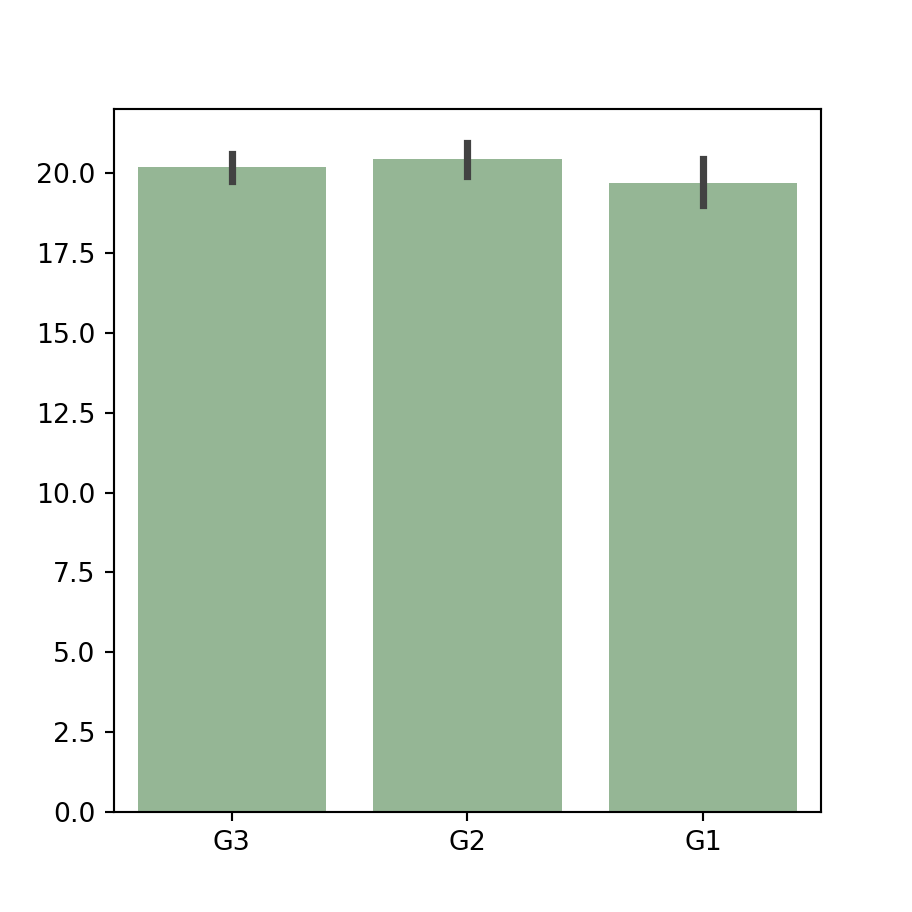
Color palette
An alternative is selecting a named color palette or passing a dictionary with a color for each group to the palette argument of the function.
import seaborn as sns

sns.barplot(x = group, y = variable,
            palette = "Blues_d")
Further customization
Finally, it should be noted that there are other arguments to customize the styling of the plot, as edgecolor, to change the borders color, among others.
import seaborn as sns

sns.barplot(x = group, y = variable,
            linewidth = 1,
            facecolor = "white",
            edgecolor = "red")


