Using the bar function to create bar charts in matplotlib
In order to create a vertical bar plot or bar chart with matplotlib you can use the bar function. You can input the categories to x and the height of the bars to height. For stacked bar plots refer to this tutorial.
import matplotlib.pyplot as plt

# Data
x = ["A", "B", "C"]
y = [3, 5, 1]

# Bar plot
fig, ax = plt.subplots()
ax.bar(x = x, height = y)
# plt.show()
Note that instead of groups you can also input a numeric array with the desired positions of the bars.
import matplotlib.pyplot as plt

# Data
x = [1, 3, 4]
y = [3, 5, 1]

# Bar plot
fig, ax = plt.subplots()
ax.bar(x = x, height = y)
# plt.show()
Tick labels
In the previous scenario you can add the group labels with the tick_label argument, as in the example below.
import matplotlib.pyplot as plt

# Data
x = [1, 3, 4]
y = [3, 5, 1]
labels = ["Group 1", "Group 2", "Group 3"]

# Bar plot
fig, ax = plt.subplots()
ax.bar(x = x, height = y, tick_label = labels)
# plt.show()
Width of the bars
By default, the width of the bars is 0.8. However, you can input a float to width to change the width for all bars or an array specifying the width for each bar, as in the example below.
import matplotlib.pyplot as plt

# Data
x = ["A", "B", "C"]
y = [3, 5, 1]
widths = [0.5, 0.3, 1.2]

# Bar plot
fig, ax = plt.subplots()
ax.bar(x = x, height = y, width = widths)
# plt.show()
Bars alignment
The bars alignment regarding the X-axis values is "center" by default, but you can also set align = "edge" to align the left edges of the bars with the X coordinates.
import matplotlib.pyplot as plt

# Data
x = ["A", "B", "C"]
y = [3, 5, 1]

# Bar plot
fig, ax = plt.subplots()
ax.bar(x = x, height = y, align = "edge")
# plt.show()
Y-axis start coordinates of the bars
The bars start by default in Y = 0, but the bottom argument allows overriding the base coordinate for all or for each bar.
import matplotlib.pyplot as plt

# Data
x = ["A", "B", "C"]
y = [3, 5, 1]

# Bar plot
fig, ax = plt.subplots()
ax.bar(x = x, height = y, bottom = [2, 3, 0])
# plt.show()
Log Y-axis
Finally, note that it is possible to set the Y-axis to be log scale setting log = True.
import matplotlib.pyplot as plt

# Data
x = ["A", "B", "C"]
y = [3, 5, 1]

# Bar plot
fig, ax = plt.subplots()
ax.bar(x = x, height = y, log = True)
# plt.show()
Horizontal bar chart with barh
The previous function allows creating vertical bar charts in Python, but if you want to create an horizontal bar plot you will need to use the barh function instead. This function is very similar to the previous with minor changes on the arguments. For instance, instead of using the height argument you will need to use width, as shown below.

import matplotlib.pyplot as plt

# Data
x = ["A", "B", "C"]
y = [3, 5, 1]

# Bar plot
fig, ax = plt.subplots()
ax.barh(x, width = y)
# plt.show()
You might have noticed that the labels are not in the same order as created. Nonetheless, you can invert the Y-axis with invert_yaxis(), so the labels will be read top-to-bottom.

import matplotlib.pyplot as plt

# Data
x = ["A", "B", "C"]
y = [3, 5, 1]

# Bar plot
fig, ax = plt.subplots()
ax.barh(x, width = y)
ax.invert_yaxis()
# plt.show()
X-axis start coordinates of the bars
When using barh, the argument equivalent to bottom in bar is left, which allows modifying the start of the X coordinates of the bars.

import matplotlib.pyplot as plt

# Data
x = ["A", "B", "C"]
y = [3, 5, 1]

# Bar plot
fig, ax = plt.subplots()
ax.barh(x, width = y, left = [2, 3, 0])
# plt.show()
Bar chart with error bars
Both bar and barh provides an argument to add vertical and horizontal error bars named yerr and xerr.
import matplotlib.pyplot as plt

# Data
x = ["A", "B", "C"]
y = [3, 5, 1]
error = [0.8, 0.4, 0.2]

# Bar plot
fig, ax = plt.subplots()
# We are using yerr because the bar chart is vertical.
# Use xerr when using barh
ax.bar(x = x, height = y, yerr = error)
# plt.show()
Note that you can also add the caps of the error bars setting an according size with capsize.
import matplotlib.pyplot as plt

# Data
x = ["A", "B", "C"]
y = [3, 5, 1]
error = [0.8, 0.4, 0.2]

# Bar plot
fig, ax = plt.subplots()
ax.bar(x = x, height = y, yerr = error, capsize = 10)
# plt.show()
Finally, you can also modify the color of the error bars with ecolor. In the following block of code we are setting them to red. Use the error_kw argument to pass a dict with further customization.
import matplotlib.pyplot as plt

# Data
x = ["A", "B", "C"]
y = [3, 5, 1]
error = [0.8, 0.4, 0.2]

# Bar plot
fig, ax = plt.subplots()
ax.bar(x = x, height = y, yerr = error, capsize = 10, ecolor = "r")
# plt.show()
Color customization
Fill color
The default blue fill color of the bars can be customized with the color argument. You can pass a new color to the argument to change the color for all the bars at the same time.

import matplotlib.pyplot as plt

# Data
x = ["A", "B", "C"]
y = [3, 5, 1]

# Bar plot
fig, ax = plt.subplots()
ax.bar(x = x, height = y, color = "darkseagreen")
# plt.show()
Fill color by group
In addition, if you prefer to set a color for each bar you can pass an array to the argument of the function with the desired colors.

import matplotlib.pyplot as plt

# Data
x = ["A", "B", "C"]
y = [3, 5, 1]
colors = ["#619cff", "#00ba38", "#f8766d"]

# Bar plot
fig, ax = plt.subplots()
ax.bar(x = x, height = y, color = colors)
# plt.show()
Transparency
Note that alpha will allow you to change the transparency of the fill color of the bars passing a float between 0 and 1.
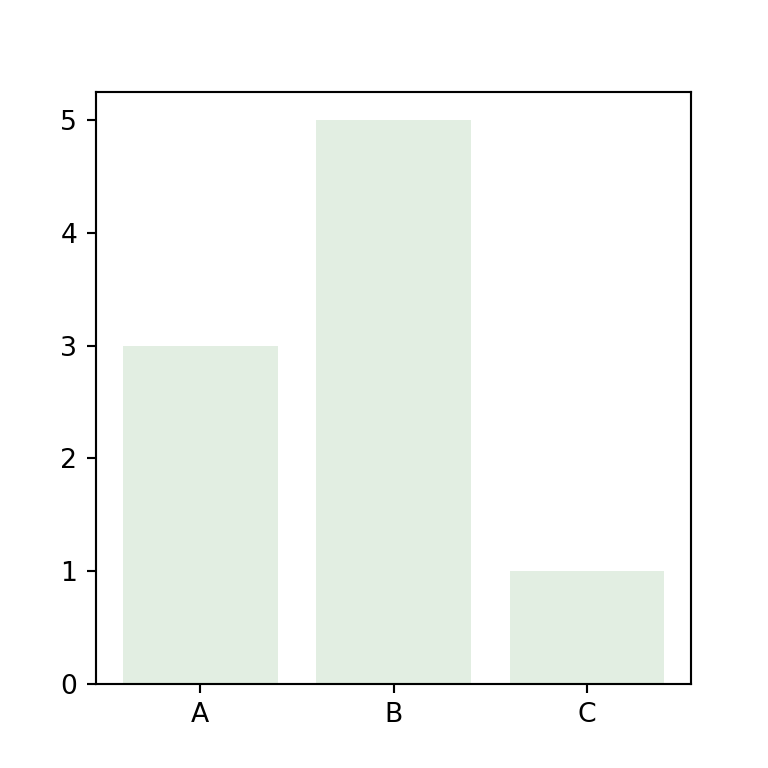
import matplotlib.pyplot as plt

# Data
x = ["A", "B", "C"]
y = [3, 5, 1]

# Bar plot
fig, ax = plt.subplots()
ax.bar(x = x, height = y, color = "darkseagreen", alpha = 0.25)
# plt.show()
Border color
Finally, you can even customize the border color of the bars with edgecolor, for all the bars or for each bar. Note that linewidth will allow you to change the width of the borders.

import matplotlib.pyplot as plt

# Data
x = ["A", "B", "C"]
y = [3, 5, 1]

# Bar plot
fig, ax = plt.subplots()
ax.bar(x = x, height = y, color = "w",
       edgecolor = "darkseagreen", linewidth = 2)
# plt.show()


