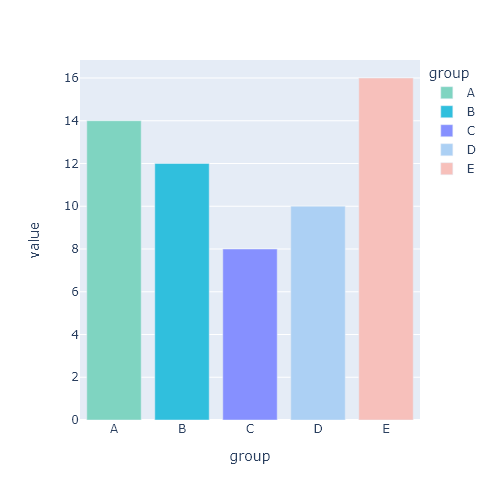
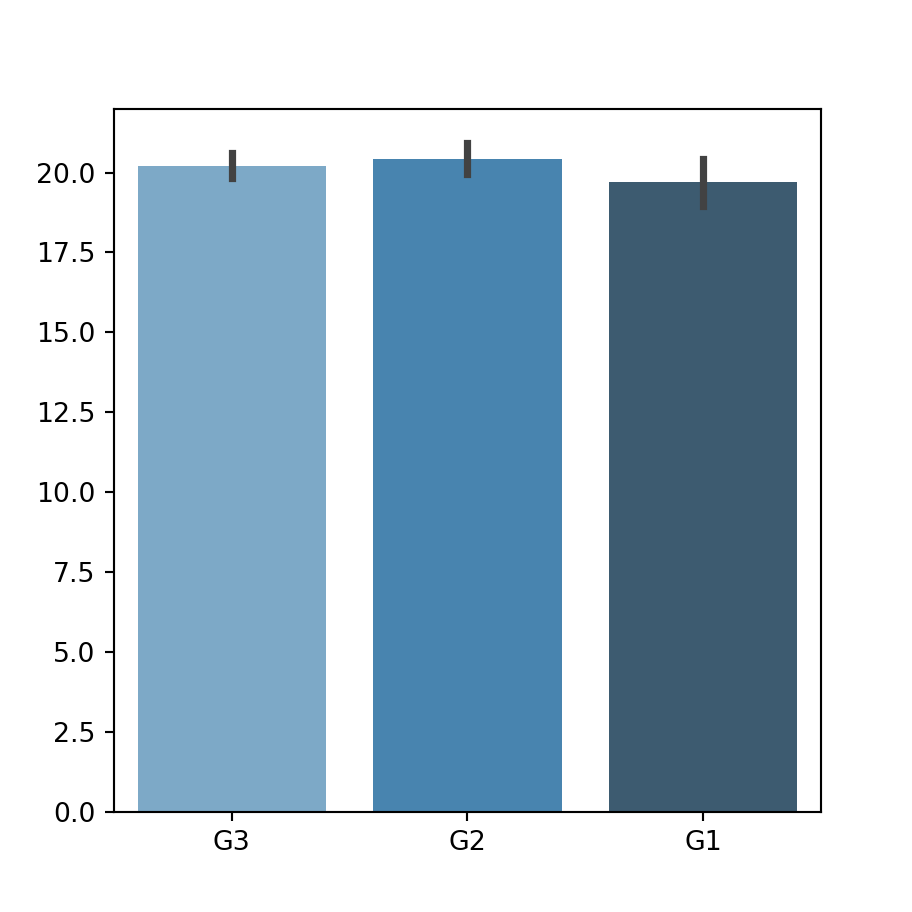
pandas creates bar charts with plot.bar (vertical bars) and plot.barh (horizontal bars). The index of the data is used for the categories and each column becomes a group of bars.
Bar chart with plot.bar
Calling plot.bar on a data frame with several columns creates a grouped bar chart. Use rot = 0 to keep the labels horizontal.
import pandas as pd
import matplotlib.pyplot as plt

df = pd.DataFrame({"gold": [40, 40, 20, 18, 16],
                   "silver": [44, 27, 12, 19, 26],
                   "bronze": [42, 24, 13, 16, 22]},
                  index = ["USA", "China", "Japan", "Australia", "France"])

df.plot.bar(rot = 0)
# plt.show()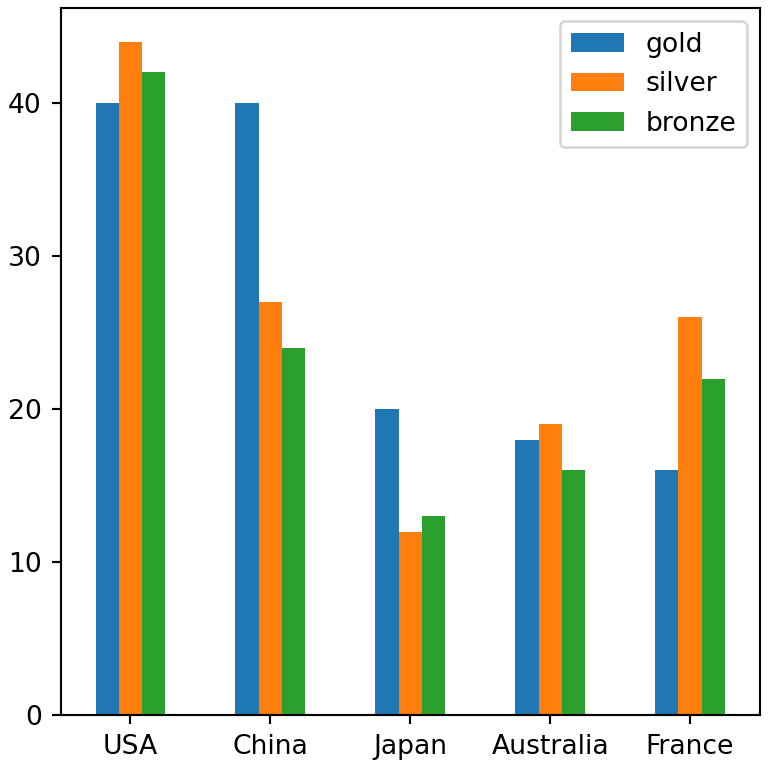
Bar chart of a single column
import pandas as pd
import matplotlib.pyplot as plt

df = pd.DataFrame({"gold": [40, 40, 20, 18, 16],
                   "silver": [44, 27, 12, 19, 26],
                   "bronze": [42, 24, 13, 16, 22]},
                  index = ["USA", "China", "Japan", "Australia", "France"])

df["gold"].plot.bar(rot = 0, color = "#D4AF37")
# plt.show()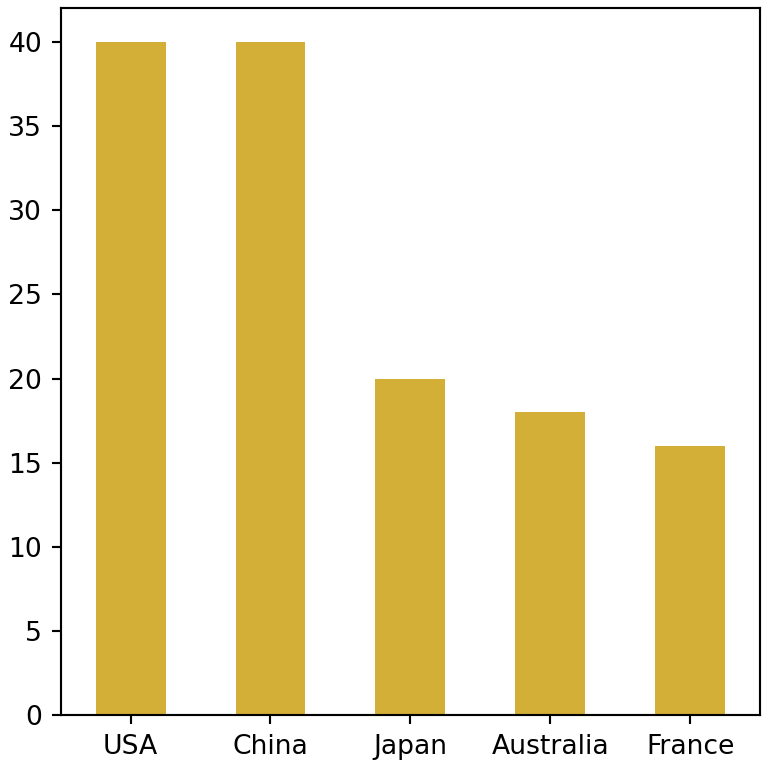
Horizontal bar chart
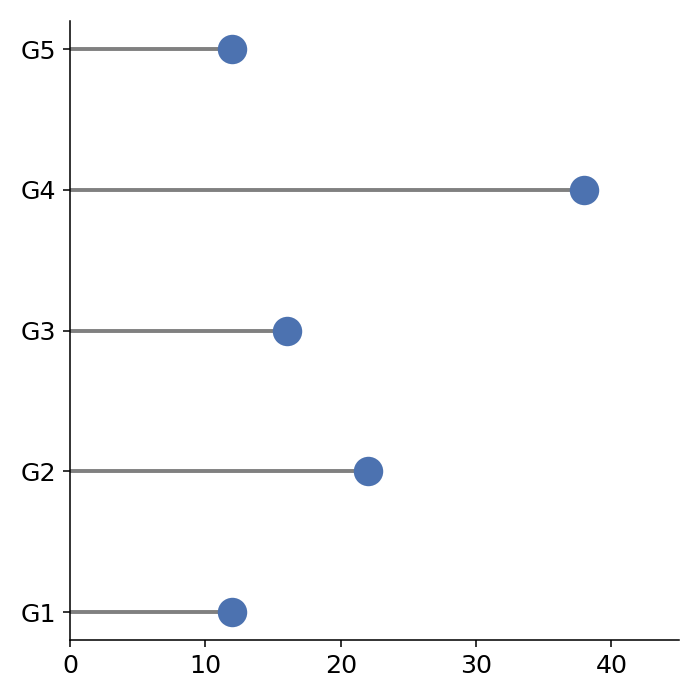
plot.barh creates horizontal bars, which are easier to read when the labels are long. Sort the values before plotting them to create an ordered bar chart.
import pandas as pd
import matplotlib.pyplot as plt

s = pd.Series({"Python": 52, "JavaScript": 45, "SQL": 38, "Java": 30, "C#": 27})

s.sort_values().plot.barh()
# plt.show()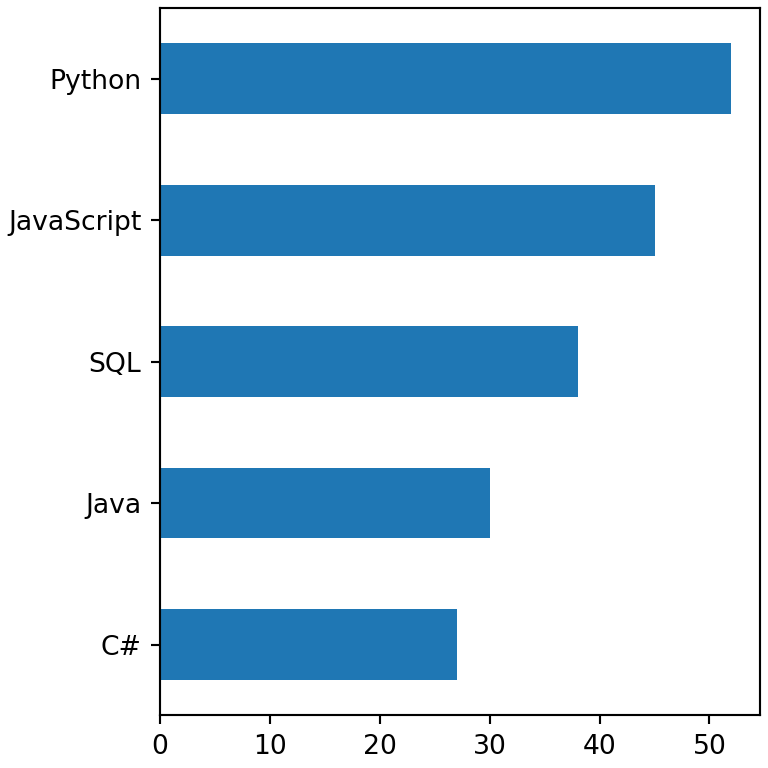
Stacked bar chart
Set stacked = True to stack the columns on top of each other instead of placing them side by side.
import pandas as pd
import matplotlib.pyplot as plt

df = pd.DataFrame({"gold": [40, 40, 20, 18, 16],
                   "silver": [44, 27, 12, 19, 26],
                   "bronze": [42, 24, 13, 16, 22]},
                  index = ["USA", "China", "Japan", "Australia", "France"])

df.plot.bar(stacked = True, rot = 0)
# plt.show()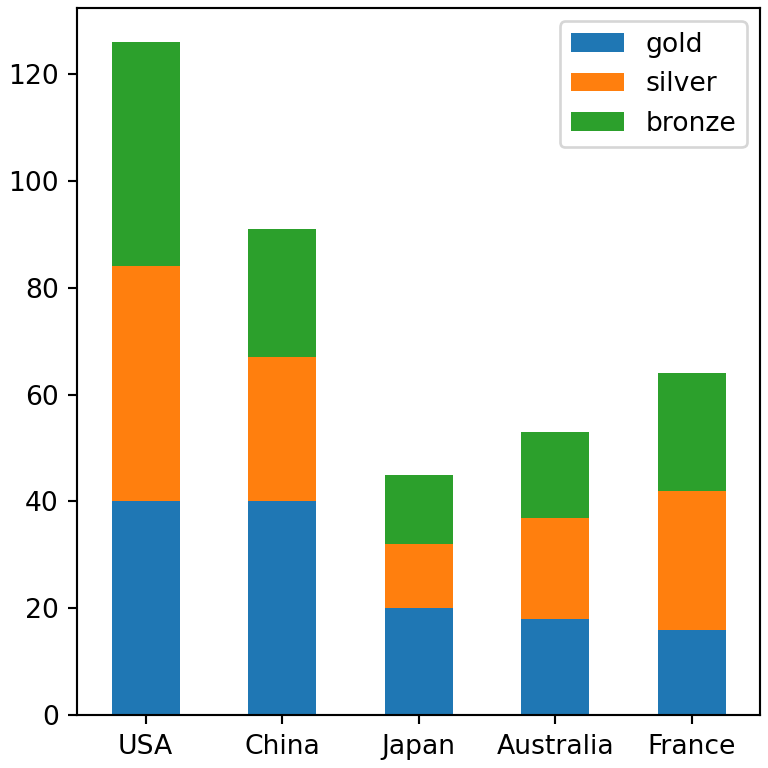
Colors and width
Pass a list of colors (one per column) to color, or a dictionary that maps each column to a color. width sets the width of the bars.
import pandas as pd
import matplotlib.pyplot as plt

df = pd.DataFrame({"gold": [40, 40, 20, 18, 16],
                   "silver": [44, 27, 12, 19, 26],
                   "bronze": [42, 24, 13, 16, 22]},
                  index = ["USA", "China", "Japan", "Australia", "France"])

df.plot.bar(color = {"gold": "#D4AF37", "silver": "#A8A9AD", "bronze": "#CD7F32"},
            width = 0.8, rot = 0)
# plt.show()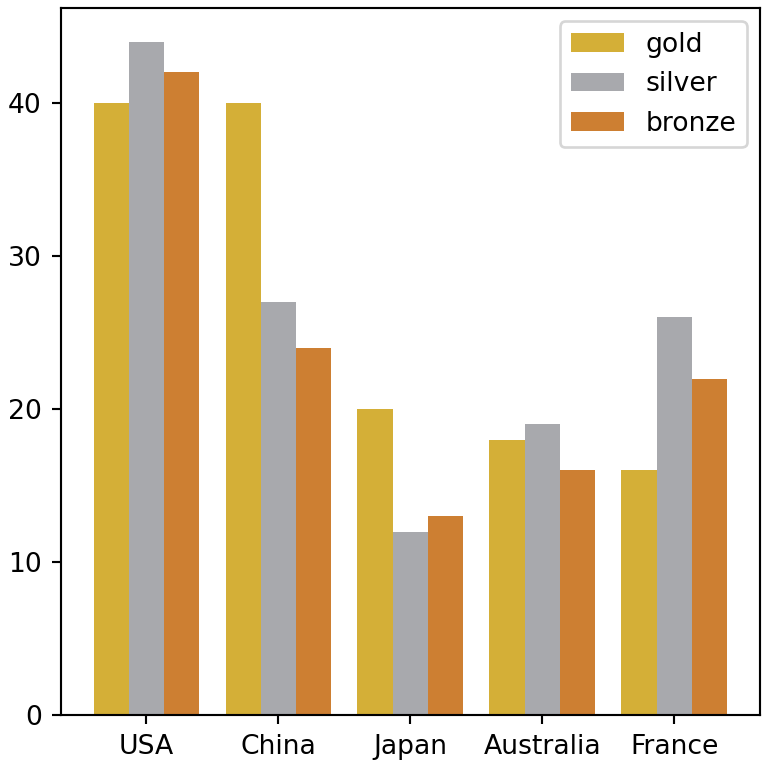
Add the values on top of the bars
plot.bar returns the matplotlib axes, so you can add the values of each group of bars with bar_label.
import pandas as pd
import matplotlib.pyplot as plt

df = pd.DataFrame({"gold": [40, 40, 20, 18, 16],
                   "silver": [44, 27, 12, 19, 26],
                   "bronze": [42, 24, 13, 16, 22]},
                  index = ["USA", "China", "Japan", "Australia", "France"])

ax = df.plot.bar(rot = 0, width = 0.8)

for container in ax.containers:
    ax.bar_label(container, fontsize = 8)
# plt.show()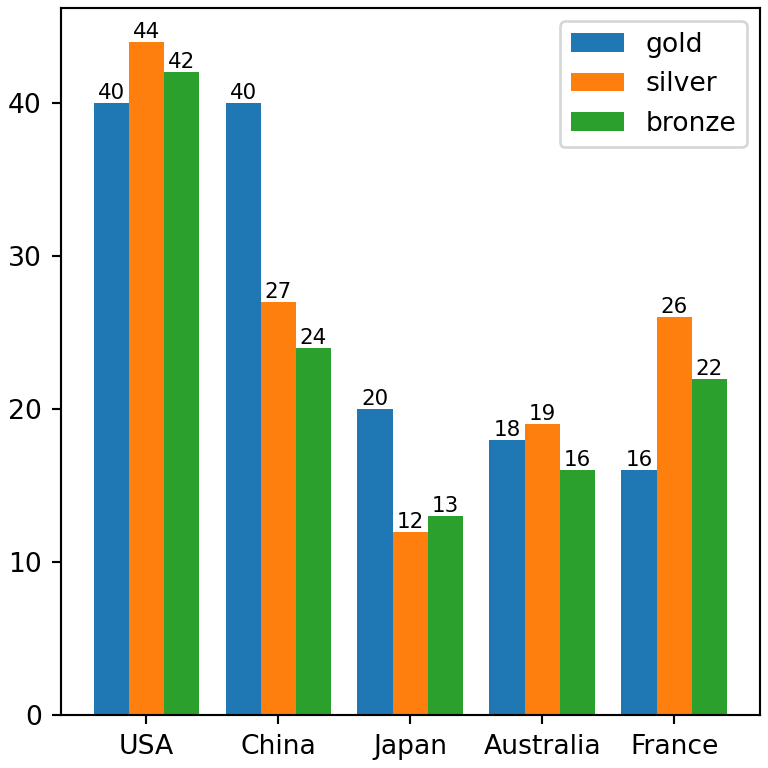
See the plotting with pandas guide for more options or learn how to create a bar chart in matplotlib and a stacked bar chart in matplotlib.