A circular barplot is a bar chart drawn on polar coordinates: each bar is placed at an angle and its length is the value. It is visually striking and works well with cyclic data, like the months of the year. The examples show the monthly hours of sunshine of a city.
Bars on polar axes
Create polar axes with subplot_kw = {"projection": "polar"} and draw the bars with bar, using the angles as X values.
import numpy as np
import matplotlib.pyplot as plt

months = ["Jan", "Feb", "Mar", "Apr", "May", "Jun", "Jul", "Aug", "Sep", "Oct", "Nov", "Dec"]
sunshine = np.array([150, 160, 210, 230, 280, 320, 350, 330, 260, 200, 150, 140])
angles = np.linspace(0, 2 * np.pi, len(months), endpoint = False)

fig, ax = plt.subplots(subplot_kw = {"projection": "polar"})
ax.bar(angles, sunshine, width = 0.45)
ax.set_xticks(angles, months)
# plt.show()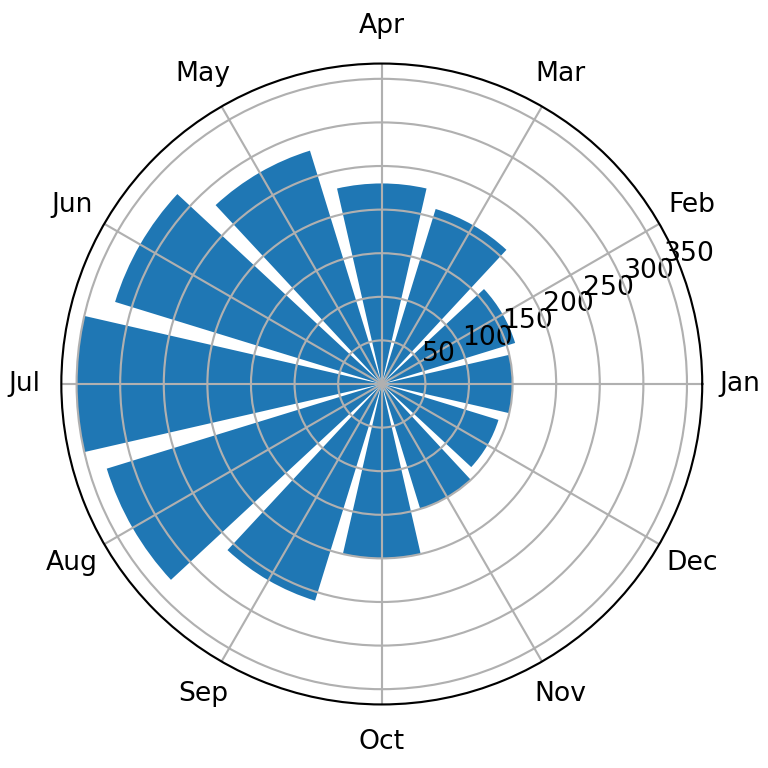
Hole in the center and orientation
Set a negative lower limit on the radial axis to leave a hole in the center. set_theta_zero_location and set_theta_direction make the first bar start at the top and go clockwise, like a clock.
import numpy as np
import matplotlib.pyplot as plt

months = ["Jan", "Feb", "Mar", "Apr", "May", "Jun", "Jul", "Aug", "Sep", "Oct", "Nov", "Dec"]
sunshine = np.array([150, 160, 210, 230, 280, 320, 350, 330, 260, 200, 150, 140])
angles = np.linspace(0, 2 * np.pi, len(months), endpoint = False)

fig, ax = plt.subplots(subplot_kw = {"projection": "polar"})
ax.bar(angles, sunshine, width = 0.45)

ax.set_ylim(-150, 360)
ax.set_theta_zero_location("N")
ax.set_theta_direction(-1)
ax.set_xticks(angles, months)
ax.set_yticks([])
# plt.show()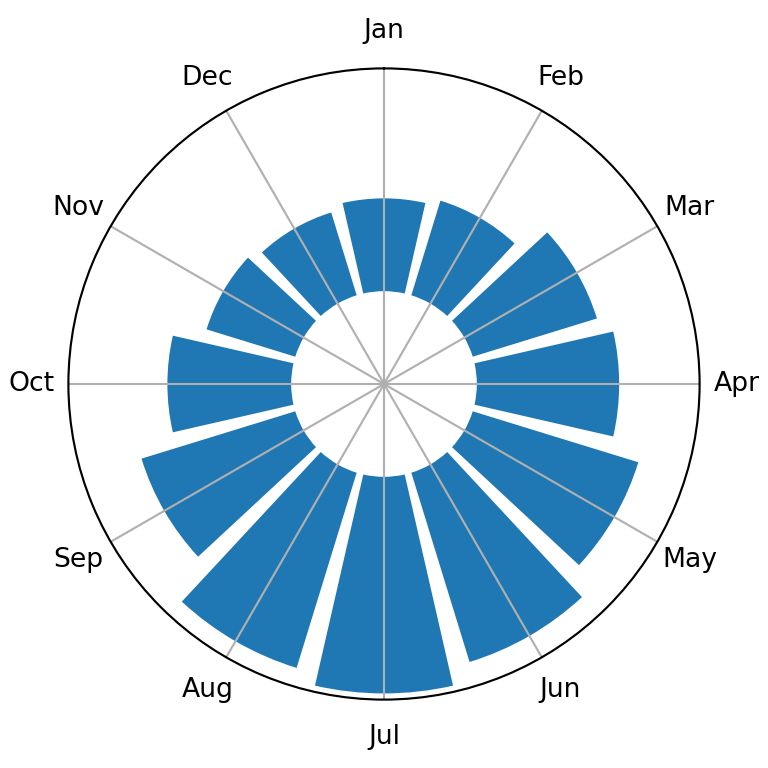
Color by value
Map the values to a colormap to color each bar and remove the grid and the frame for a cleaner look.
import numpy as np
import matplotlib.pyplot as plt

months = ["Jan", "Feb", "Mar", "Apr", "May", "Jun", "Jul", "Aug", "Sep", "Oct", "Nov", "Dec"]
sunshine = np.array([150, 160, 210, 230, 280, 320, 350, 330, 260, 200, 150, 140])
angles = np.linspace(0, 2 * np.pi, len(months), endpoint = False)

colors = plt.cm.YlOrRd(sunshine / sunshine.max())

fig, ax = plt.subplots(subplot_kw = {"projection": "polar"})
ax.bar(angles, sunshine, width = 0.5, color = colors, edgecolor = "white")
ax.set_ylim(-150, 360)
ax.set_theta_zero_location("N")
ax.set_theta_direction(-1)
ax.set_xticks(angles, months)
ax.set_yticks([])
ax.spines["polar"].set_visible(False)
# plt.show()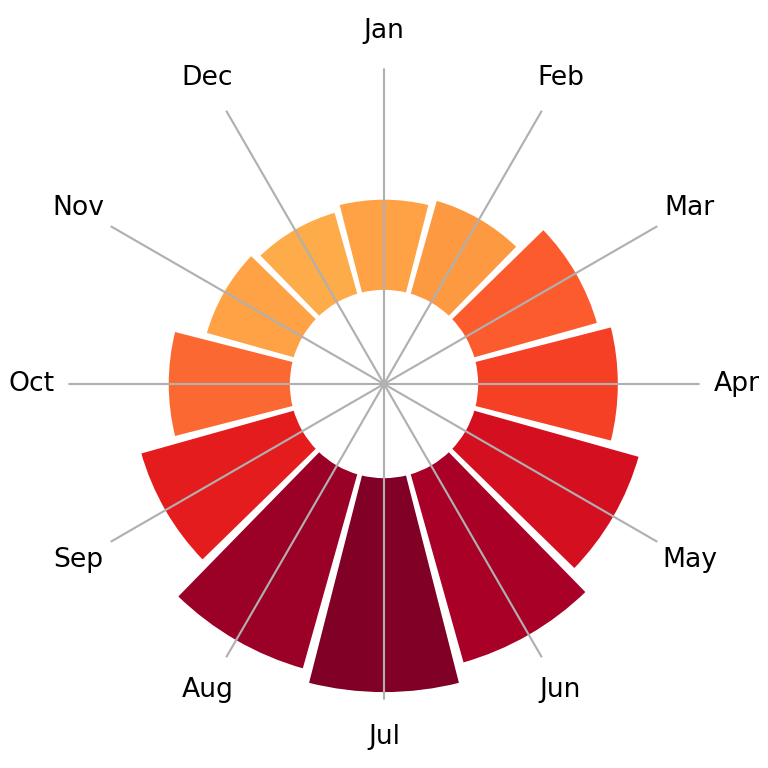
Values as labels
Write the value of each bar at its end with text, using the angle of the bar as X coordinate and the value plus a small margin as Y coordinate.
import numpy as np
import matplotlib.pyplot as plt

months = ["Jan", "Feb", "Mar", "Apr", "May", "Jun", "Jul", "Aug", "Sep", "Oct", "Nov", "Dec"]
sunshine = np.array([150, 160, 210, 230, 280, 320, 350, 330, 260, 200, 150, 140])
angles = np.linspace(0, 2 * np.pi, len(months), endpoint = False)

fig, ax = plt.subplots(subplot_kw = {"projection": "polar"})
ax.bar(angles, sunshine, width = 0.45, color = "#F4A261")
ax.set_ylim(-150, 400)
ax.set_theta_zero_location("N")
ax.set_theta_direction(-1)
ax.set_xticks(angles, months)
ax.set_yticks([])

for angle, value in zip(angles, sunshine):
    ax.text(angle, value + 30, str(value), ha = "center", fontsize = 8)
# plt.show()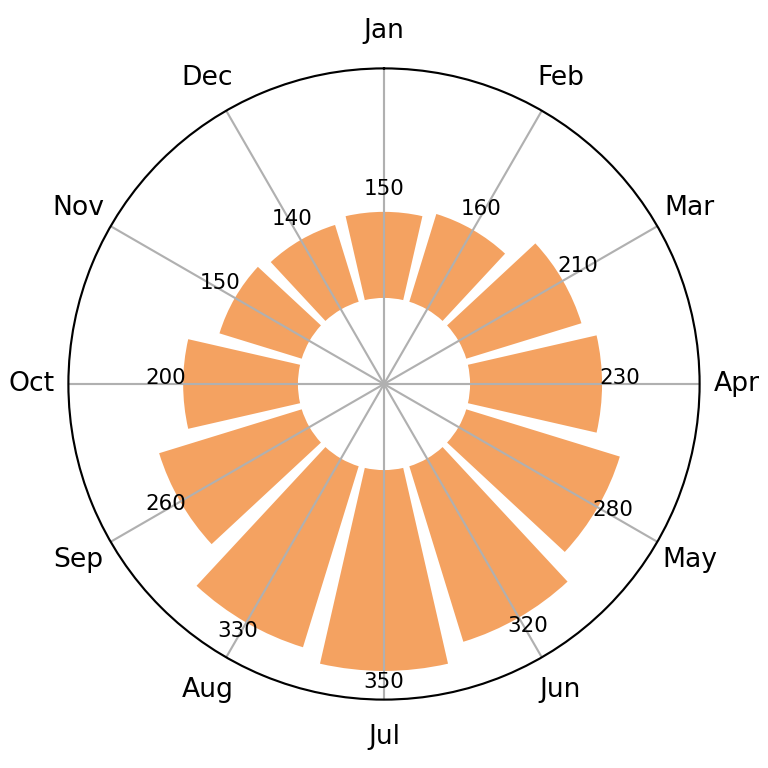
See also how to create a bar plot in matplotlib and a radar chart in matplotlib.