Un gráfico de barras circular es un gráfico de barras dibujado en coordenadas polares: cada barra se coloca en un ángulo y su longitud es el valor. Es muy llamativo y funciona bien con datos cíclicos, como los meses del año. Los ejemplos muestran las horas de sol mensuales de una ciudad.
Barras en ejes polares
Crea unos ejes polares con subplot_kw = {"projection": "polar"} y dibuja las barras con bar, usando los ángulos como valores de X.
import numpy as np
import matplotlib.pyplot as plt

months = ["Ene", "Feb", "Mar", "Abr", "May", "Jun", "Jul", "Ago", "Sep", "Oct", "Nov", "Dic"]
sunshine = np.array([150, 160, 210, 230, 280, 320, 350, 330, 260, 200, 150, 140])
angles = np.linspace(0, 2 * np.pi, len(months), endpoint = False)

fig, ax = plt.subplots(subplot_kw = {"projection": "polar"})
ax.bar(angles, sunshine, width = 0.45)
ax.set_xticks(angles, months)
# plt.show()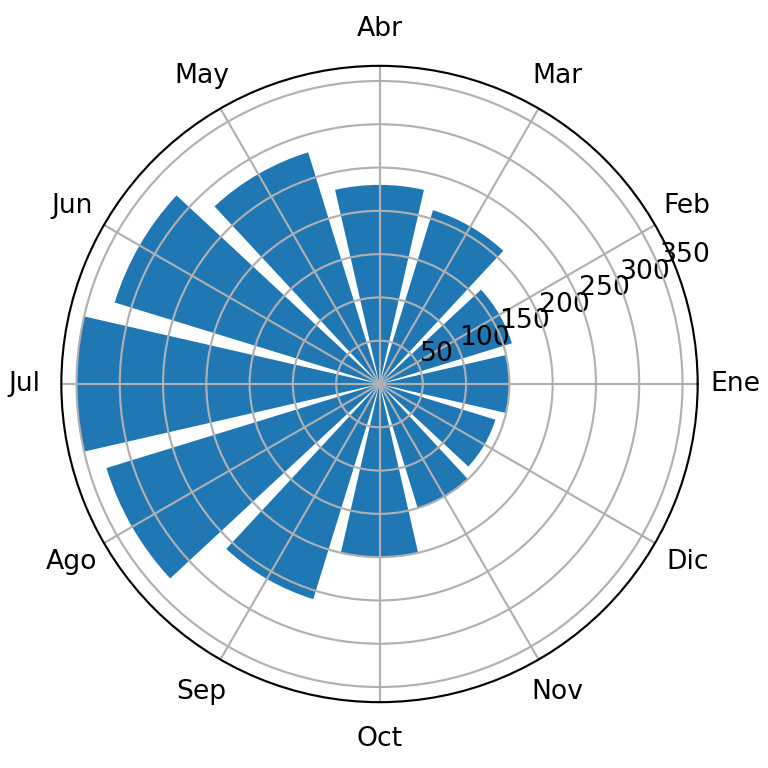
Hueco en el centro y orientación
Establece un límite inferior negativo en el eje radial para dejar un hueco en el centro. set_theta_zero_location y set_theta_direction hacen que la primera barra empiece arriba y vaya en el sentido de las agujas del reloj.
import numpy as np
import matplotlib.pyplot as plt

months = ["Ene", "Feb", "Mar", "Abr", "May", "Jun", "Jul", "Ago", "Sep", "Oct", "Nov", "Dic"]
sunshine = np.array([150, 160, 210, 230, 280, 320, 350, 330, 260, 200, 150, 140])
angles = np.linspace(0, 2 * np.pi, len(months), endpoint = False)

fig, ax = plt.subplots(subplot_kw = {"projection": "polar"})
ax.bar(angles, sunshine, width = 0.45)

ax.set_ylim(-150, 360)
ax.set_theta_zero_location("N")
ax.set_theta_direction(-1)
ax.set_xticks(angles, months)
ax.set_yticks([])
# plt.show()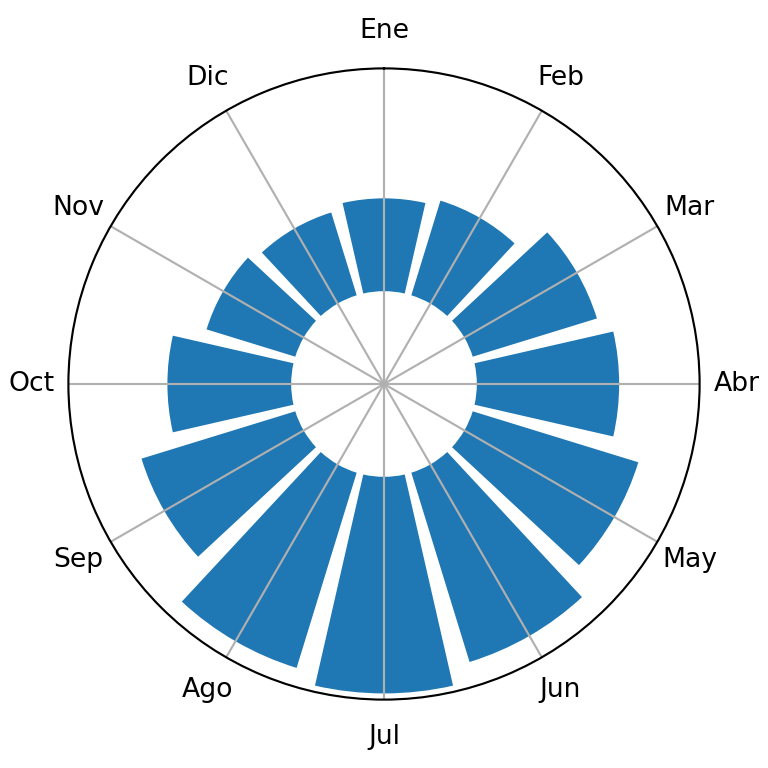
Color según el valor
Asigna los valores a un colormap para colorear cada barra y elimina el grid y el borde para un aspecto más limpio.
import numpy as np
import matplotlib.pyplot as plt

months = ["Ene", "Feb", "Mar", "Abr", "May", "Jun", "Jul", "Ago", "Sep", "Oct", "Nov", "Dic"]
sunshine = np.array([150, 160, 210, 230, 280, 320, 350, 330, 260, 200, 150, 140])
angles = np.linspace(0, 2 * np.pi, len(months), endpoint = False)

colors = plt.cm.YlOrRd(sunshine / sunshine.max())

fig, ax = plt.subplots(subplot_kw = {"projection": "polar"})
ax.bar(angles, sunshine, width = 0.5, color = colors, edgecolor = "white")
ax.set_ylim(-150, 360)
ax.set_theta_zero_location("N")
ax.set_theta_direction(-1)
ax.set_xticks(angles, months)
ax.set_yticks([])
ax.spines["polar"].set_visible(False)
# plt.show()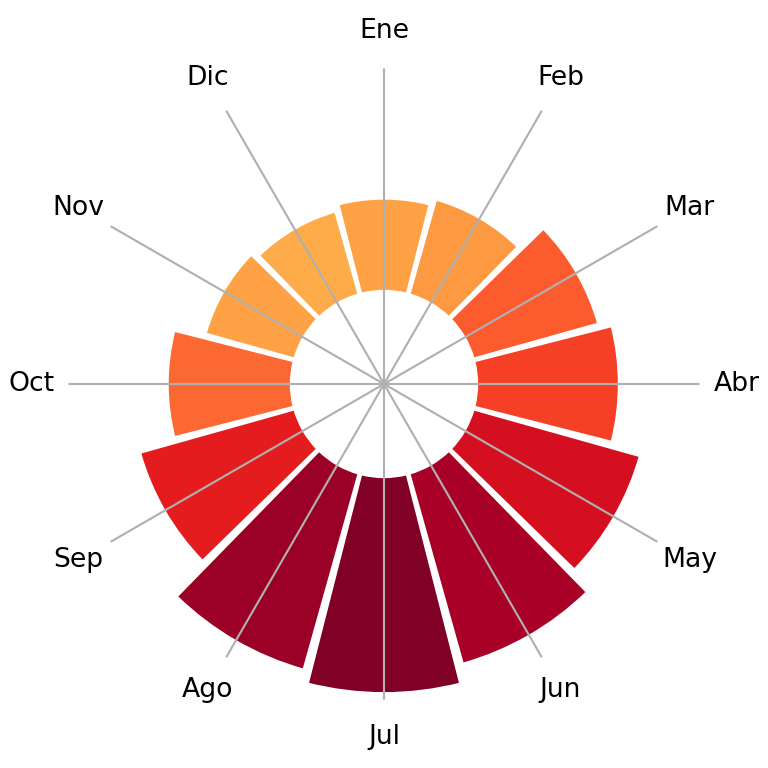
Valores como etiquetas
Escribe el valor de cada barra en su extremo con text, usando el ángulo de la barra como coordenada X y el valor más un pequeño margen como coordenada Y.
import numpy as np
import matplotlib.pyplot as plt

months = ["Ene", "Feb", "Mar", "Abr", "May", "Jun", "Jul", "Ago", "Sep", "Oct", "Nov", "Dic"]
sunshine = np.array([150, 160, 210, 230, 280, 320, 350, 330, 260, 200, 150, 140])
angles = np.linspace(0, 2 * np.pi, len(months), endpoint = False)

fig, ax = plt.subplots(subplot_kw = {"projection": "polar"})
ax.bar(angles, sunshine, width = 0.45, color = "#F4A261")
ax.set_ylim(-150, 400)
ax.set_theta_zero_location("N")
ax.set_theta_direction(-1)
ax.set_xticks(angles, months)
ax.set_yticks([])

for angle, value in zip(angles, sunshine):
    ax.text(angle, value + 30, str(value), ha = "center", fontsize = 8)
# plt.show()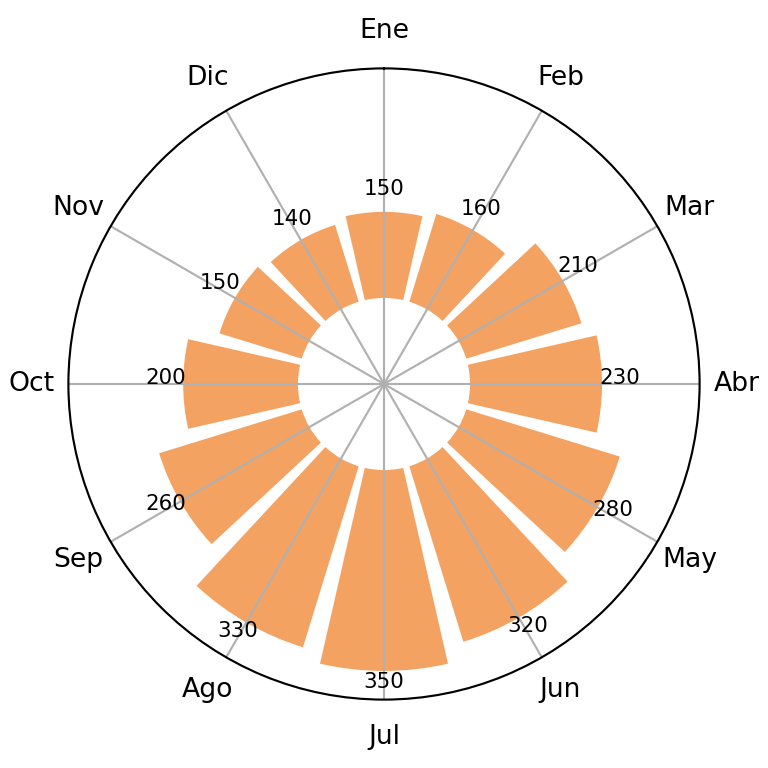
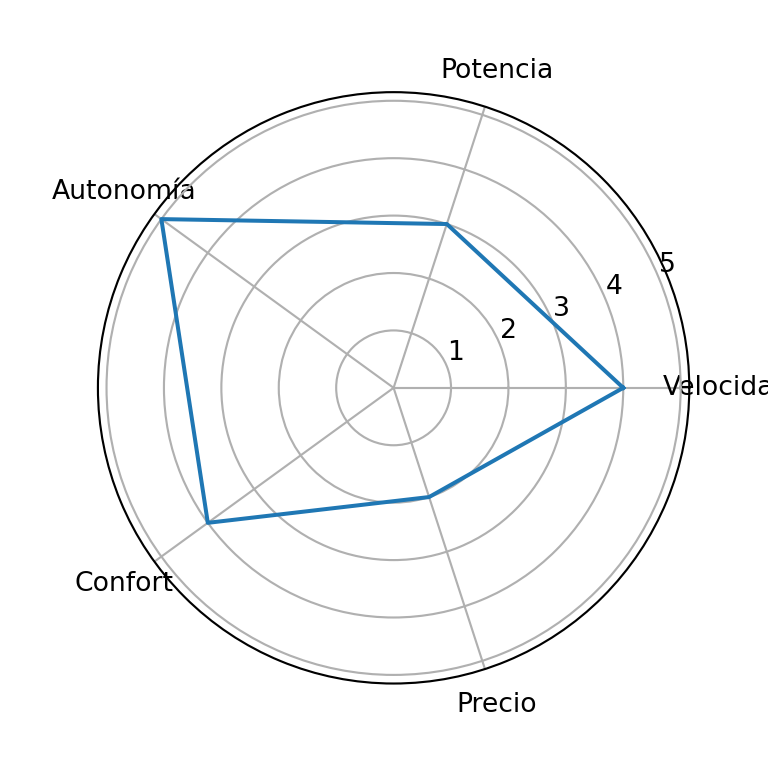
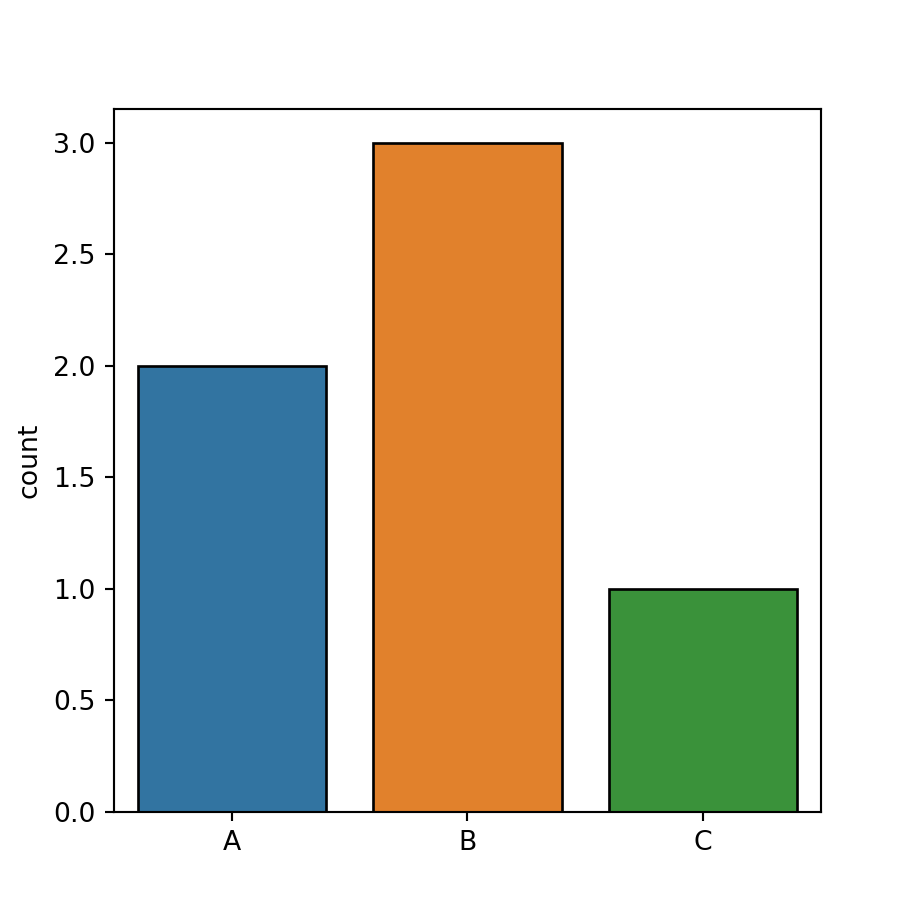
Consulta también cómo crear un gráfico de barras en matplotlib y un gráfico de radar en matplotlib.