Sample data
Consider the following data for illustration purposes:
import pandas as pd

# Data
df = pd.DataFrame({
    "city": ["Madrid", "Barcelona", "Valencia", "Seville", "Bilbao"],
    "lat": [40.4168, 41.3874, 39.4699, 37.3891, 43.2630],
    "lon": [-3.7038, 2.1686, -0.3763, -5.9845, -2.9350],
    "population": [3.3, 1.6, 0.8, 0.7, 0.3]})
Point map with scatter_geo
Unlike the bubble map, which shades an existing region, scatter_geo places a marker at each latitude/longitude pair directly on a world map, which does not require a Mapbox account or token.
import plotly.express as px

fig = px.scatter_geo(df, lat = "lat", lon = "lon",
                     hover_name = "city",
                     scope = "europe")

fig.show()
Size and color
Map a numeric column to size and color to encode two more variables in the same map.
import plotly.express as px

fig = px.scatter_geo(df, lat = "lat", lon = "lon",
                     size = "population", color = "population",
                     hover_name = "city",
                     scope = "europe")

fig.show()
Point map on a street map with scatter_mapbox
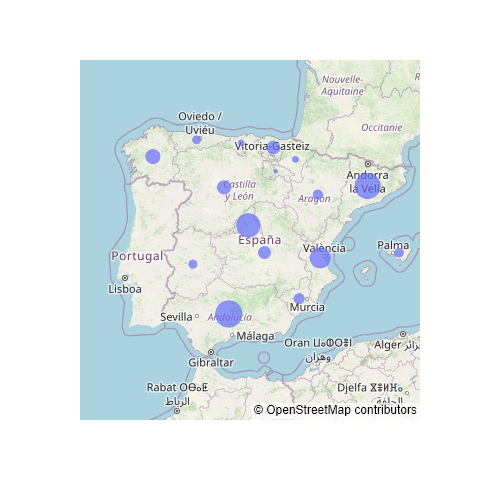
If you need an actual street map background (instead of a plain world outline), use scatter_mapbox with the open-street-map style, which is free and does not require a Mapbox token.
import plotly.express as px

fig = px.scatter_mapbox(df, lat = "lat", lon = "lon",
                        size = "population", color = "population",
                        hover_name = "city",
                        mapbox_style = "open-street-map",
                        zoom = 4)

fig.show()
Zoom and center
Control the initial view with zoom (higher values zoom in further) and center, a dict with lat and lon.
import plotly.express as px

fig = px.scatter_mapbox(df, lat = "lat", lon = "lon",
                        size = "population", color = "population",
                        hover_name = "city",
                        mapbox_style = "open-street-map",
                        zoom = 5, center = dict(lat = 40.0, lon = -3.7))

fig.show()