In a hexbin map, also called hexagonal tile map, each region is represented by a hexagon of the same size, placed approximately in its geographical position. Unlike a normal map, small regions get the same visual weight as big ones. The examples use a GeoJSON file with one hexagon per US state and the number of bee colonies of each state.
Hexagons of the US states
Read the GeoJSON file with geopandas, project it to Web Mercator (EPSG 3857) so the hexagons are regular and draw it with plot.
import geopandas as gpd
import matplotlib.pyplot as plt

hexmap = gpd.read_file("https://raw.githubusercontent.com/holtzy/The-Python-Graph-Gallery/master/static/data/us_states_hexgrid.geojson.json")
hexmap = hexmap.to_crs(epsg = 3857)

fig, ax = plt.subplots()
hexmap.plot(ax = ax, color = "#A8DADC", edgecolor = "white", linewidth = 2)
ax.axis("off")
# plt.show()
State labels
Write the abbreviation of each state, stored in the iso3166_2 column, at the center of its hexagon.
import geopandas as gpd
import matplotlib.pyplot as plt

hexmap = gpd.read_file("https://raw.githubusercontent.com/holtzy/The-Python-Graph-Gallery/master/static/data/us_states_hexgrid.geojson.json")
hexmap = hexmap.to_crs(epsg = 3857)

fig, ax = plt.subplots()
hexmap.plot(ax = ax, color = "#457B9D", edgecolor = "white", linewidth = 2)

for geom, label in zip(hexmap.geometry, hexmap["iso3166_2"]):
    ax.annotate(label, (geom.centroid.x, geom.centroid.y), ha = "center", va = "center",
                color = "white", fontsize = 7)
ax.axis("off")
# plt.show()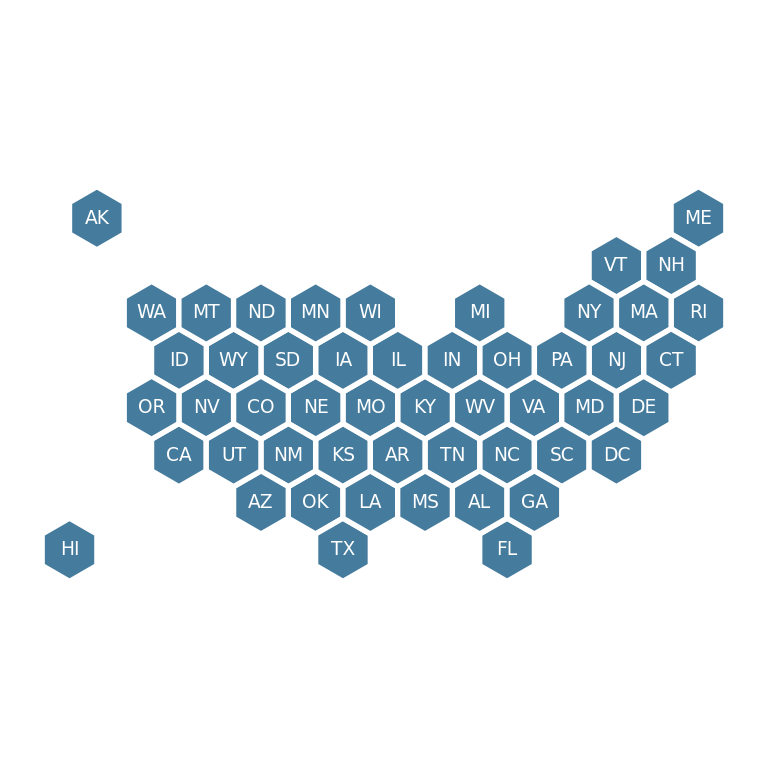
Color by a variable
Pass a numeric column to column to color each hexagon. Here, the number of bee colonies in each state.
import geopandas as gpd
import matplotlib.pyplot as plt

hexmap = gpd.read_file("https://raw.githubusercontent.com/holtzy/The-Python-Graph-Gallery/master/static/data/us_states_hexgrid.geojson.json")
hexmap = hexmap.to_crs(epsg = 3857)

fig, ax = plt.subplots()
hexmap.plot(column = "bees", cmap = "YlOrBr", edgecolor = "white", linewidth = 2,
            legend = True, legend_kwds = {"label": "Bee colonies", "orientation": "horizontal", "shrink": 0.6}, ax = ax)

for geom, label in zip(hexmap.geometry, hexmap["iso3166_2"]):
    ax.annotate(label, (geom.centroid.x, geom.centroid.y), ha = "center", va = "center", fontsize = 6)
ax.axis("off")
# plt.show()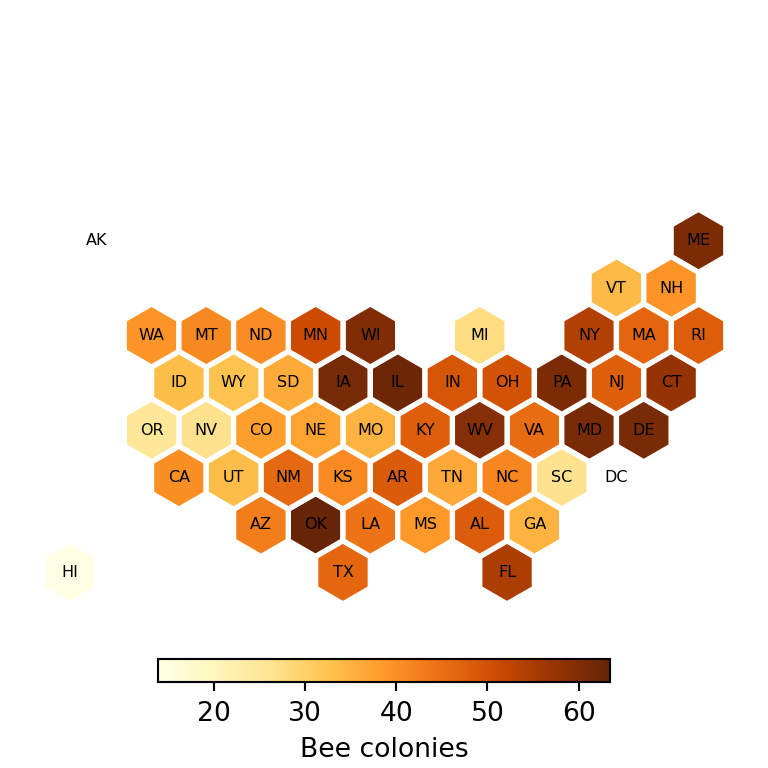
See also how to create a choropleth map with geopandas, which uses the real shape of the regions.