Static map in Python with geopandas
Unlike the interactive choropleth map built with plotly, geopandas renders a static map through matplotlib, which is often enough for a report or a document. Read any shapefile or geojson with read_file and call .plot() on the resulting GeoDataFrame.
import geopandas
import matplotlib.pyplot as plt

# Shapefile with the Spanish autonomous communities
shp = geopandas.read_file("https://raw.githubusercontent.com/R-CoderDotCom/data/main/shapefile_spain/spain.zip")

shp.plot()

# plt.show()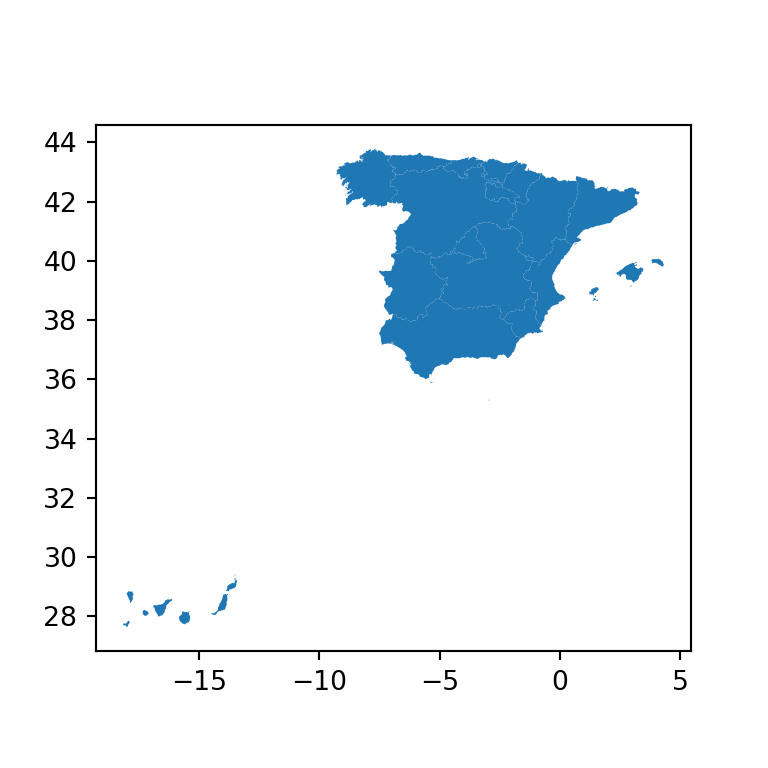
Choropleth map
The shapefile used above already includes an unemp_rate column. Pass its name to the column argument, together with cmap and legend = True, to color each region by its value and add a colorbar.
import geopandas
import matplotlib.pyplot as plt

shp = geopandas.read_file("https://raw.githubusercontent.com/R-CoderDotCom/data/main/shapefile_spain/spain.zip")

shp.plot(column = "unemp_rate", cmap = "viridis", legend = True)

# plt.show()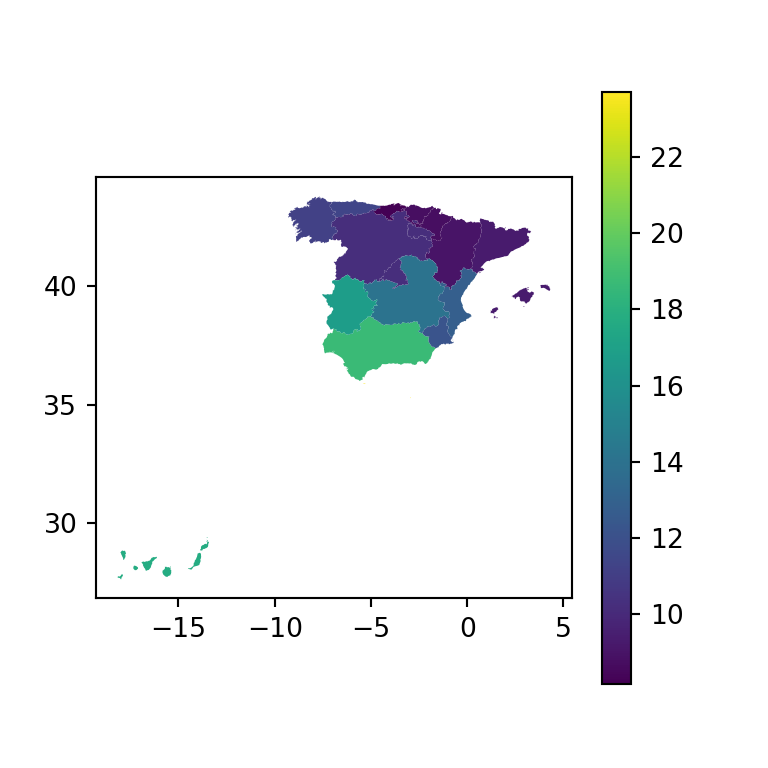
Border color
Add a border around each region with edgecolor and linewidth.
import geopandas
import matplotlib.pyplot as plt

shp = geopandas.read_file("https://raw.githubusercontent.com/R-CoderDotCom/data/main/shapefile_spain/spain.zip")

shp.plot(column = "unemp_rate", cmap = "viridis", legend = True,
        edgecolor = "white", linewidth = 0.5)

# plt.show()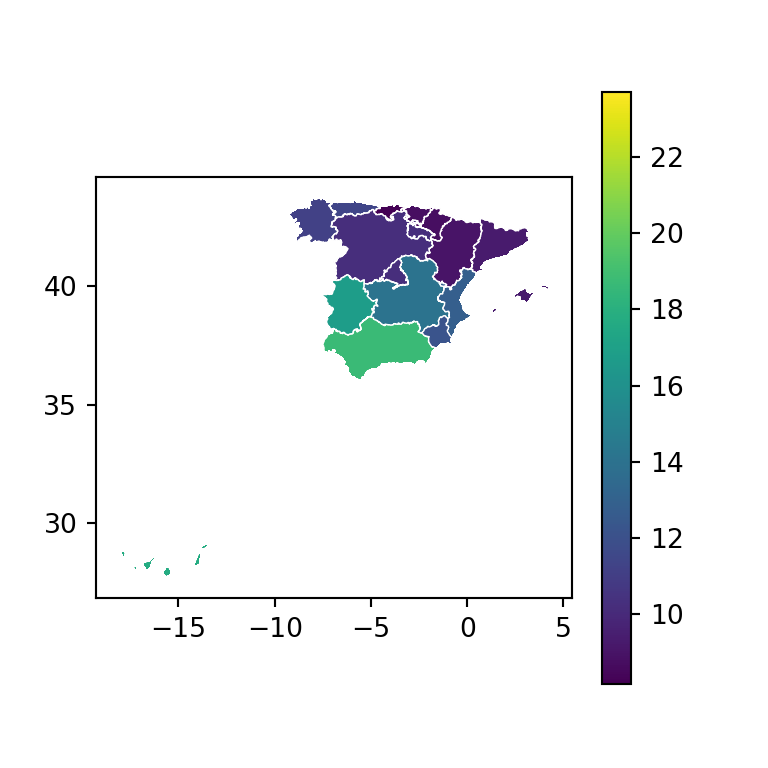
Removing the axis
plot returns a regular matplotlib Axes, so its coordinate axis (latitude and longitude) can be hidden the usual way with set_axis_off.
import geopandas
import matplotlib.pyplot as plt

shp = geopandas.read_file("https://raw.githubusercontent.com/R-CoderDotCom/data/main/shapefile_spain/spain.zip")

ax = shp.plot(column = "unemp_rate", cmap = "viridis", legend = True)
ax.set_axis_off()

# plt.show()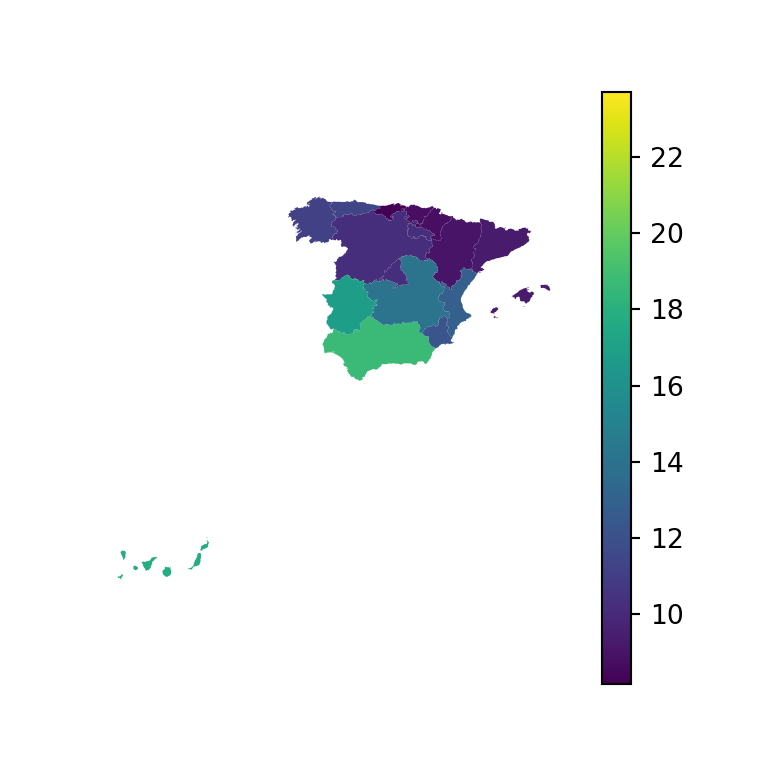
Title
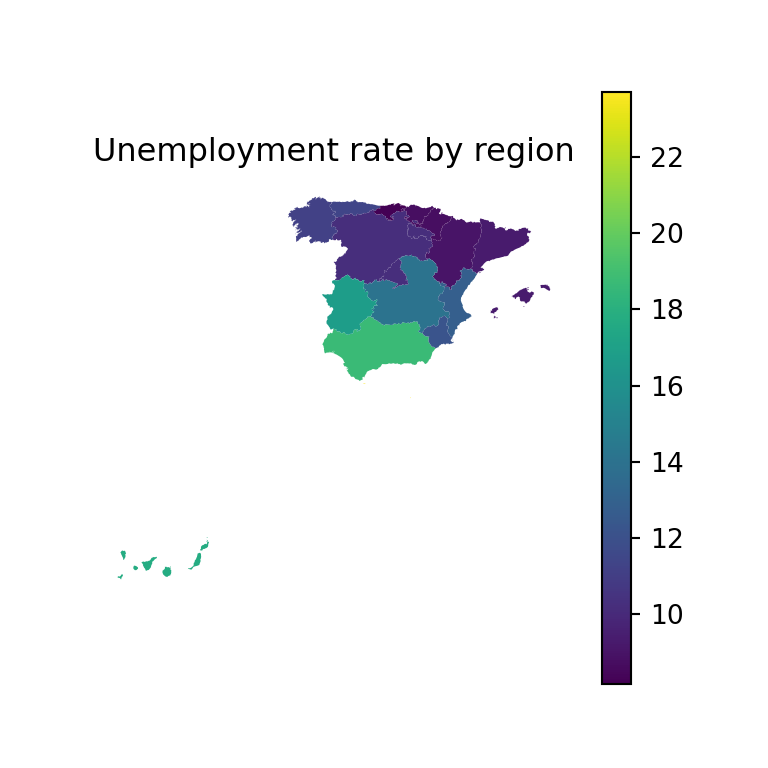
Since ax is a regular matplotlib Axes, add a title with set_title.
import geopandas
import matplotlib.pyplot as plt

shp = geopandas.read_file("https://raw.githubusercontent.com/R-CoderDotCom/data/main/shapefile_spain/spain.zip")

ax = shp.plot(column = "unemp_rate", cmap = "viridis", legend = True)
ax.set_axis_off()
ax.set_title("Unemployment rate by region")

# plt.show()