A cartogram distorts the geography of a map so that the size of each region represents a variable instead of its area. In a Dorling cartogram each region is replaced by a circle whose area is proportional to the variable, and the circles are moved apart so they don’t overlap. The examples represent the population of the countries of the world, read with geopandas.
Proportional circles
Place a circle on each country with an area proportional to its population. The radius is the square root of the value, so the area (not the radius) is proportional to the population.
import numpy as np
import geopandas as gpd
import matplotlib.pyplot as plt

world = gpd.read_file("https://naciscdn.org/naturalearth/110m/cultural/ne_110m_admin_0_countries.zip")
world = world[world["POP_EST"] > 0].to_crs("+proj=robin")
pts = world.representative_point()
world["x"], world["y"] = pts.x, pts.y
world["r"] = np.sqrt(world["POP_EST"] / np.pi) * 100

fig, ax = plt.subplots()
world.plot(ax = ax, color = "lightgray", edgecolor = "white", linewidth = 0.3)

for x, y, r in zip(world["x"], world["y"], world["r"]):
    ax.add_patch(plt.Circle((x, y), r, color = "tab:red", alpha = 0.5))
ax.axis("off")
# plt.show()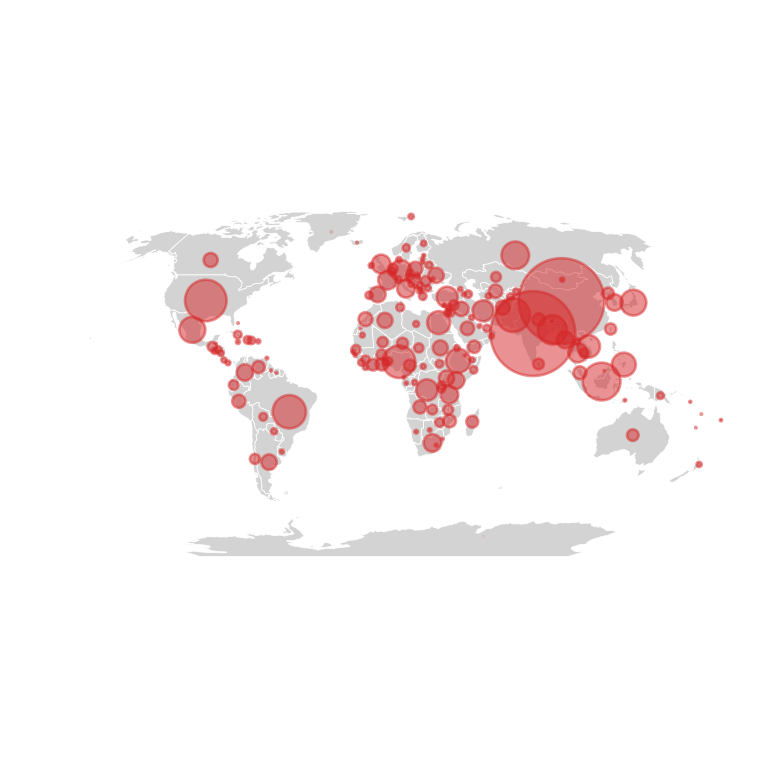
Dorling cartogram
The big circles overlap. The following function moves the circles apart step by step until they don’t overlap, keeping them as close as possible to their original position. The map of the countries is no longer needed.
import numpy as np
import geopandas as gpd
import matplotlib.pyplot as plt

world = gpd.read_file("https://naciscdn.org/naturalearth/110m/cultural/ne_110m_admin_0_countries.zip")
world = world[world["POP_EST"] > 0].to_crs("+proj=robin")
pts = world.representative_point()
world["x"], world["y"] = pts.x, pts.y
world["r"] = np.sqrt(world["POP_EST"] / np.pi) * 100

def dorling(x, y, r, iterations = 200):
    """Move the circles apart until they don't overlap."""
    x, y = x.copy(), y.copy()
    for _ in range(iterations):
        dx = x[:, None] - x[None, :]
        dy = y[:, None] - y[None, :]
        dist = np.hypot(dx, dy) + 1e-9
        overlap = np.clip(r[:, None] + r[None, :] - dist, 0, None)
        np.fill_diagonal(overlap, 0)
        x += (overlap * dx / dist).sum(axis = 1) / 4
        y += (overlap * dy / dist).sum(axis = 1) / 4
    return x, y

x, y = dorling(world["x"].values, world["y"].values, world["r"].values)

fig, ax = plt.subplots()
for xi, yi, r in zip(x, y, world["r"]):
    ax.add_patch(plt.Circle((xi, yi), r, color = "tab:red", alpha = 0.7, ec = "white"))
ax.set_xlim(x.min() - 3e6, x.max() + 3e6)
ax.set_ylim(y.min() - 3e6, y.max() + 3e6)
ax.set_aspect("equal")
ax.axis("off")
# plt.show()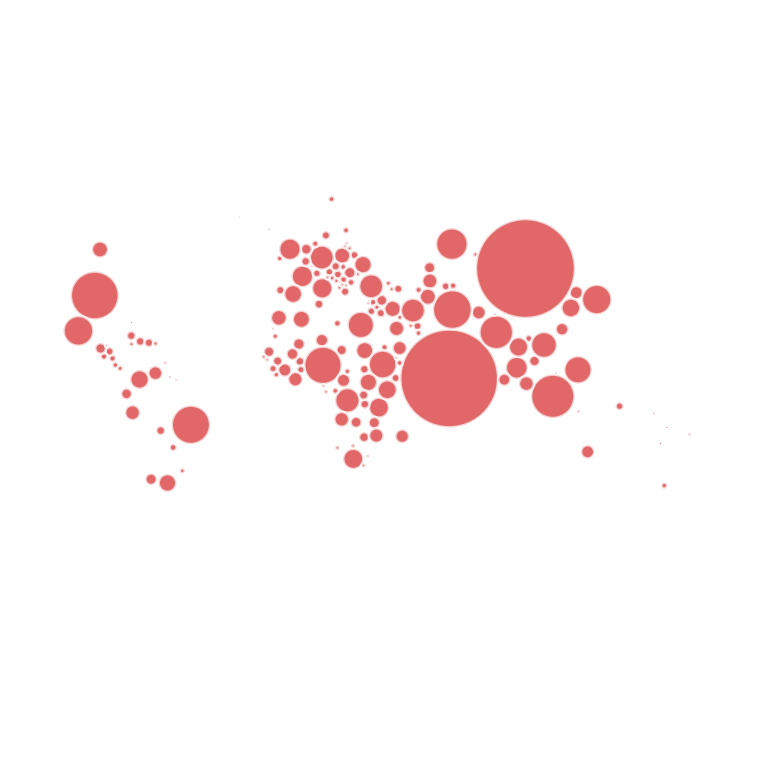
Color by continent and labels
Color each circle by continent and write the name of the biggest countries.
import numpy as np
import geopandas as gpd
import matplotlib.pyplot as plt

world = gpd.read_file("https://naciscdn.org/naturalearth/110m/cultural/ne_110m_admin_0_countries.zip")
world = world[world["POP_EST"] > 0].to_crs("+proj=robin")
pts = world.representative_point()
world["x"], world["y"] = pts.x, pts.y
world["r"] = np.sqrt(world["POP_EST"] / np.pi) * 100

def dorling(x, y, r, iterations = 200):
    """Move the circles apart until they don't overlap."""
    x, y = x.copy(), y.copy()
    for _ in range(iterations):
        dx = x[:, None] - x[None, :]
        dy = y[:, None] - y[None, :]
        dist = np.hypot(dx, dy) + 1e-9
        overlap = np.clip(r[:, None] + r[None, :] - dist, 0, None)
        np.fill_diagonal(overlap, 0)
        x += (overlap * dx / dist).sum(axis = 1) / 4
        y += (overlap * dy / dist).sum(axis = 1) / 4
    return x, y

x, y = dorling(world["x"].values, world["y"].values, world["r"].values)
continents = world["CONTINENT"].unique()
colors = dict(zip(continents, plt.cm.Set2.colors))

fig, ax = plt.subplots()
for xi, yi, r, cont, name in zip(x, y, world["r"], world["CONTINENT"], world["NAME"]):
    ax.add_patch(plt.Circle((xi, yi), r, color = colors[cont], ec = "white"))
    if r > 0.8e6:
        ax.text(xi, yi, name, ha = "center", va = "center", fontsize = 6)
ax.set_xlim(x.min() - 3e6, x.max() + 3e6)
ax.set_ylim(y.min() - 3e6, y.max() + 3e6)
ax.set_aspect("equal")
ax.axis("off")
# plt.show()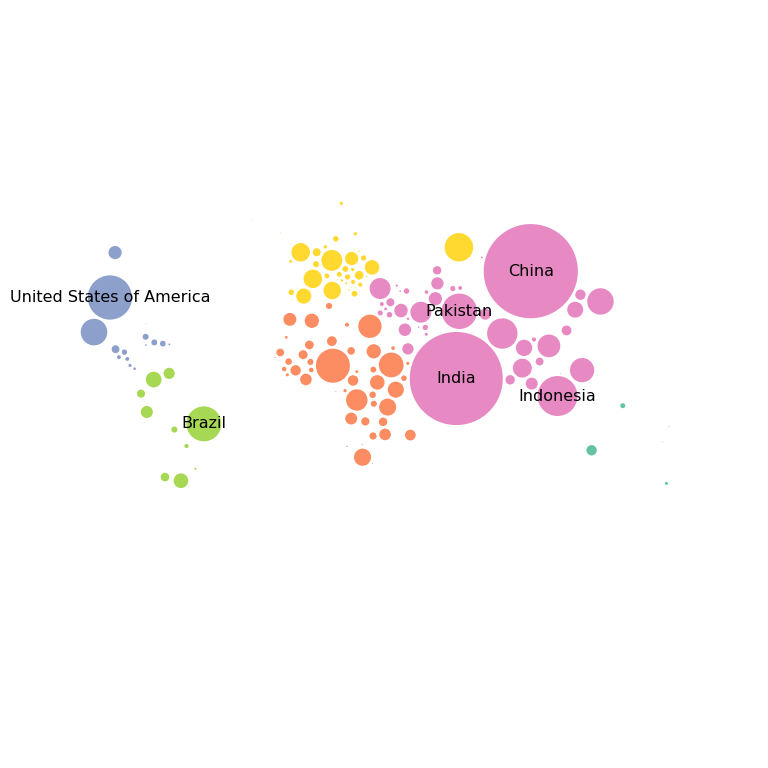
See also how to create a choropleth map with geopandas and a bubble map in plotly.