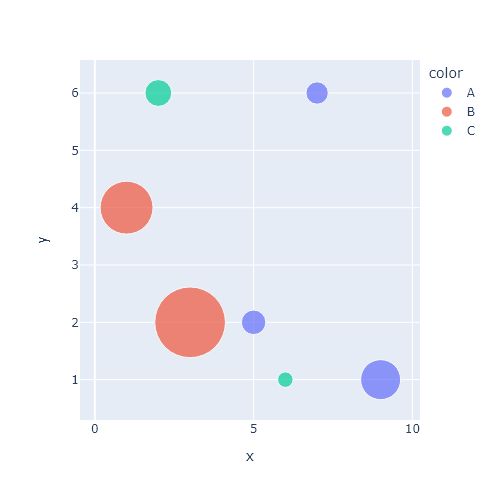
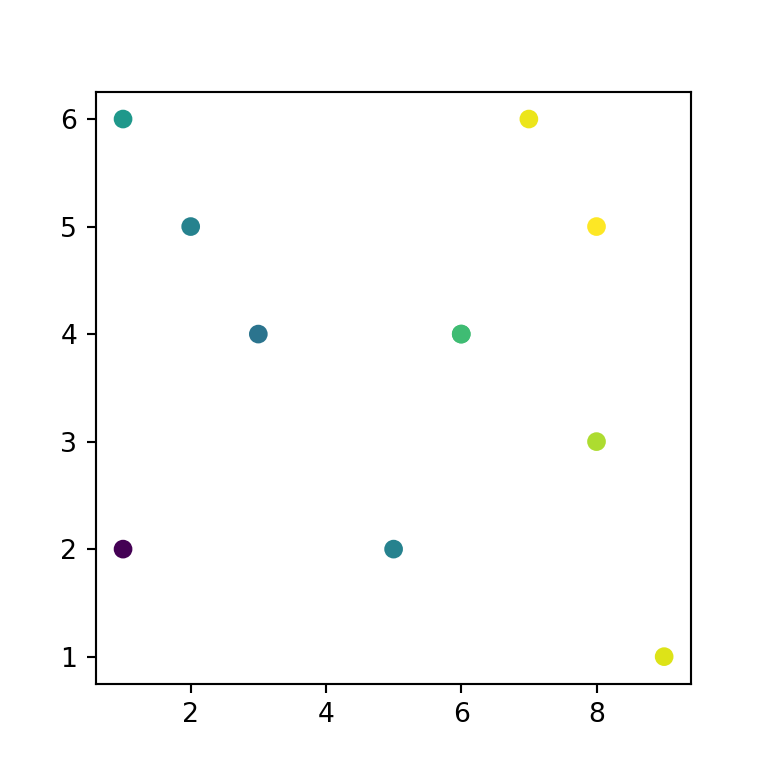
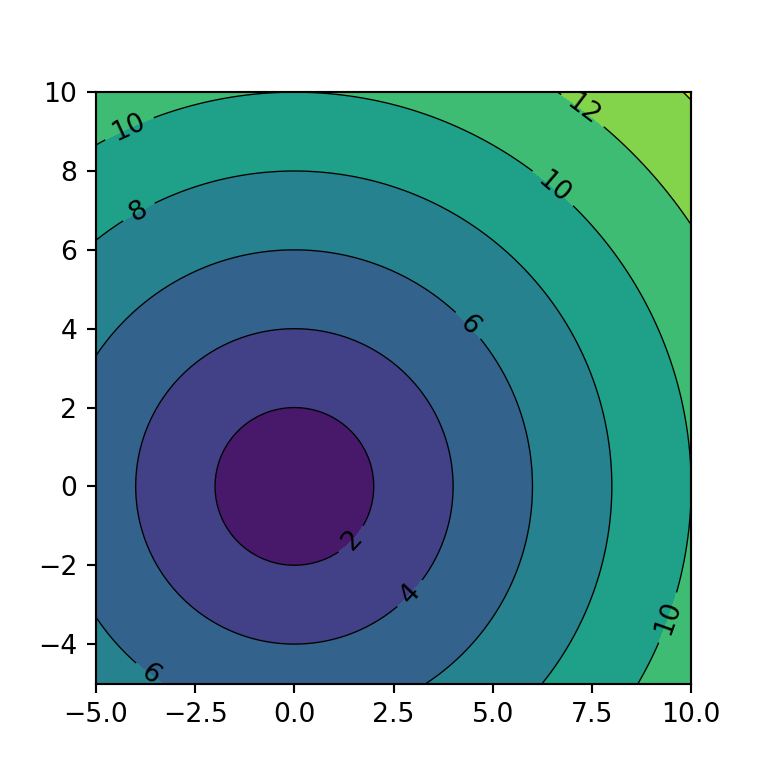
Scatter plots show the relationship between two numeric variables. In pandas they are created with plot.scatter, indicating the columns for the X and Y axes.
Scatter plot with plot.scatter
Pass the names of the columns to x and y.
import numpy as np
import pandas as pd
import matplotlib.pyplot as plt

rng = np.random.default_rng(8)
height = rng.normal(170, 9, 300)
df = pd.DataFrame({"height": height,
                   "weight": 0.9 * height - 85 + rng.normal(0, 7, 300),
                   "age": rng.uniform(18, 70, 300).round(),
                   "sex": rng.choice(["Female", "Male"], 300)})

df.plot.scatter(x = "height", y = "weight")
# plt.show()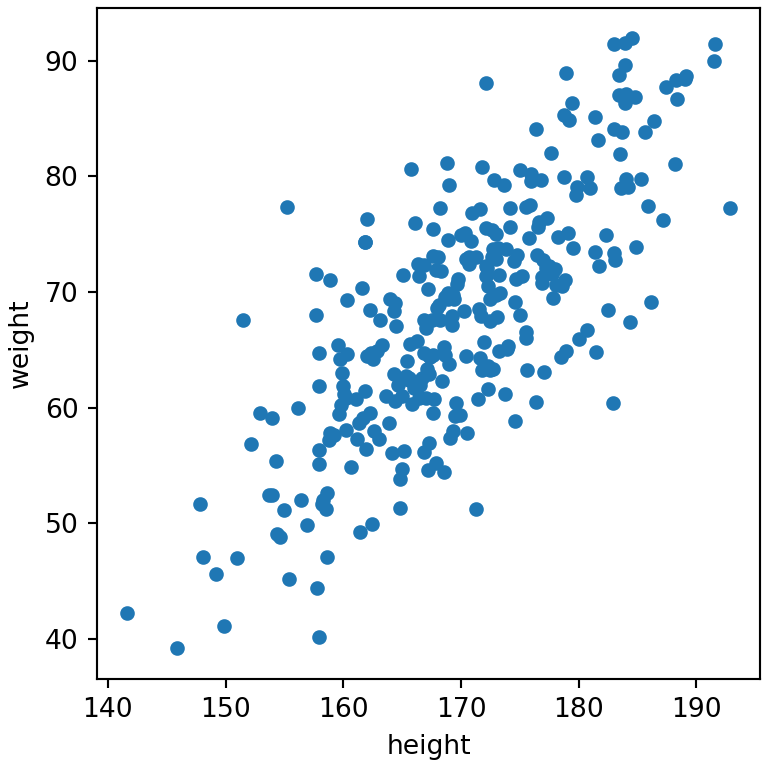
Color by a variable
The c argument colors the points by the values of a column. With a numeric column a color bar is added; choose the colors with colormap.
import numpy as np
import pandas as pd
import matplotlib.pyplot as plt

rng = np.random.default_rng(8)
height = rng.normal(170, 9, 300)
df = pd.DataFrame({"height": height,
                   "weight": 0.9 * height - 85 + rng.normal(0, 7, 300),
                   "age": rng.uniform(18, 70, 300).round(),
                   "sex": rng.choice(["Female", "Male"], 300)})

df.plot.scatter(x = "height", y = "weight", c = "age", colormap = "viridis")
# plt.show()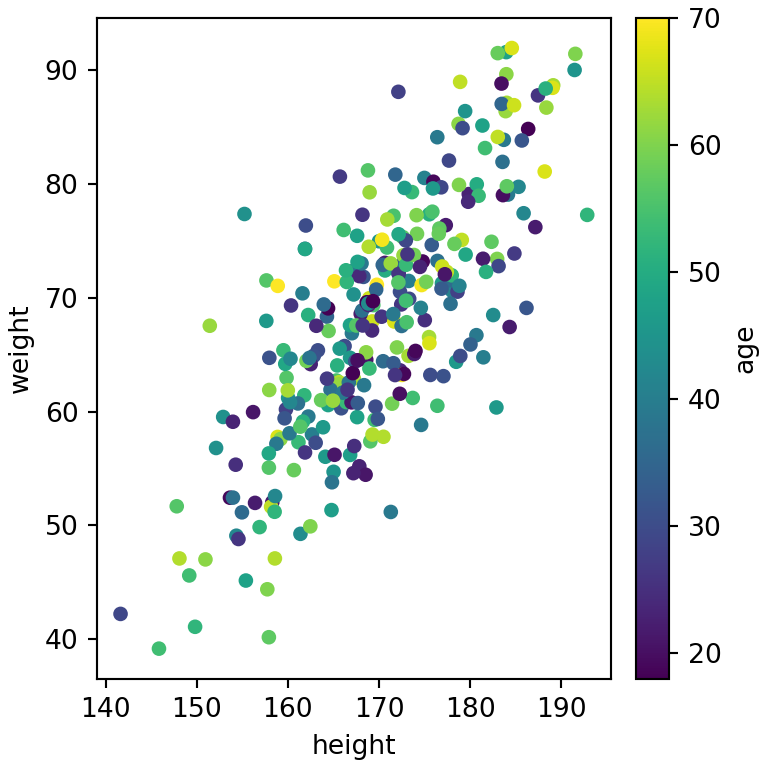
Color by group
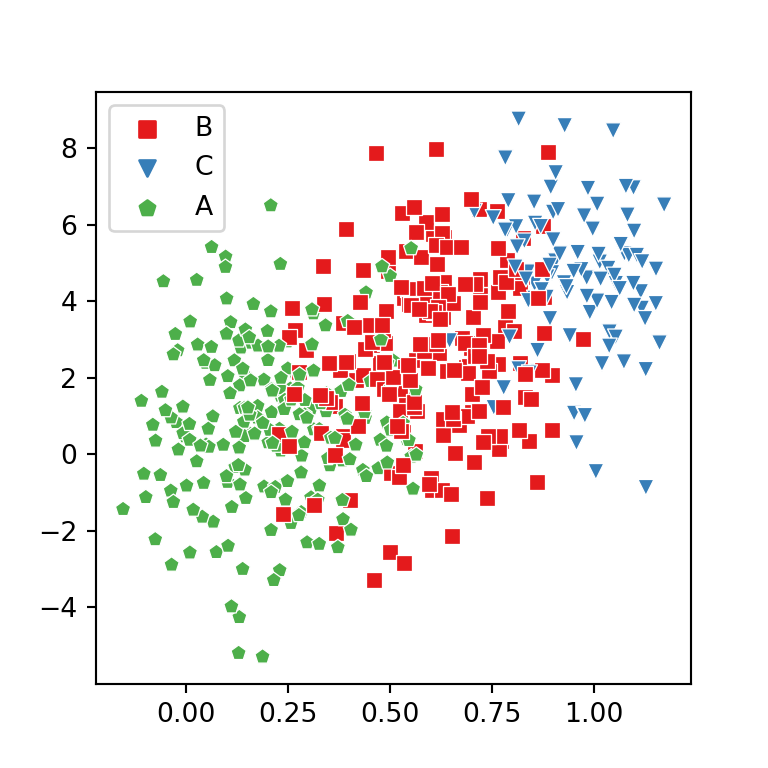
To color the points by a categorical variable map each group to a color.
import numpy as np
import pandas as pd
import matplotlib.pyplot as plt

rng = np.random.default_rng(8)
height = rng.normal(170, 9, 300)
df = pd.DataFrame({"height": height,
                   "weight": 0.9 * height - 85 + rng.normal(0, 7, 300),
                   "age": rng.uniform(18, 70, 300).round(),
                   "sex": rng.choice(["Female", "Male"], 300)})

colors = {"Female": "#E76F51", "Male": "#264653"}

df.plot.scatter(x = "height", y = "weight", c = df["sex"].map(colors))
# plt.show()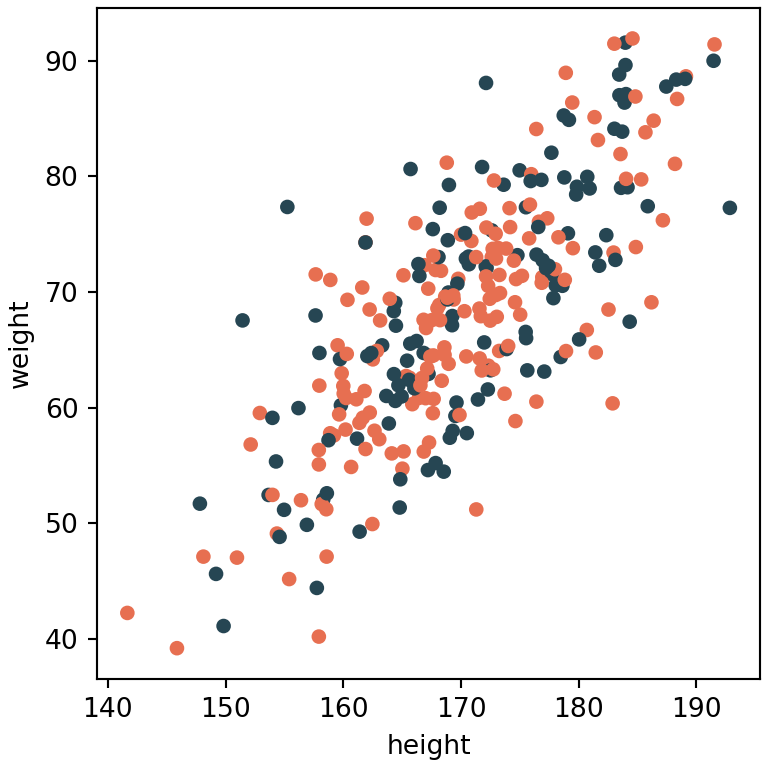
Size of the points
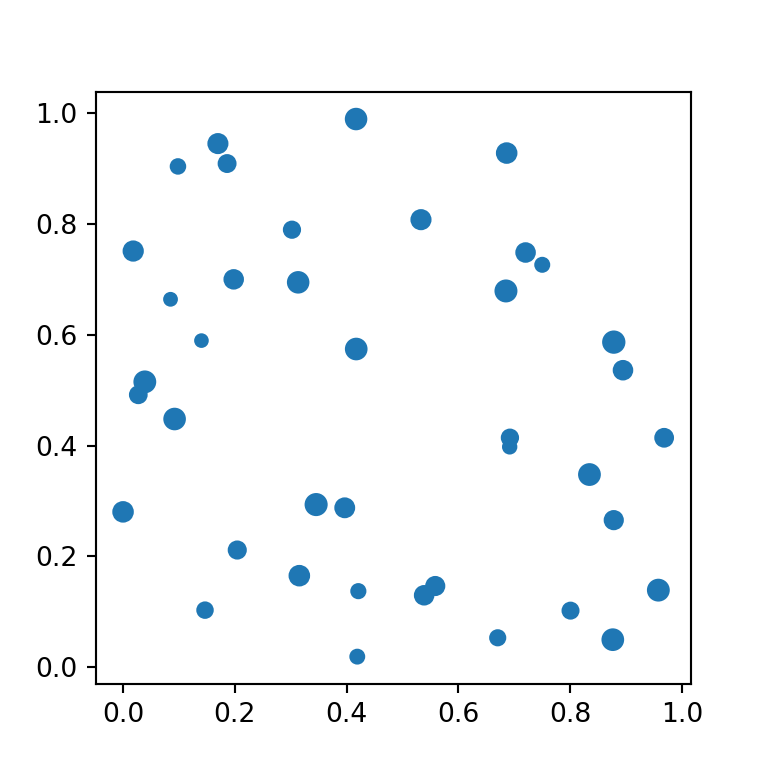
s sets the size of the points. Pass a number for a fixed size or a column to create a bubble chart.
import numpy as np
import pandas as pd
import matplotlib.pyplot as plt

rng = np.random.default_rng(8)
height = rng.normal(170, 9, 300)
df = pd.DataFrame({"height": height,
                   "weight": 0.9 * height - 85 + rng.normal(0, 7, 300),
                   "age": rng.uniform(18, 70, 300).round(),
                   "sex": rng.choice(["Female", "Male"], 300)})

df.plot.scatter(x = "height", y = "weight", s = df["age"] * 2, alpha = 0.5)
# plt.show()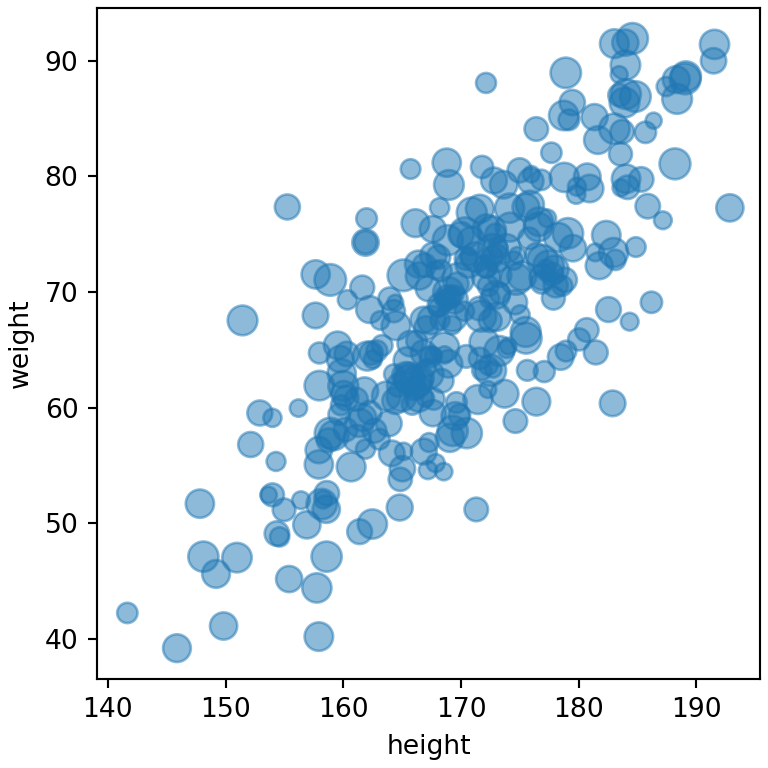
Scatter matrix
pandas.plotting.scatter_matrix creates a scatter plot for each pair of numeric columns and a histogram on the diagonal.
import numpy as np
import pandas as pd
import matplotlib.pyplot as plt

rng = np.random.default_rng(8)
height = rng.normal(170, 9, 300)
df = pd.DataFrame({"height": height,
                   "weight": 0.9 * height - 85 + rng.normal(0, 7, 300),
                   "age": rng.uniform(18, 70, 300).round(),
                   "sex": rng.choice(["Female", "Male"], 300)})
from pandas.plotting import scatter_matrix

scatter_matrix(df[["height", "weight", "age"]], figsize = (5, 5), alpha = 0.5)
# plt.show()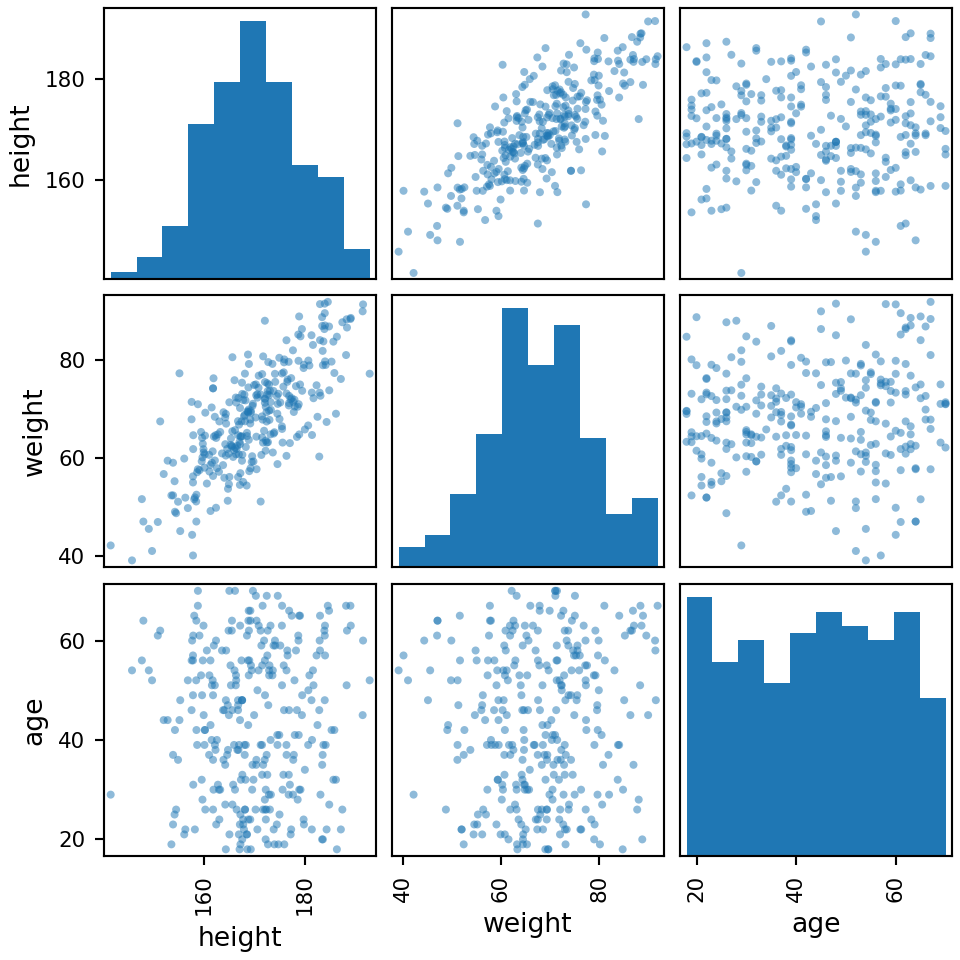
Hexbin chart for many points
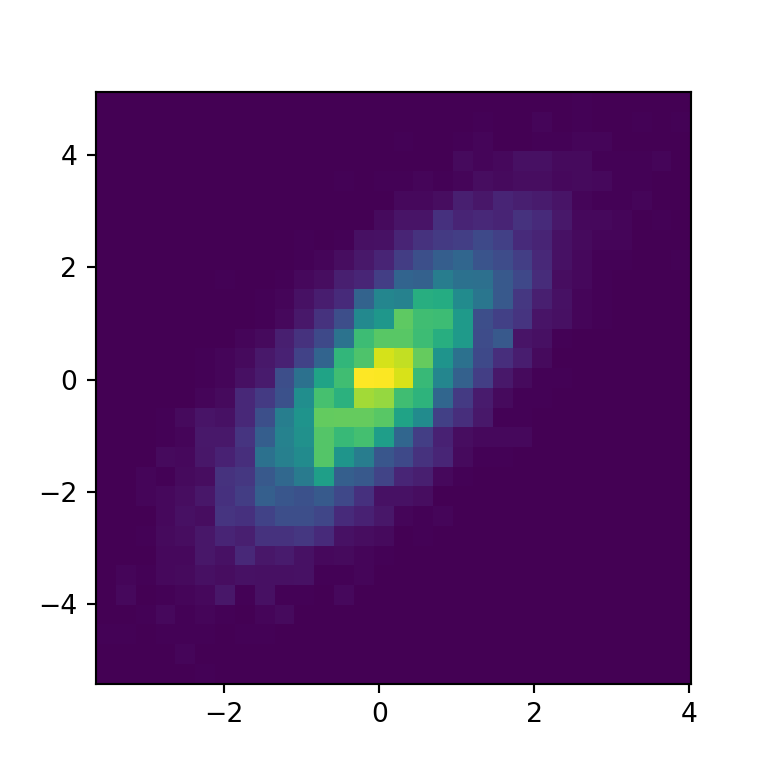
When there are many points they overlap. plot.hexbin groups them in hexagons colored by the number of observations.
import numpy as np
import pandas as pd
import matplotlib.pyplot as plt

rng = np.random.default_rng(8)
height = rng.normal(170, 9, 300)
df = pd.DataFrame({"height": height,
                   "weight": 0.9 * height - 85 + rng.normal(0, 7, 300),
                   "age": rng.uniform(18, 70, 300).round(),
                   "sex": rng.choice(["Female", "Male"], 300)})

df.plot.hexbin(x = "height", y = "weight", gridsize = 15, cmap = "Blues")
# plt.show()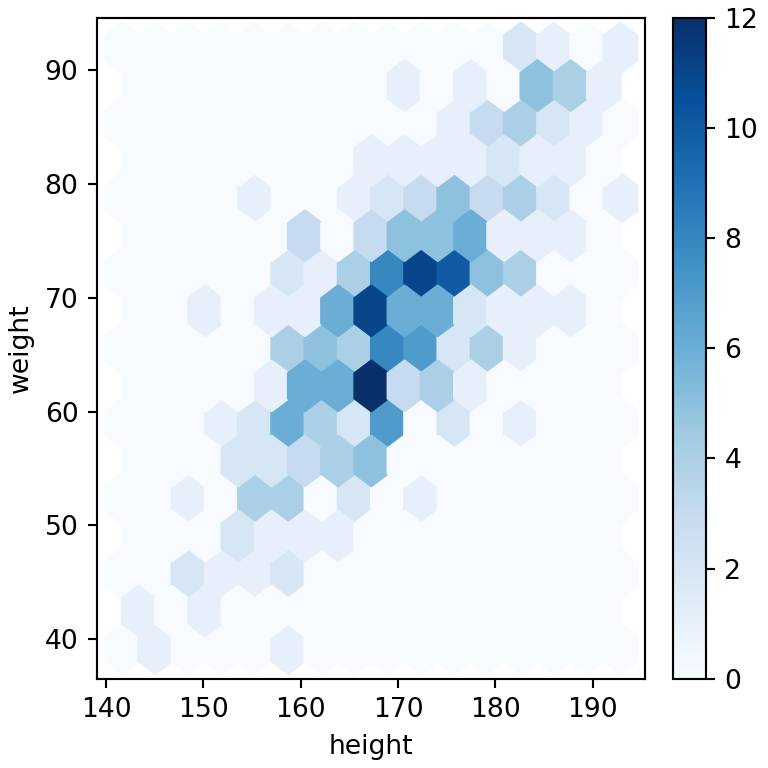
See also how to create a scatter plot in matplotlib or in seaborn and the plotting with pandas guide.