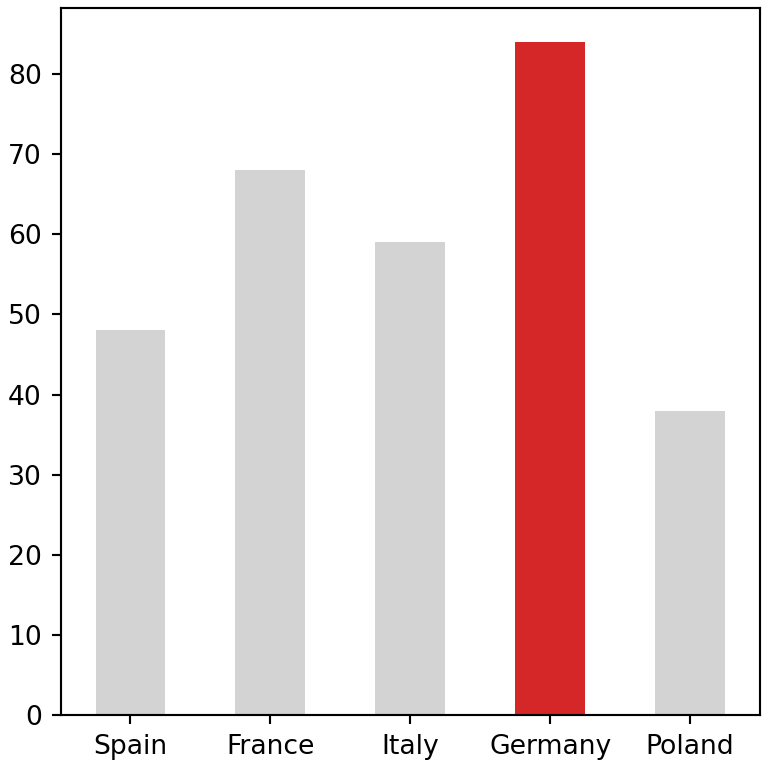
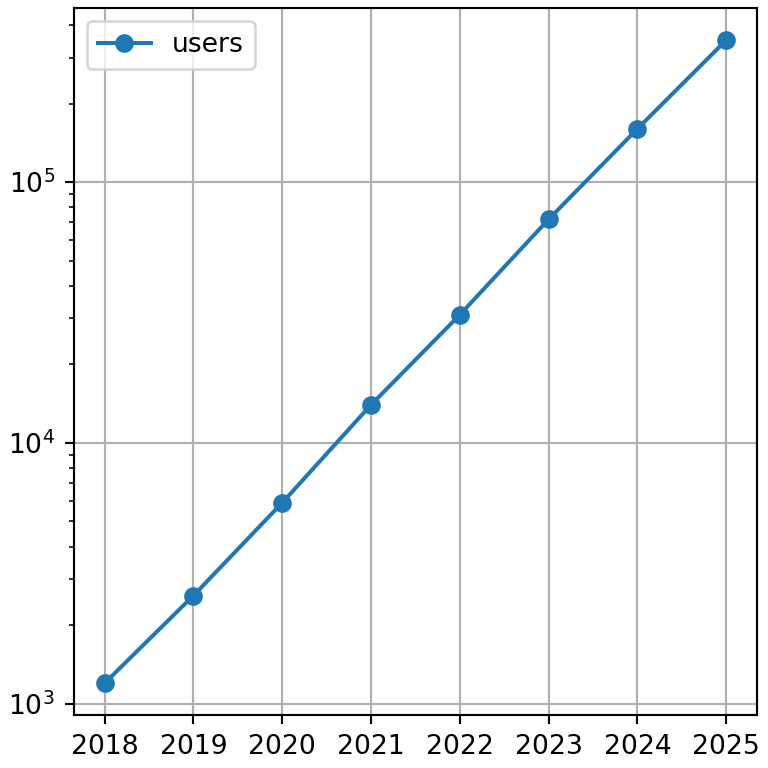
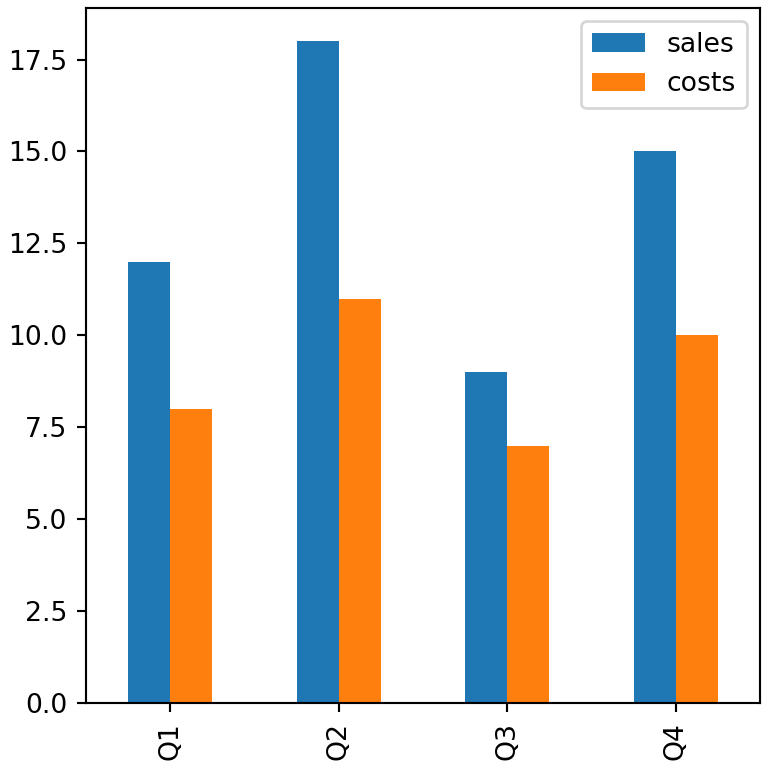
As pandas charts are made with matplotlib, their size and their general appearance are controlled in the same way as in matplotlib: with figsize and with style sheets.
Figure size with figsize
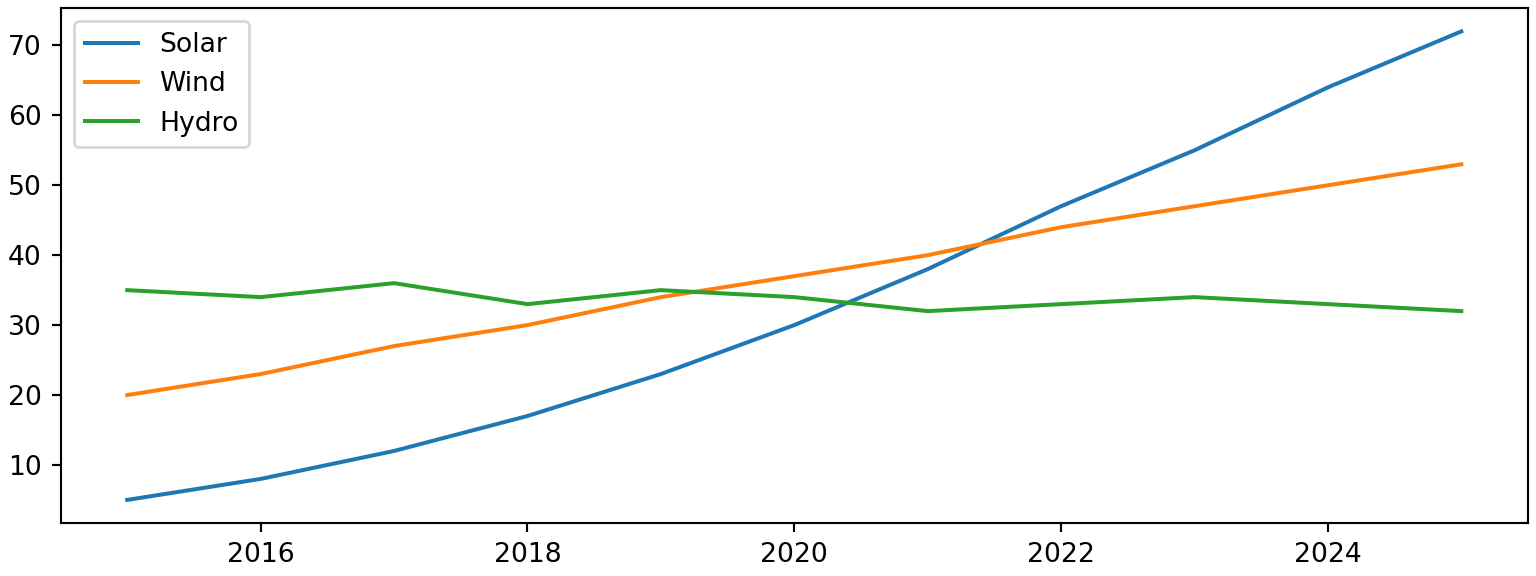
The figsize argument sets the width and the height of the figure in inches.
import pandas as pd
import matplotlib.pyplot as plt

df = pd.DataFrame({"Solar": [5, 8, 12, 17, 23, 30, 38, 47, 55, 64, 72],
                   "Wind": [20, 23, 27, 30, 34, 37, 40, 44, 47, 50, 53],
                   "Hydro": [35, 34, 36, 33, 35, 34, 32, 33, 34, 33, 32]},
                  index = range(2015, 2026))

df.plot(figsize = (8, 3))
# plt.show()
Default size
To change the size of all the charts change figure.figsize in rcParams.
import matplotlib.pyplot as plt

plt.rcParams["figure.figsize"] = (8, 5)
Style sheets
Any matplotlib style sheet changes the appearance of pandas charts. Use plt.style.use to apply it to all the charts or plt.style.context to apply it only to one.
import pandas as pd
import matplotlib.pyplot as plt

df = pd.DataFrame({"Solar": [5, 8, 12, 17, 23, 30, 38, 47, 55, 64, 72],
                   "Wind": [20, 23, 27, 30, 34, 37, 40, 44, 47, 50, 53],
                   "Hydro": [35, 34, 36, 33, 35, 34, 32, 33, 34, 33, 32]},
                  index = range(2015, 2026))

with plt.style.context("ggplot"):
    df.plot(linewidth = 2)
    plt.show()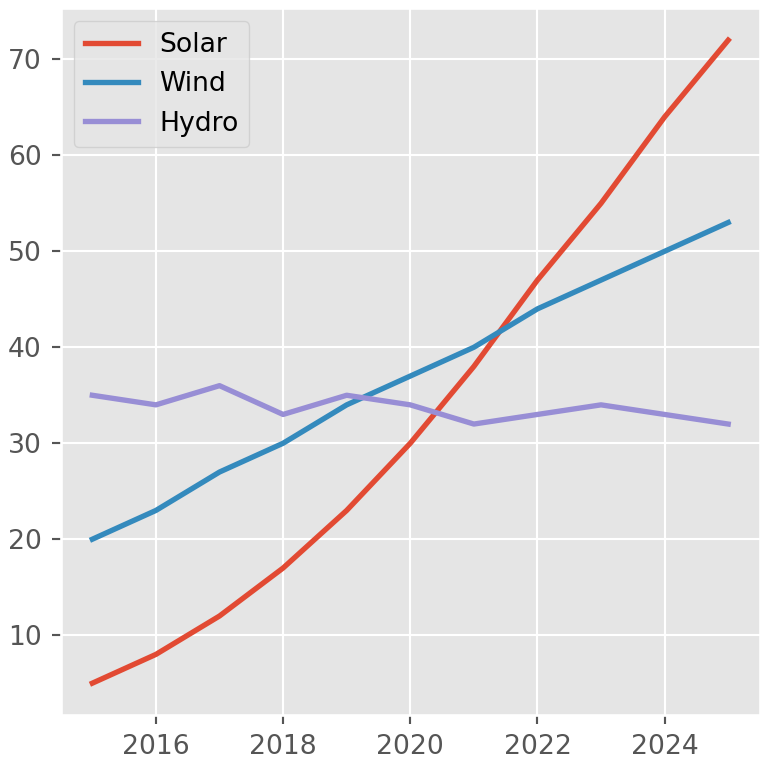
Dark background
import pandas as pd
import matplotlib.pyplot as plt

df = pd.DataFrame({"Solar": [5, 8, 12, 17, 23, 30, 38, 47, 55, 64, 72],
                   "Wind": [20, 23, 27, 30, 34, 37, 40, 44, 47, 50, 53],
                   "Hydro": [35, 34, 36, 33, 35, 34, 32, 33, 34, 33, 32]},
                  index = range(2015, 2026))

with plt.style.context("dark_background"):
    df.plot.area()
    plt.show()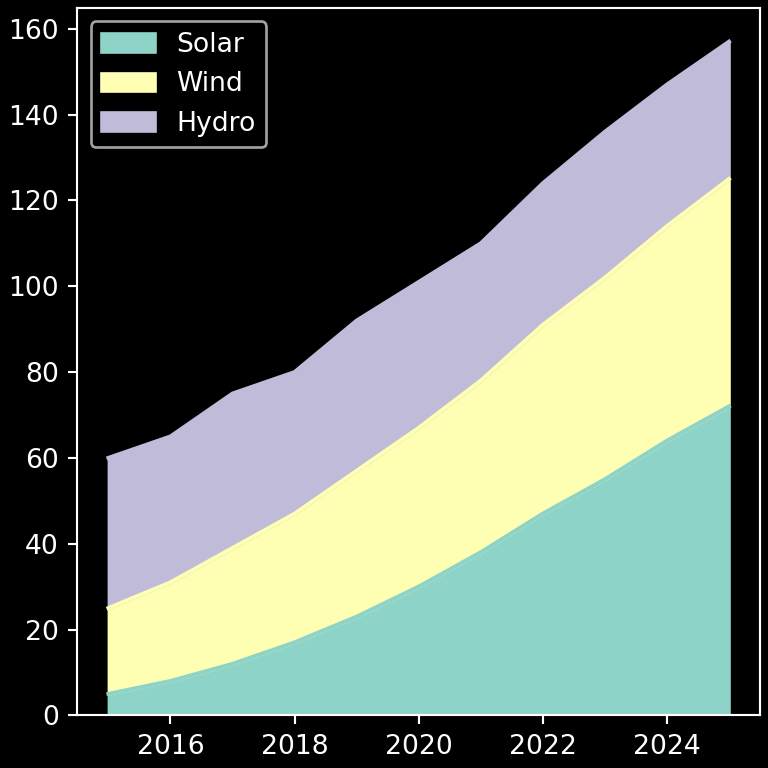
Seaborn themes
sns.set_theme changes the default matplotlib parameters, so the seaborn themes are also applied to pandas charts.
import pandas as pd
import matplotlib.pyplot as plt

df = pd.DataFrame({"Solar": [5, 8, 12, 17, 23, 30, 38, 47, 55, 64, 72],
                   "Wind": [20, 23, 27, 30, 34, 37, 40, 44, 47, 50, 53],
                   "Hydro": [35, 34, 36, 33, 35, 34, 32, 33, 34, 33, 32]},
                  index = range(2015, 2026))
import seaborn as sns

sns.set_theme(style = "whitegrid")
df.plot.bar(stacked = True, rot = 45)
# plt.show()
sns.reset_orig()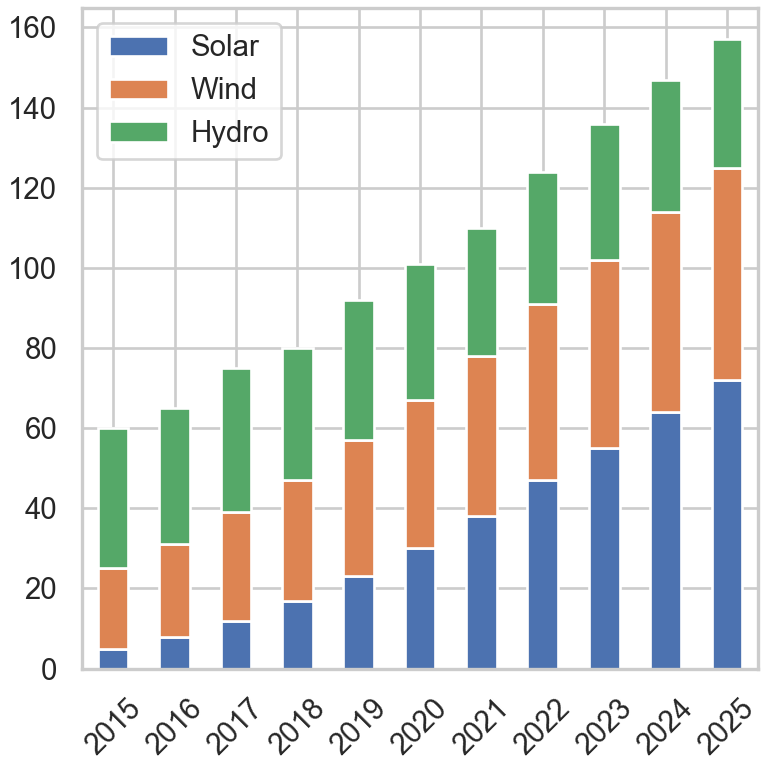
See the list of all the matplotlib style sheets and the seaborn themes, or how to change the figure size in matplotlib.