The plot method of pandas provides arguments to add a title and axis labels directly. For more control over their appearance use the matplotlib methods of the axes returned by plot.
Adding a title
Pass the text of the title to the title argument.
import pandas as pd
import matplotlib.pyplot as plt

df = pd.DataFrame({"Madrid": [6, 8, 11, 13, 17, 23, 26, 25, 21, 15, 10, 7],
                   "London": [5, 6, 8, 10, 13, 16, 18, 18, 15, 12, 8, 6],
                   "Oslo": [-4, -3, 1, 5, 11, 15, 17, 16, 11, 6, 1, -3]},
                  index = ["Jan", "Feb", "Mar", "Apr", "May", "Jun",
                           "Jul", "Aug", "Sep", "Oct", "Nov", "Dec"])

df.plot(title = "Average monthly temperature")
# plt.show()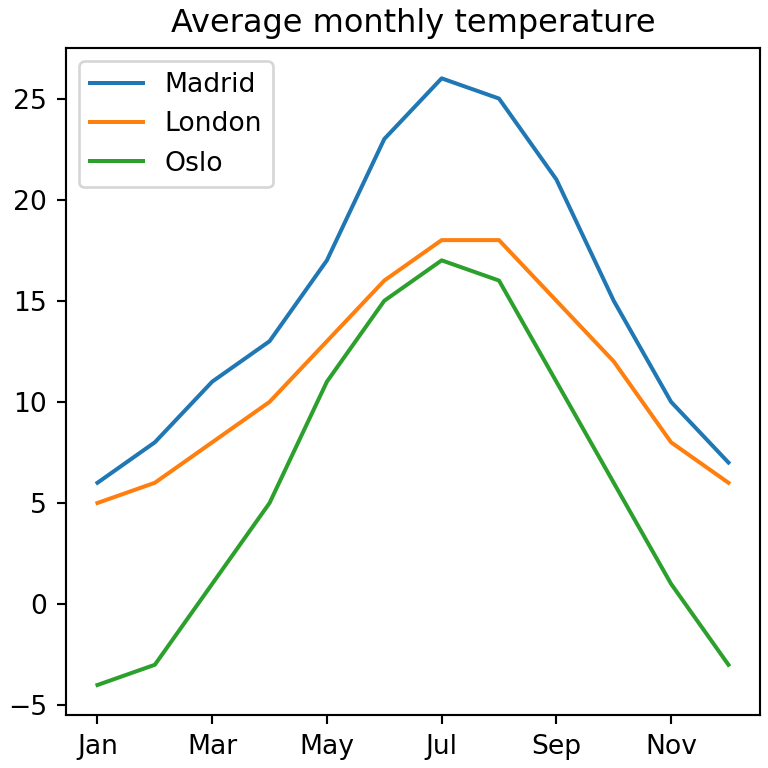
Axis labels
By default pandas uses the name of the index as label of the X axis. Set the labels of both axes with xlabel and ylabel.
import pandas as pd
import matplotlib.pyplot as plt

df = pd.DataFrame({"Madrid": [6, 8, 11, 13, 17, 23, 26, 25, 21, 15, 10, 7],
                   "London": [5, 6, 8, 10, 13, 16, 18, 18, 15, 12, 8, 6],
                   "Oslo": [-4, -3, 1, 5, 11, 15, 17, 16, 11, 6, 1, -3]},
                  index = ["Jan", "Feb", "Mar", "Apr", "May", "Jun",
                           "Jul", "Aug", "Sep", "Oct", "Nov", "Dec"])

df.plot(xlabel = "Month", ylabel = "Temperature (ºC)")
# plt.show()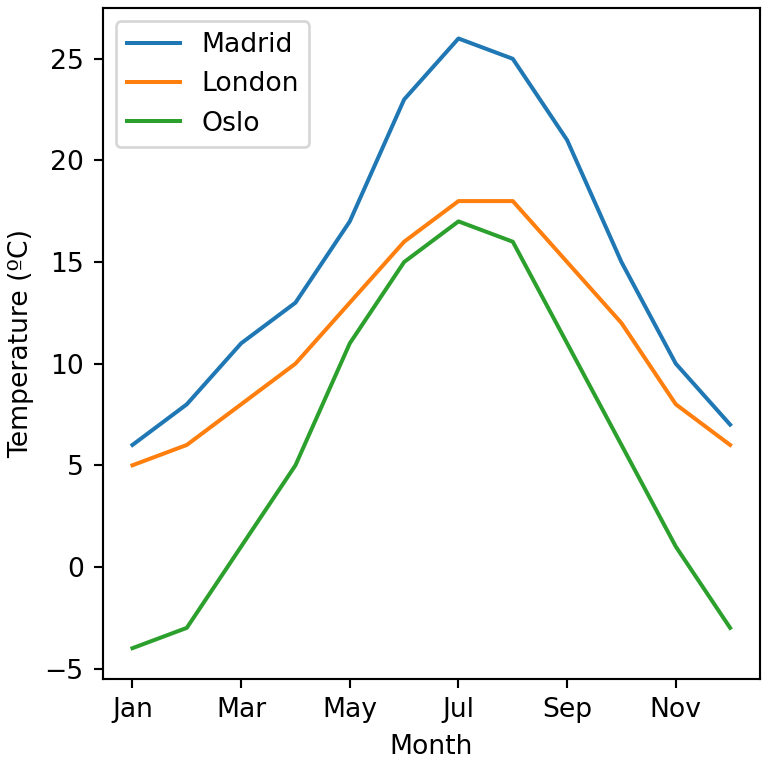
Title for each subplot
When using subplots = True you can pass a list to title, with one title for each subplot.
import pandas as pd
import matplotlib.pyplot as plt

df = pd.DataFrame({"Madrid": [6, 8, 11, 13, 17, 23, 26, 25, 21, 15, 10, 7],
                   "London": [5, 6, 8, 10, 13, 16, 18, 18, 15, 12, 8, 6],
                   "Oslo": [-4, -3, 1, 5, 11, 15, 17, 16, 11, 6, 1, -3]},
                  index = ["Jan", "Feb", "Mar", "Apr", "May", "Jun",
                           "Jul", "Aug", "Sep", "Oct", "Nov", "Dec"])

df.plot(subplots = True, layout = (3, 1), legend = False, sharey = True,
        title = ["Madrid", "London", "Oslo"])
# plt.show()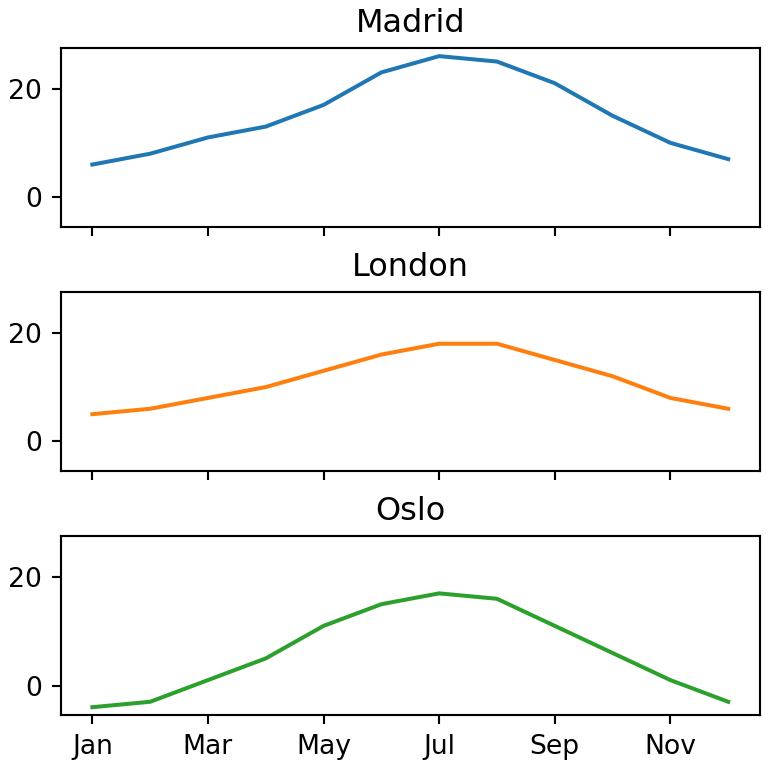
Title style with matplotlib
plot returns a matplotlib axes object. Use set_title, set_xlabel and set_ylabel to customize the font size, the color, the position or the weight of the texts.
import pandas as pd
import matplotlib.pyplot as plt

df = pd.DataFrame({"Madrid": [6, 8, 11, 13, 17, 23, 26, 25, 21, 15, 10, 7],
                   "London": [5, 6, 8, 10, 13, 16, 18, 18, 15, 12, 8, 6],
                   "Oslo": [-4, -3, 1, 5, 11, 15, 17, 16, 11, 6, 1, -3]},
                  index = ["Jan", "Feb", "Mar", "Apr", "May", "Jun",
                           "Jul", "Aug", "Sep", "Oct", "Nov", "Dec"])

ax = df.plot(linewidth = 2)

ax.set_title("Average monthly temperature", fontsize = 14,
             loc = "left", fontweight = "bold", color = "#1D3557")
ax.set_ylabel("Temperature (ºC)", color = "gray")
# plt.show()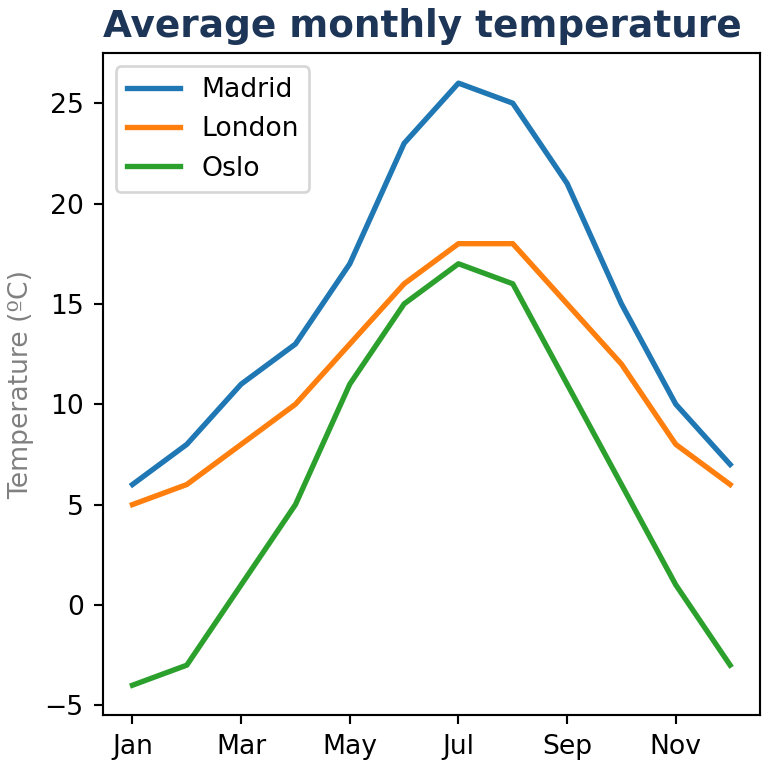
Figure title
To add a general title over several subplots use plt.suptitle.
import pandas as pd
import matplotlib.pyplot as plt

df = pd.DataFrame({"Madrid": [6, 8, 11, 13, 17, 23, 26, 25, 21, 15, 10, 7],
                   "London": [5, 6, 8, 10, 13, 16, 18, 18, 15, 12, 8, 6],
                   "Oslo": [-4, -3, 1, 5, 11, 15, 17, 16, 11, 6, 1, -3]},
                  index = ["Jan", "Feb", "Mar", "Apr", "May", "Jun",
                           "Jul", "Aug", "Sep", "Oct", "Nov", "Dec"])

df.plot(subplots = True, layout = (3, 1), legend = False, sharey = True)
plt.suptitle("Temperature by city")
# plt.show()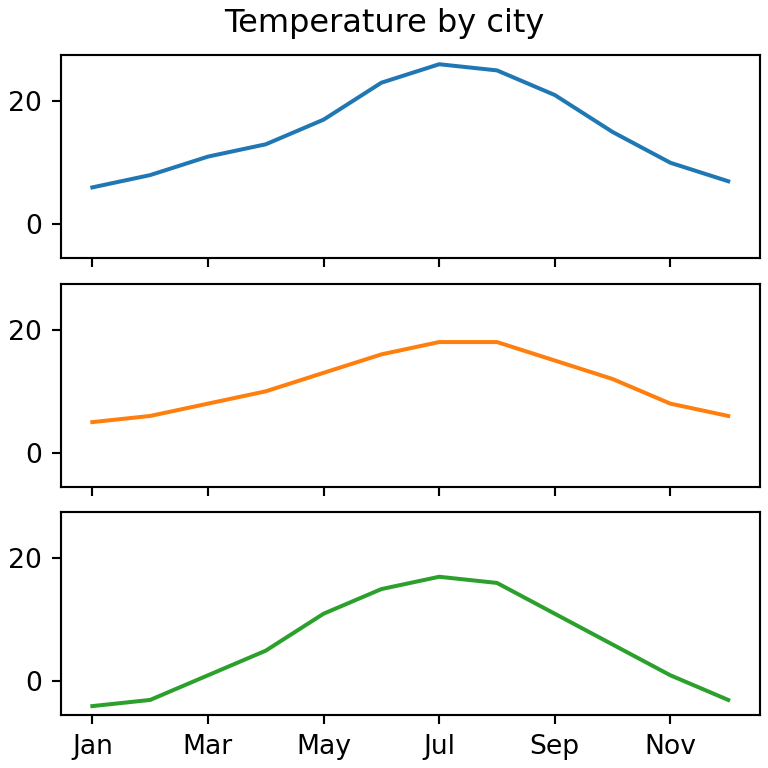
See the titles in matplotlib tutorial for more options.